
|
|||||
|
 | |
| |
| |
| |
| |
| |
|
Gene: ZDHHC17 |
Gene summary for ZDHHC17 |
| Gene information | Species | Human | Gene symbol | ZDHHC17 | Gene ID | 23390 |
| Gene name | zinc finger DHHC-type palmitoyltransferase 17 | |
| Gene Alias | DHHC-17 | |
| Cytomap | 12q21.2 | |
| Gene Type | protein-coding | GO ID | GO:0000165 | UniProtAcc | Q8IUH5 |
Top |
Malignant transformation analysis |
| Identification of the aberrant gene expression in precancerous and cancerous lesions by comparing the gene expression of stem-like cells in diseased tissues with normal stem cells |
| Entrez ID | Symbol | Replicates | Species | Organ | Tissue | Adj P-value | Log2FC | Malignancy |
| 23390 | ZDHHC17 | LZE2D | Human | Esophagus | HGIN | 2.27e-02 | 2.83e-01 | 0.0642 |
| 23390 | ZDHHC17 | LZE24T | Human | Esophagus | ESCC | 2.13e-06 | 1.59e-01 | 0.0596 |
| 23390 | ZDHHC17 | P1T-E | Human | Esophagus | ESCC | 9.60e-04 | 2.38e-01 | 0.0875 |
| 23390 | ZDHHC17 | P2T-E | Human | Esophagus | ESCC | 1.50e-28 | 5.74e-01 | 0.1177 |
| 23390 | ZDHHC17 | P4T-E | Human | Esophagus | ESCC | 6.12e-13 | 2.34e-01 | 0.1323 |
| 23390 | ZDHHC17 | P5T-E | Human | Esophagus | ESCC | 1.89e-05 | 1.20e-01 | 0.1327 |
| 23390 | ZDHHC17 | P8T-E | Human | Esophagus | ESCC | 2.36e-12 | 2.52e-01 | 0.0889 |
| 23390 | ZDHHC17 | P9T-E | Human | Esophagus | ESCC | 3.36e-07 | 6.88e-02 | 0.1131 |
| 23390 | ZDHHC17 | P10T-E | Human | Esophagus | ESCC | 5.70e-15 | 2.47e-01 | 0.116 |
| 23390 | ZDHHC17 | P11T-E | Human | Esophagus | ESCC | 1.35e-08 | 2.83e-01 | 0.1426 |
| 23390 | ZDHHC17 | P12T-E | Human | Esophagus | ESCC | 3.47e-05 | 1.42e-01 | 0.1122 |
| 23390 | ZDHHC17 | P15T-E | Human | Esophagus | ESCC | 2.09e-11 | 2.08e-01 | 0.1149 |
| 23390 | ZDHHC17 | P16T-E | Human | Esophagus | ESCC | 3.93e-22 | 2.65e-01 | 0.1153 |
| 23390 | ZDHHC17 | P17T-E | Human | Esophagus | ESCC | 5.78e-05 | 1.35e-01 | 0.1278 |
| 23390 | ZDHHC17 | P20T-E | Human | Esophagus | ESCC | 3.17e-18 | 2.52e-01 | 0.1124 |
| 23390 | ZDHHC17 | P21T-E | Human | Esophagus | ESCC | 5.66e-14 | 1.91e-01 | 0.1617 |
| 23390 | ZDHHC17 | P22T-E | Human | Esophagus | ESCC | 5.17e-09 | 1.34e-01 | 0.1236 |
| 23390 | ZDHHC17 | P23T-E | Human | Esophagus | ESCC | 8.03e-09 | 1.75e-01 | 0.108 |
| 23390 | ZDHHC17 | P24T-E | Human | Esophagus | ESCC | 3.43e-05 | 9.03e-02 | 0.1287 |
| 23390 | ZDHHC17 | P26T-E | Human | Esophagus | ESCC | 1.01e-13 | 2.31e-01 | 0.1276 |
| Page: 1 2 3 4 |
| Tissue | Expression Dynamics | Abbreviation |
| Esophagus |  | ESCC: Esophageal squamous cell carcinoma |
| HGIN: High-grade intraepithelial neoplasias | ||
| LGIN: Low-grade intraepithelial neoplasias | ||
| Thyroid | 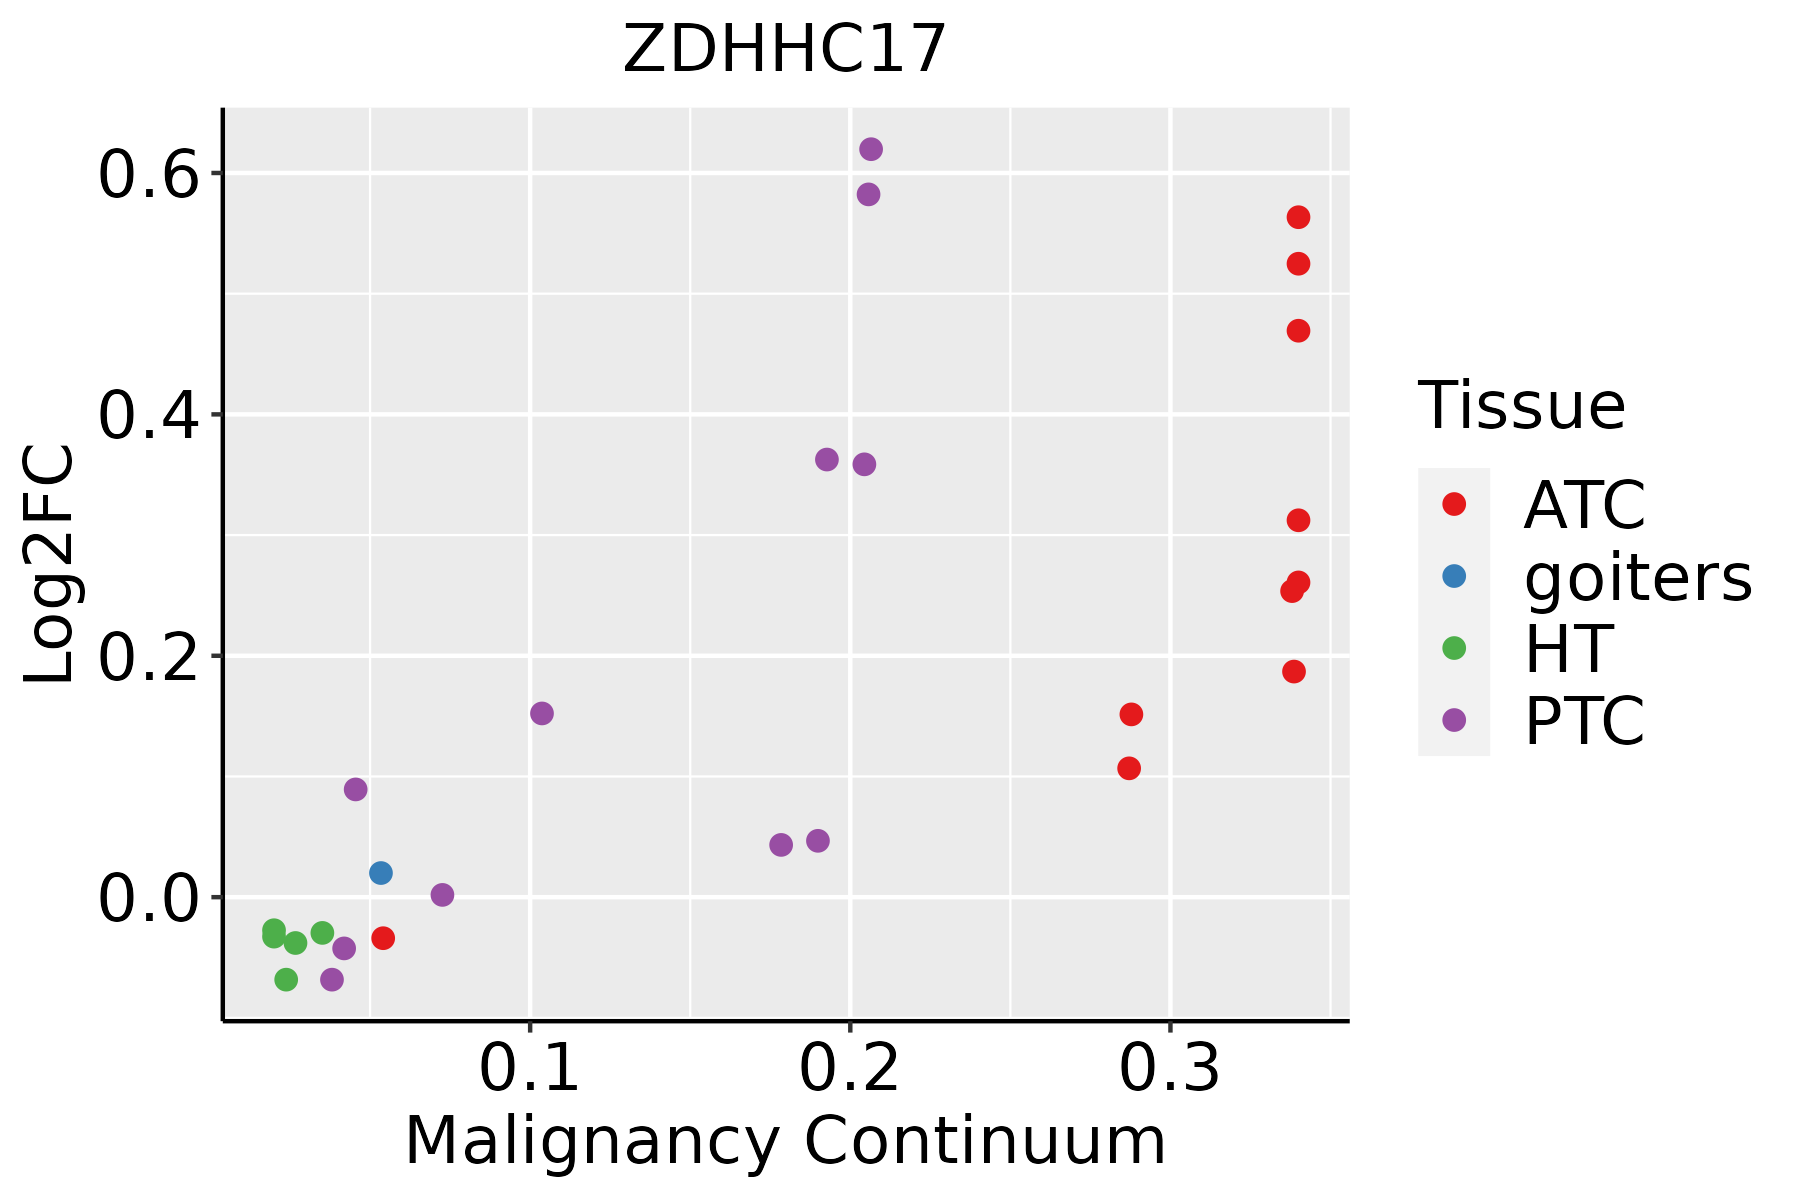 | ATC: Anaplastic thyroid cancer |
| HT: Hashimoto's thyroiditis | ||
| PTC: Papillary thyroid cancer |
| ∗log2FC in expression of this searched gene in stem-like cells from each diseased tissue sample relative to stem-like cells in normal samples in each tissue plotted against the malignancy continuum. Samples are colored based on if they are from different disease stage. |
Top |
Malignant transformation related pathway analysis |
| Find out the enriched GO biological processes and KEGG pathways involved in transition from healthy to precancer to cancer |
| Tissue | Disease Stage | Enriched GO biological Processes |
| Colorectum | AD |  |
| Colorectum | SER |  |
| Colorectum | MSS |  |
| Colorectum | MSI-H |  |
| Colorectum | FAP |  |
| ∗Top 15 enriched GO BP terms are showed in the bar plot of each disease state in each tissue. Each row represents a significant GO biological process which is colored according to the -log10(p.adjust). |
| Page: 1 2 3 4 5 6 7 8 9 |
| GO ID | Tissue | Disease Stage | Description | Gene Ratio | Bg Ratio | pvalue | p.adjust | Count |
| GO:004312220 | Esophagus | HGIN | regulation of I-kappaB kinase/NF-kappaB signaling | 63/2587 | 249/18723 | 8.91e-07 | 3.61e-05 | 63 |
| GO:000724918 | Esophagus | HGIN | I-kappaB kinase/NF-kappaB signaling | 67/2587 | 281/18723 | 3.84e-06 | 1.29e-04 | 67 |
| GO:004312317 | Esophagus | HGIN | positive regulation of I-kappaB kinase/NF-kappaB signaling | 49/2587 | 186/18723 | 4.22e-06 | 1.40e-04 | 49 |
| GO:00435435 | Esophagus | HGIN | protein acylation | 51/2587 | 243/18723 | 1.33e-03 | 1.57e-02 | 51 |
| GO:004354313 | Esophagus | ESCC | protein acylation | 165/8552 | 243/18723 | 1.69e-12 | 7.14e-11 | 165 |
| GO:004312318 | Esophagus | ESCC | positive regulation of I-kappaB kinase/NF-kappaB signaling | 132/8552 | 186/18723 | 2.07e-12 | 8.58e-11 | 132 |
| GO:0043122110 | Esophagus | ESCC | regulation of I-kappaB kinase/NF-kappaB signaling | 167/8552 | 249/18723 | 6.11e-12 | 2.32e-10 | 167 |
| GO:000724919 | Esophagus | ESCC | I-kappaB kinase/NF-kappaB signaling | 183/8552 | 281/18723 | 3.02e-11 | 1.01e-09 | 183 |
| GO:00421573 | Esophagus | ESCC | lipoprotein metabolic process | 86/8552 | 135/18723 | 1.78e-05 | 1.57e-04 | 86 |
| GO:00064973 | Esophagus | ESCC | protein lipidation | 62/8552 | 92/18723 | 2.08e-05 | 1.80e-04 | 62 |
| GO:00421583 | Esophagus | ESCC | lipoprotein biosynthetic process | 64/8552 | 96/18723 | 2.61e-05 | 2.20e-04 | 64 |
| GO:006156415 | Esophagus | ESCC | axon development | 251/8552 | 467/18723 | 2.41e-04 | 1.49e-03 | 251 |
| GO:000740915 | Esophagus | ESCC | axonogenesis | 219/8552 | 418/18723 | 3.14e-03 | 1.31e-02 | 219 |
| GO:0048011 | Esophagus | ESCC | neurotrophin TRK receptor signaling pathway | 17/8552 | 24/18723 | 1.13e-02 | 3.81e-02 | 17 |
| GO:00435437 | Thyroid | PTC | protein acylation | 134/5968 | 243/18723 | 4.22e-14 | 2.58e-12 | 134 |
| GO:004312226 | Thyroid | PTC | regulation of I-kappaB kinase/NF-kappaB signaling | 118/5968 | 249/18723 | 2.04e-07 | 3.63e-06 | 118 |
| GO:000724926 | Thyroid | PTC | I-kappaB kinase/NF-kappaB signaling | 130/5968 | 281/18723 | 2.78e-07 | 4.80e-06 | 130 |
| GO:006156419 | Thyroid | PTC | axon development | 199/5968 | 467/18723 | 5.27e-07 | 8.53e-06 | 199 |
| GO:004312320 | Thyroid | PTC | positive regulation of I-kappaB kinase/NF-kappaB signaling | 91/5968 | 186/18723 | 8.76e-07 | 1.33e-05 | 91 |
| GO:000740918 | Thyroid | PTC | axonogenesis | 178/5968 | 418/18723 | 2.17e-06 | 2.91e-05 | 178 |
| Page: 1 2 |
| Pathway ID | Tissue | Disease Stage | Description | Gene Ratio | Bg Ratio | pvalue | p.adjust | qvalue | Count |
| Page: 1 |
Top |
Cell-cell communication analysis |
| Identification of potential cell-cell interactions between two cell types and their ligand-receptor pairs for different disease states |
| Ligand | Receptor | LRpair | Pathway | Tissue | Disease Stage |
| Page: 1 |
Top |
Single-cell gene regulatory network inference analysis |
| Find out the significant the regulons (TFs) and the target genes of each regulon across cell types for different disease states |
| TF | Cell Type | Tissue | Disease Stage | Target Gene | RSS | Regulon Activity |
| ∗The dot plots of a searched regulon are shown for all cell subpopulations in each disease state of each tissue based on the regulon specific score inferred using pySCENIC and by calculating the average expression. |
| Page: 1 |
Top |
Somatic mutation of malignant transformation related genes |
| Annotation of somatic variants for genes involved in malignant transformation |
| Hugo Symbol | Variant Class | Variant Classification | dbSNP RS | HGVSc | HGVSp | HGVSp Short | SWISSPROT | BIOTYPE | SIFT | PolyPhen | Tumor Sample Barcode | Tissue | Histology | Sex | Age | Stage | Therapy Types | Drugs | Outcome |
| ZDHHC17 | SNV | Missense_Mutation | c.1304N>A | p.Leu435His | p.L435H | Q8IUH5 | protein_coding | tolerated(0.54) | probably_damaging(0.935) | TCGA-A1-A0SO-01 | Breast | breast invasive carcinoma | Female | >=65 | I/II | Chemotherapy | SD | ||
| ZDHHC17 | SNV | Missense_Mutation | c.1590G>T | p.Trp530Cys | p.W530C | Q8IUH5 | protein_coding | deleterious(0) | probably_damaging(0.998) | TCGA-A2-A0T1-01 | Breast | breast invasive carcinoma | Female | <65 | III/IV | Targeted Molecular therapy | herceptin | SD | |
| ZDHHC17 | SNV | Missense_Mutation | c.1758N>G | p.Phe586Leu | p.F586L | Q8IUH5 | protein_coding | deleterious(0) | possibly_damaging(0.783) | TCGA-A2-A0YK-01 | Breast | breast invasive carcinoma | Female | <65 | I/II | Chemotherapy | cytoxan | SD | |
| ZDHHC17 | SNV | Missense_Mutation | c.1786G>C | p.Asp596His | p.D596H | Q8IUH5 | protein_coding | deleterious(0) | probably_damaging(0.979) | TCGA-AO-A0JC-01 | Breast | breast invasive carcinoma | Female | <65 | I/II | Chemotherapy | fluorouracil | SD | |
| ZDHHC17 | SNV | Missense_Mutation | c.1390G>C | p.Asp464His | p.D464H | Q8IUH5 | protein_coding | deleterious(0) | probably_damaging(0.972) | TCGA-E2-A1B1-01 | Breast | breast invasive carcinoma | Female | <65 | I/II | Other, specify in notesbiphosphonate | zoledronic | SD | |
| ZDHHC17 | SNV | Missense_Mutation | c.145N>G | p.Arg49Gly | p.R49G | Q8IUH5 | protein_coding | tolerated(0.05) | benign(0.023) | TCGA-E2-A1LH-01 | Breast | breast invasive carcinoma | Female | <65 | I/II | Chemotherapy | adriamycin | SD | |
| ZDHHC17 | SNV | Missense_Mutation | c.1156T>G | p.Phe386Val | p.F386V | Q8IUH5 | protein_coding | tolerated(0.5) | benign(0.003) | TCGA-FU-A3HZ-01 | Cervix | cervical & endocervical cancer | Female | <65 | I/II | Chemotherapy | cisplatin | CR | |
| ZDHHC17 | SNV | Missense_Mutation | novel | c.1748N>G | p.Glu583Gly | p.E583G | Q8IUH5 | protein_coding | tolerated(0.08) | benign(0.25) | TCGA-ZJ-AAXB-01 | Cervix | cervical & endocervical cancer | Female | <65 | I/II | Unknown | Unknown | SD |
| ZDHHC17 | SNV | Missense_Mutation | c.248T>C | p.Val83Ala | p.V83A | Q8IUH5 | protein_coding | deleterious(0) | probably_damaging(0.932) | TCGA-AA-3672-01 | Colorectum | colon adenocarcinoma | Female | >=65 | III/IV | Unknown | Unknown | SD | |
| ZDHHC17 | SNV | Missense_Mutation | c.1340N>T | p.Pro447Leu | p.P447L | Q8IUH5 | protein_coding | deleterious(0) | probably_damaging(0.977) | TCGA-AA-3811-01 | Colorectum | colon adenocarcinoma | Female | >=65 | III/IV | Unknown | Unknown | PD |
| Page: 1 2 3 4 5 6 7 |
Top |
Related drugs of malignant transformation related genes |
| Identification of chemicals and drugs interact with genes involved in malignant transfromation |
| (DGIdb 4.0) |
| Entrez ID | Symbol | Category | Interaction Types | Drug Claim Name | Drug Name | PMIDs |
| Page: 1 |

Copyright 2023-Present -The University of Texas Health Science Center at Houston |