
|
|||||
|
 | |
| |
| |
| |
| |
| |
|
Gene: ZDHHC16 |
Gene summary for ZDHHC16 |
| Gene information | Species | Human | Gene symbol | ZDHHC16 | Gene ID | 84287 |
| Gene name | zinc finger DHHC-type palmitoyltransferase 16 | |
| Gene Alias | APH2 | |
| Cytomap | 10q24.1 | |
| Gene Type | protein-coding | GO ID | GO:0001654 | UniProtAcc | B4DNL2 |
Top |
Malignant transformation analysis |
| Identification of the aberrant gene expression in precancerous and cancerous lesions by comparing the gene expression of stem-like cells in diseased tissues with normal stem cells |
| Entrez ID | Symbol | Replicates | Species | Organ | Tissue | Adj P-value | Log2FC | Malignancy |
| 84287 | ZDHHC16 | LZE4T | Human | Esophagus | ESCC | 8.75e-03 | 1.86e-01 | 0.0811 |
| 84287 | ZDHHC16 | LZE7T | Human | Esophagus | ESCC | 1.43e-03 | 1.59e-01 | 0.0667 |
| 84287 | ZDHHC16 | LZE22T | Human | Esophagus | ESCC | 1.02e-04 | 2.99e-01 | 0.068 |
| 84287 | ZDHHC16 | LZE24T | Human | Esophagus | ESCC | 7.84e-23 | 6.42e-01 | 0.0596 |
| 84287 | ZDHHC16 | P1T-E | Human | Esophagus | ESCC | 5.15e-06 | 3.11e-01 | 0.0875 |
| 84287 | ZDHHC16 | P2T-E | Human | Esophagus | ESCC | 8.89e-22 | 4.09e-01 | 0.1177 |
| 84287 | ZDHHC16 | P4T-E | Human | Esophagus | ESCC | 3.33e-26 | 6.45e-01 | 0.1323 |
| 84287 | ZDHHC16 | P5T-E | Human | Esophagus | ESCC | 1.01e-07 | 1.73e-01 | 0.1327 |
| 84287 | ZDHHC16 | P8T-E | Human | Esophagus | ESCC | 1.08e-17 | 3.81e-01 | 0.0889 |
| 84287 | ZDHHC16 | P9T-E | Human | Esophagus | ESCC | 6.16e-16 | 2.96e-01 | 0.1131 |
| 84287 | ZDHHC16 | P10T-E | Human | Esophagus | ESCC | 7.31e-10 | 1.96e-01 | 0.116 |
| 84287 | ZDHHC16 | P11T-E | Human | Esophagus | ESCC | 4.19e-17 | 5.71e-01 | 0.1426 |
| 84287 | ZDHHC16 | P12T-E | Human | Esophagus | ESCC | 2.15e-19 | 4.58e-01 | 0.1122 |
| 84287 | ZDHHC16 | P15T-E | Human | Esophagus | ESCC | 1.31e-22 | 4.89e-01 | 0.1149 |
| 84287 | ZDHHC16 | P16T-E | Human | Esophagus | ESCC | 5.56e-17 | 3.24e-01 | 0.1153 |
| 84287 | ZDHHC16 | P17T-E | Human | Esophagus | ESCC | 5.57e-07 | 3.78e-01 | 0.1278 |
| 84287 | ZDHHC16 | P19T-E | Human | Esophagus | ESCC | 3.45e-14 | 7.98e-01 | 0.1662 |
| 84287 | ZDHHC16 | P20T-E | Human | Esophagus | ESCC | 6.39e-20 | 4.11e-01 | 0.1124 |
| 84287 | ZDHHC16 | P21T-E | Human | Esophagus | ESCC | 1.00e-29 | 5.62e-01 | 0.1617 |
| 84287 | ZDHHC16 | P22T-E | Human | Esophagus | ESCC | 1.45e-24 | 4.25e-01 | 0.1236 |
| Page: 1 2 3 4 5 |
| Tissue | Expression Dynamics | Abbreviation |
| Esophagus |  | ESCC: Esophageal squamous cell carcinoma |
| HGIN: High-grade intraepithelial neoplasias | ||
| LGIN: Low-grade intraepithelial neoplasias | ||
| Liver | 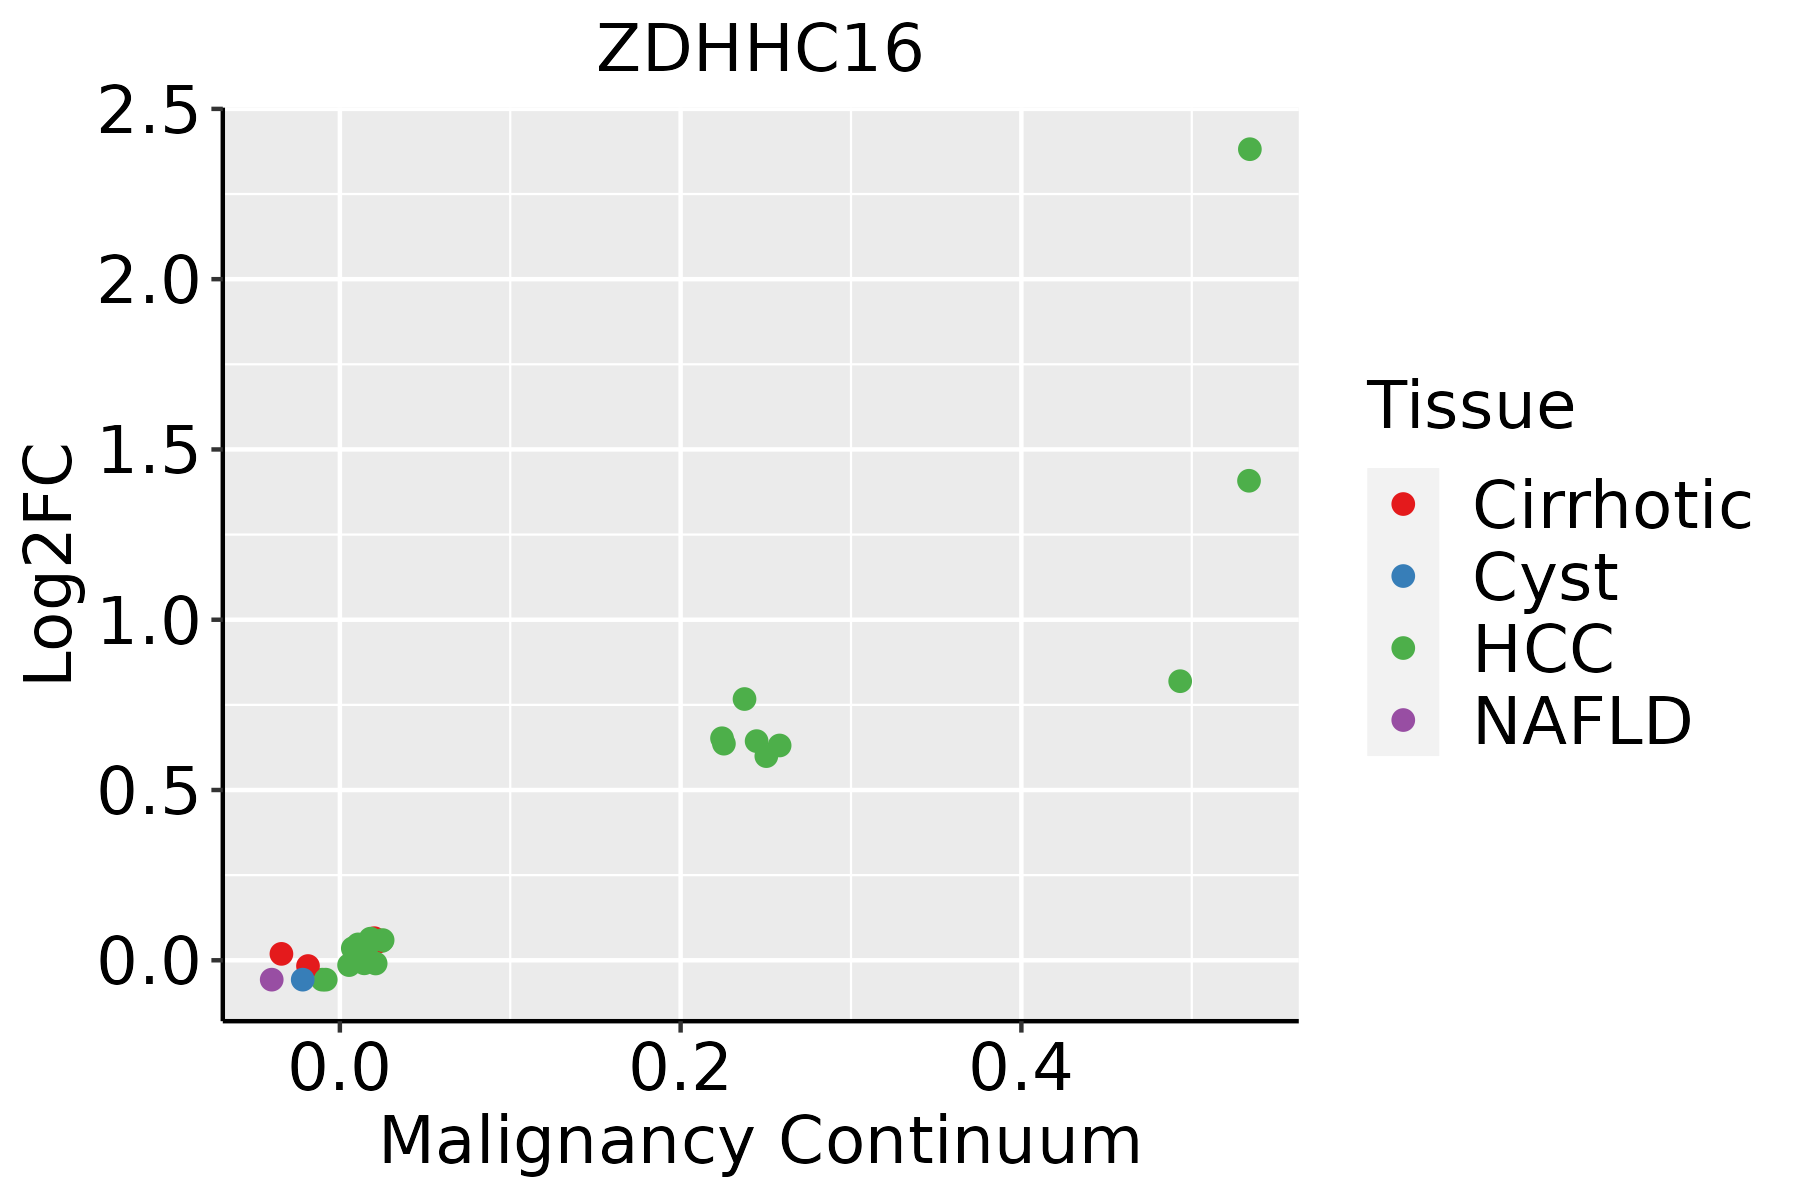 | HCC: Hepatocellular carcinoma |
| NAFLD: Non-alcoholic fatty liver disease | ||
| Oral Cavity | 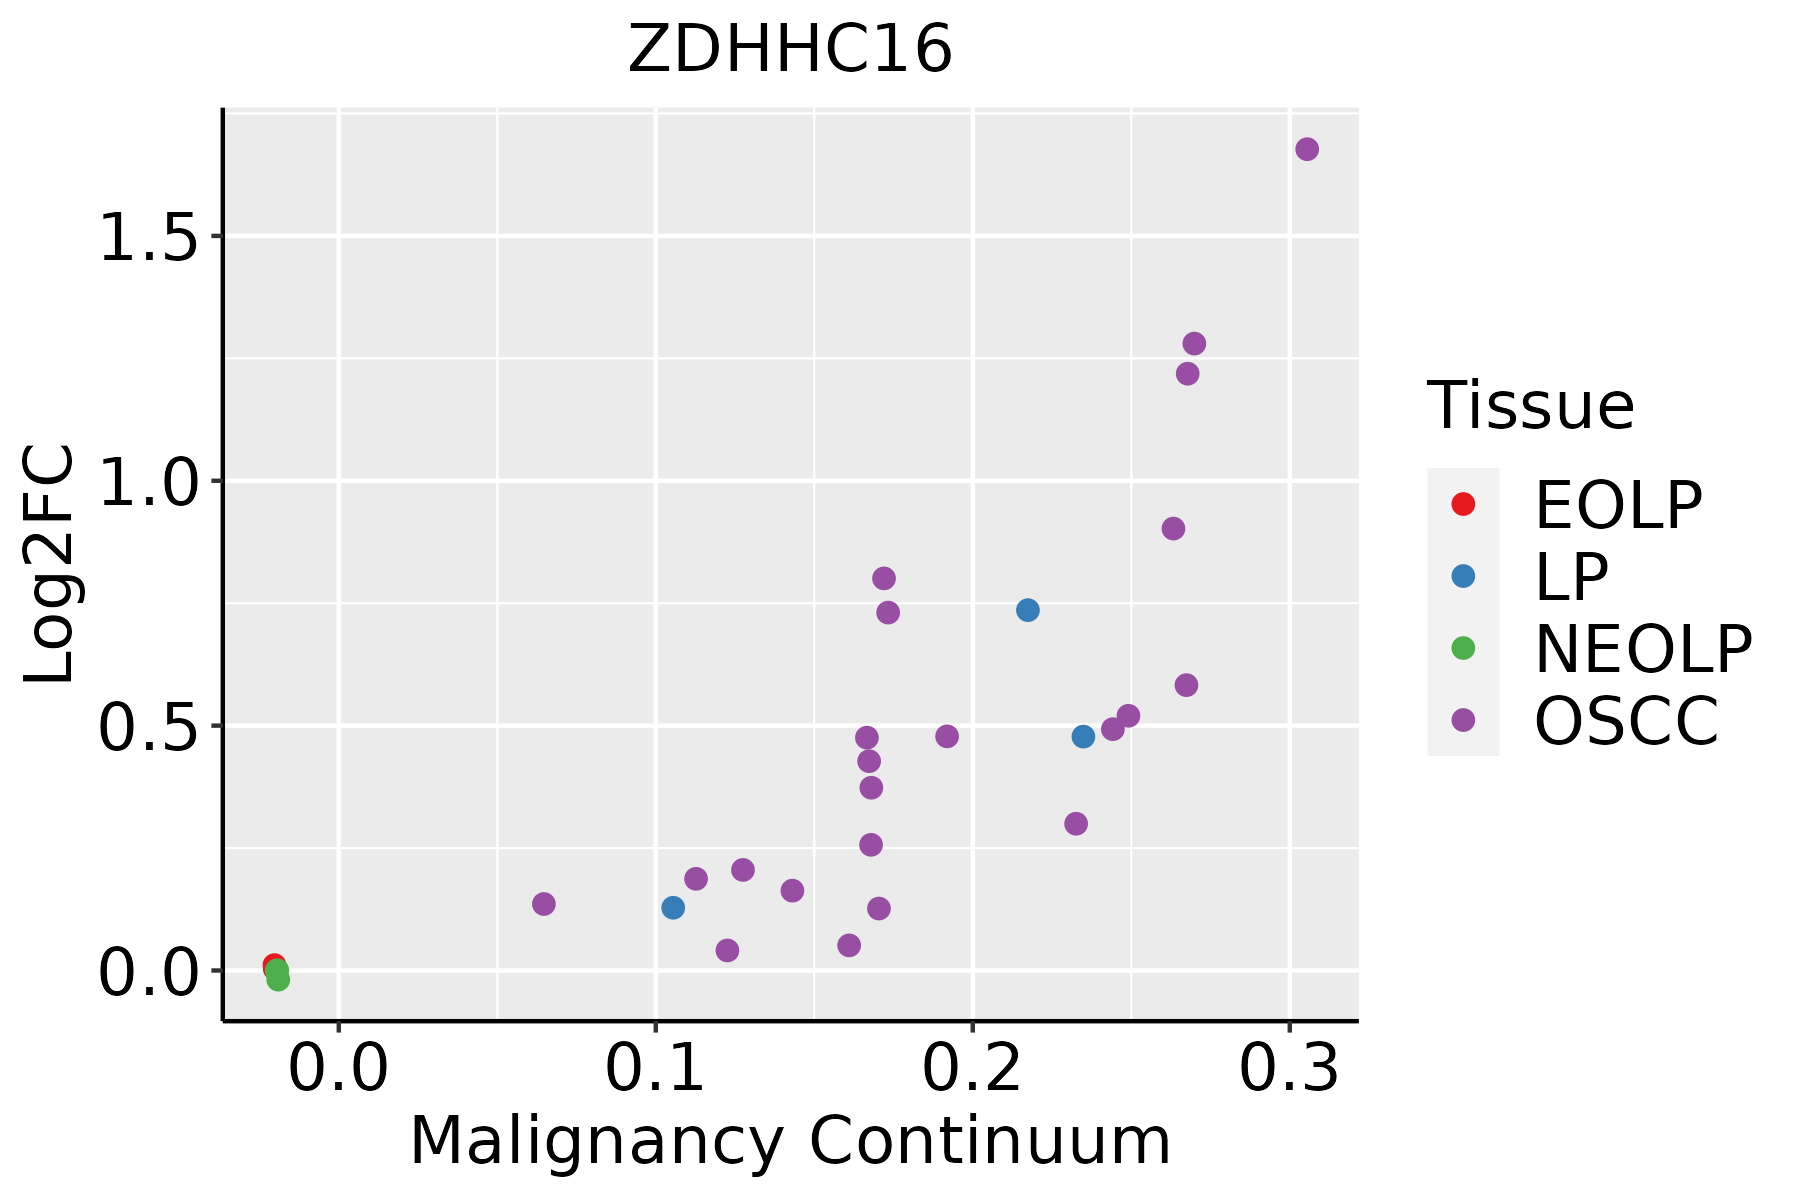 | EOLP: Erosive Oral lichen planus |
| LP: leukoplakia | ||
| NEOLP: Non-erosive oral lichen planus | ||
| OSCC: Oral squamous cell carcinoma | ||
| Skin | 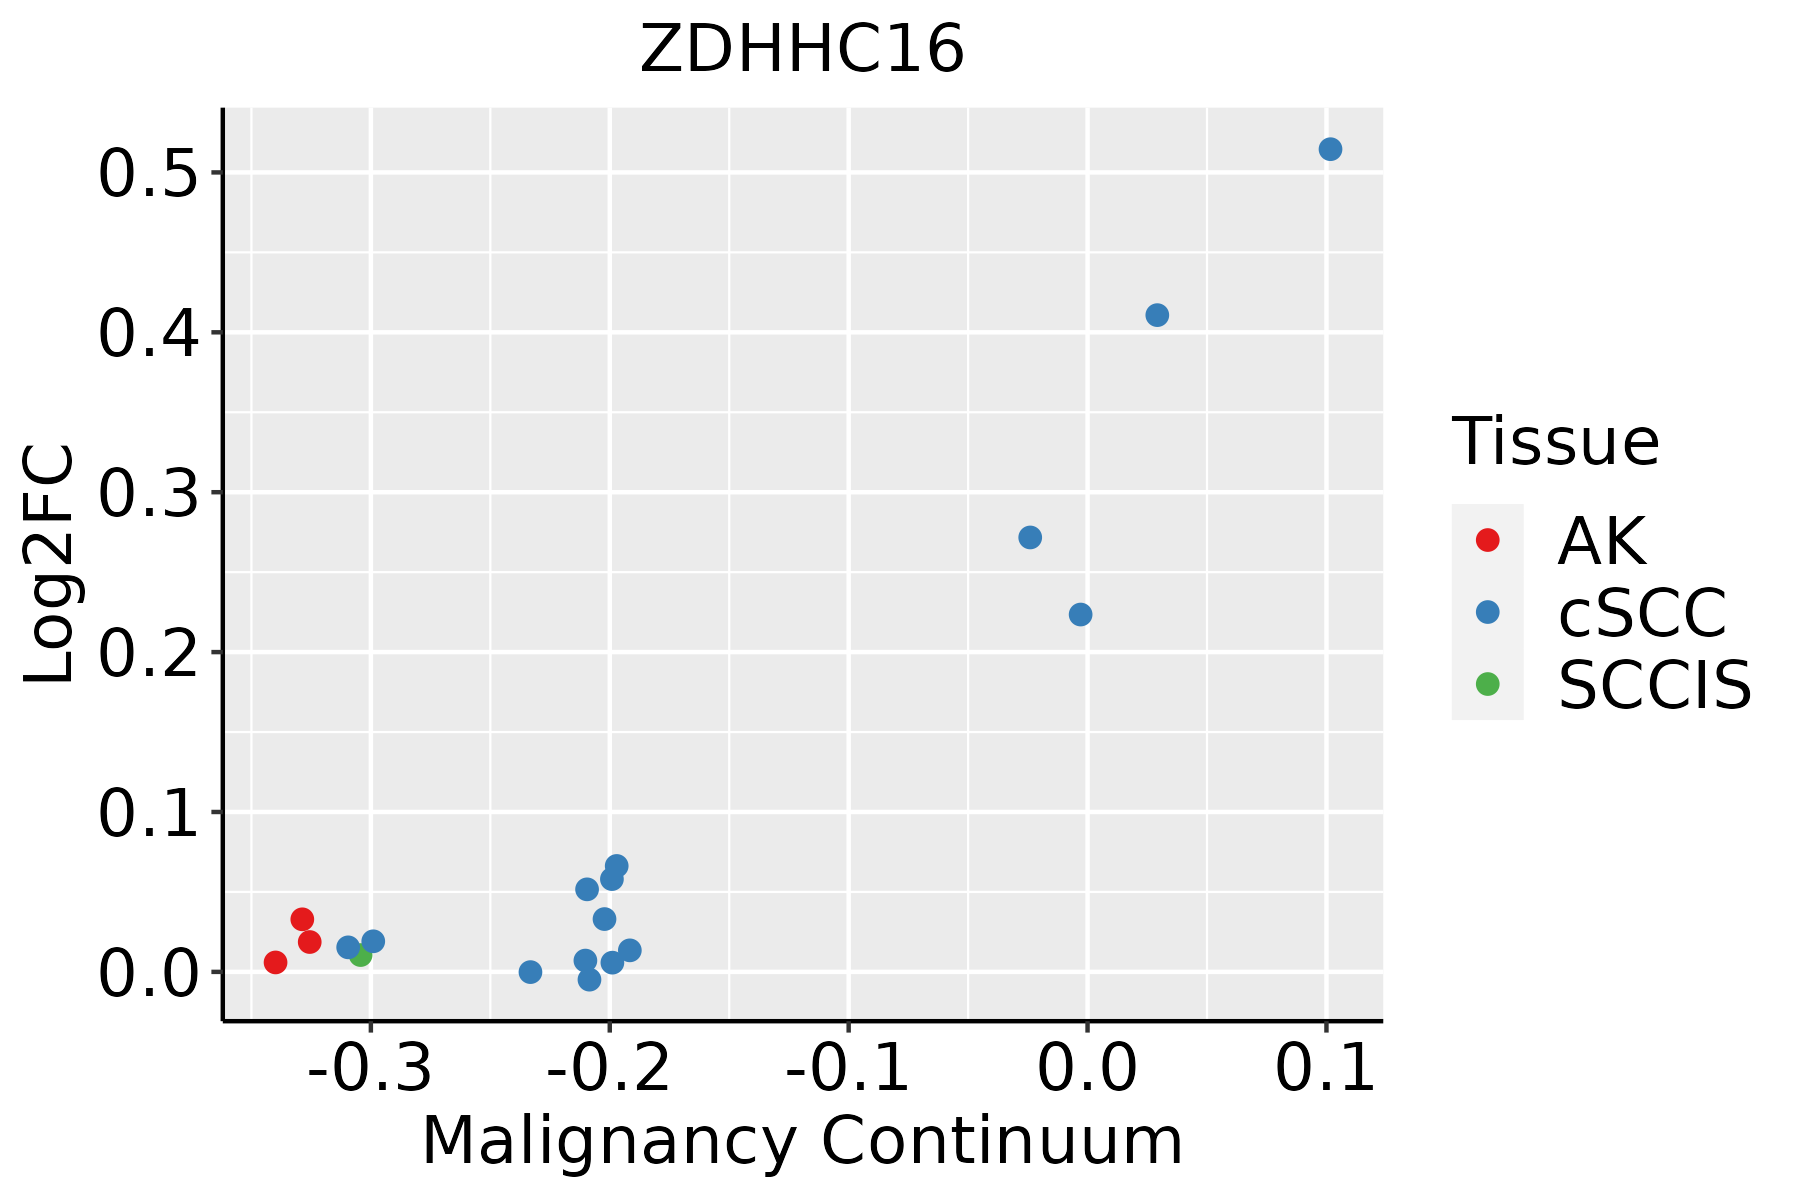 | AK: Actinic keratosis |
| cSCC: Cutaneous squamous cell carcinoma | ||
| SCCIS:squamous cell carcinoma in situ |
| ∗log2FC in expression of this searched gene in stem-like cells from each diseased tissue sample relative to stem-like cells in normal samples in each tissue plotted against the malignancy continuum. Samples are colored based on if they are from different disease stage. |
Top |
Malignant transformation related pathway analysis |
| Find out the enriched GO biological processes and KEGG pathways involved in transition from healthy to precancer to cancer |
| Tissue | Disease Stage | Enriched GO biological Processes |
| Colorectum | AD |  |
| Colorectum | SER |  |
| Colorectum | MSS |  |
| Colorectum | MSI-H |  |
| Colorectum | FAP |  |
| ∗Top 15 enriched GO BP terms are showed in the bar plot of each disease state in each tissue. Each row represents a significant GO biological process which is colored according to the -log10(p.adjust). |
| Page: 1 2 3 4 5 6 7 8 9 |
| GO ID | Tissue | Disease Stage | Description | Gene Ratio | Bg Ratio | pvalue | p.adjust | Count |
| GO:004354313 | Esophagus | ESCC | protein acylation | 165/8552 | 243/18723 | 1.69e-12 | 7.14e-11 | 165 |
| GO:00421573 | Esophagus | ESCC | lipoprotein metabolic process | 86/8552 | 135/18723 | 1.78e-05 | 1.57e-04 | 86 |
| GO:00064973 | Esophagus | ESCC | protein lipidation | 62/8552 | 92/18723 | 2.08e-05 | 1.80e-04 | 62 |
| GO:00421583 | Esophagus | ESCC | lipoprotein biosynthetic process | 64/8552 | 96/18723 | 2.61e-05 | 2.20e-04 | 64 |
| GO:00435432 | Liver | HCC | protein acylation | 157/7958 | 243/18723 | 2.40e-12 | 1.12e-10 | 157 |
| GO:00421571 | Liver | HCC | lipoprotein metabolic process | 86/7958 | 135/18723 | 5.21e-07 | 8.38e-06 | 86 |
| GO:00421581 | Liver | HCC | lipoprotein biosynthetic process | 58/7958 | 96/18723 | 2.99e-04 | 2.13e-03 | 58 |
| GO:00064971 | Liver | HCC | protein lipidation | 55/7958 | 92/18723 | 6.12e-04 | 3.82e-03 | 55 |
| GO:00435434 | Oral cavity | OSCC | protein acylation | 149/7305 | 243/18723 | 1.33e-12 | 5.80e-11 | 149 |
| GO:00421572 | Oral cavity | OSCC | lipoprotein metabolic process | 77/7305 | 135/18723 | 1.61e-05 | 1.60e-04 | 77 |
| GO:00064972 | Oral cavity | OSCC | protein lipidation | 56/7305 | 92/18723 | 1.77e-05 | 1.72e-04 | 56 |
| GO:00421582 | Oral cavity | OSCC | lipoprotein biosynthetic process | 57/7305 | 96/18723 | 4.17e-05 | 3.61e-04 | 57 |
| GO:004354312 | Oral cavity | LP | protein acylation | 93/4623 | 243/18723 | 1.65e-06 | 3.86e-05 | 93 |
| GO:004215711 | Oral cavity | LP | lipoprotein metabolic process | 57/4623 | 135/18723 | 5.59e-06 | 1.11e-04 | 57 |
| GO:000649711 | Oral cavity | LP | protein lipidation | 40/4623 | 92/18723 | 6.04e-05 | 8.20e-04 | 40 |
| GO:004215811 | Oral cavity | LP | lipoprotein biosynthetic process | 41/4623 | 96/18723 | 8.04e-05 | 1.04e-03 | 41 |
| GO:004354314 | Skin | cSCC | protein acylation | 95/4864 | 243/18723 | 4.56e-06 | 6.71e-05 | 95 |
| Page: 1 |
| Pathway ID | Tissue | Disease Stage | Description | Gene Ratio | Bg Ratio | pvalue | p.adjust | qvalue | Count |
| Page: 1 |
Top |
Cell-cell communication analysis |
| Identification of potential cell-cell interactions between two cell types and their ligand-receptor pairs for different disease states |
| Ligand | Receptor | LRpair | Pathway | Tissue | Disease Stage |
| Page: 1 |
Top |
Single-cell gene regulatory network inference analysis |
| Find out the significant the regulons (TFs) and the target genes of each regulon across cell types for different disease states |
| TF | Cell Type | Tissue | Disease Stage | Target Gene | RSS | Regulon Activity |
| ∗The dot plots of a searched regulon are shown for all cell subpopulations in each disease state of each tissue based on the regulon specific score inferred using pySCENIC and by calculating the average expression. |
| Page: 1 |
Top |
Somatic mutation of malignant transformation related genes |
| Annotation of somatic variants for genes involved in malignant transformation |
| Hugo Symbol | Variant Class | Variant Classification | dbSNP RS | HGVSc | HGVSp | HGVSp Short | SWISSPROT | BIOTYPE | SIFT | PolyPhen | Tumor Sample Barcode | Tissue | Histology | Sex | Age | Stage | Therapy Types | Drugs | Outcome |
| ZDHHC16 | SNV | Missense_Mutation | c.683C>T | p.Ala228Val | p.A228V | Q969W1 | protein_coding | deleterious(0.04) | benign(0.038) | TCGA-2W-A8YY-01 | Cervix | cervical & endocervical cancer | Female | <65 | I/II | Chemotherapy | cisplatin | CR | |
| ZDHHC16 | SNV | Missense_Mutation | rs373981468 | c.119N>A | p.Arg40His | p.R40H | Q969W1 | protein_coding | tolerated(0.42) | benign(0.003) | TCGA-5M-AAT6-01 | Colorectum | colon adenocarcinoma | Female | <65 | III/IV | Unknown | Unknown | PD |
| ZDHHC16 | SNV | Missense_Mutation | rs756707854 | c.967N>G | p.Asn323Asp | p.N323D | Q969W1 | protein_coding | tolerated(0.21) | benign(0.009) | TCGA-AA-3866-01 | Colorectum | colon adenocarcinoma | Female | >=65 | I/II | Unknown | Unknown | SD |
| ZDHHC16 | SNV | Missense_Mutation | rs753022921 | c.1033N>T | p.Arg345Trp | p.R345W | Q969W1 | protein_coding | deleterious(0) | benign(0.015) | TCGA-AA-A01R-01 | Colorectum | colon adenocarcinoma | Male | <65 | III/IV | Chemotherapy | 5-fluorouracil | PD |
| ZDHHC16 | SNV | Missense_Mutation | c.898G>A | p.Glu300Lys | p.E300K | Q969W1 | protein_coding | deleterious(0) | probably_damaging(1) | TCGA-AZ-4315-01 | Colorectum | colon adenocarcinoma | Male | <65 | I/II | Unknown | Unknown | SD | |
| ZDHHC16 | SNV | Missense_Mutation | c.269N>C | p.Leu90Pro | p.L90P | Q969W1 | protein_coding | deleterious(0) | probably_damaging(0.998) | TCGA-D5-6927-01 | Colorectum | colon adenocarcinoma | Male | <65 | I/II | Unknown | Unknown | SD | |
| ZDHHC16 | SNV | Missense_Mutation | novel | c.650N>T | p.Gly217Val | p.G217V | Q969W1 | protein_coding | tolerated(0.07) | benign(0.062) | TCGA-EI-6917-01 | Colorectum | rectum adenocarcinoma | Male | <65 | III/IV | Chemotherapy | 5fluorouracil+oxaciplatina+l-folinian | SD |
| ZDHHC16 | SNV | Missense_Mutation | novel | c.661N>A | p.Leu221Ile | p.L221I | Q969W1 | protein_coding | tolerated(0.12) | benign(0.062) | TCGA-A5-A1OF-01 | Endometrium | uterine corpus endometrioid carcinoma | Female | <65 | I/II | Unknown | Unknown | SD |
| ZDHHC16 | SNV | Missense_Mutation | novel | c.860N>T | p.Trp287Leu | p.W287L | Q969W1 | protein_coding | deleterious(0) | benign(0.191) | TCGA-A5-A1OF-01 | Endometrium | uterine corpus endometrioid carcinoma | Female | <65 | I/II | Unknown | Unknown | SD |
| ZDHHC16 | SNV | Missense_Mutation | novel | c.1070N>G | p.Asn357Ser | p.N357S | Q969W1 | protein_coding | tolerated(0.05) | benign(0.137) | TCGA-A5-A1OF-01 | Endometrium | uterine corpus endometrioid carcinoma | Female | <65 | I/II | Unknown | Unknown | SD |
| Page: 1 2 3 4 |
Top |
Related drugs of malignant transformation related genes |
| Identification of chemicals and drugs interact with genes involved in malignant transfromation |
| (DGIdb 4.0) |
| Entrez ID | Symbol | Category | Interaction Types | Drug Claim Name | Drug Name | PMIDs |
| Page: 1 |

Copyright 2023-Present -The University of Texas Health Science Center at Houston |