
|
|||||
|
 | |
| |
| |
| |
| |
| |
|
Gene: ZDHHC13 |
Gene summary for ZDHHC13 |
| Gene information | Species | Human | Gene symbol | ZDHHC13 | Gene ID | 54503 |
| Gene name | zinc finger DHHC-type palmitoyltransferase 13 | |
| Gene Alias | HIP14L | |
| Cytomap | 11p15.1 | |
| Gene Type | protein-coding | GO ID | GO:0006464 | UniProtAcc | Q8IUH4 |
Top |
Malignant transformation analysis |
| Identification of the aberrant gene expression in precancerous and cancerous lesions by comparing the gene expression of stem-like cells in diseased tissues with normal stem cells |
| Entrez ID | Symbol | Replicates | Species | Organ | Tissue | Adj P-value | Log2FC | Malignancy |
| 54503 | ZDHHC13 | HTA11_3410_2000001011 | Human | Colorectum | AD | 5.02e-13 | -5.31e-01 | 0.0155 |
| 54503 | ZDHHC13 | HTA11_2487_2000001011 | Human | Colorectum | SER | 2.45e-06 | -5.15e-01 | -0.1808 |
| 54503 | ZDHHC13 | HTA11_3361_2000001011 | Human | Colorectum | AD | 1.61e-02 | -4.67e-01 | -0.1207 |
| 54503 | ZDHHC13 | HTA11_696_2000001011 | Human | Colorectum | AD | 1.44e-03 | -3.62e-01 | -0.1464 |
| 54503 | ZDHHC13 | HTA11_866_3004761011 | Human | Colorectum | AD | 6.81e-07 | -4.65e-01 | 0.096 |
| 54503 | ZDHHC13 | HTA11_7696_3000711011 | Human | Colorectum | AD | 8.05e-06 | -4.07e-01 | 0.0674 |
| 54503 | ZDHHC13 | HTA11_99999970781_79442 | Human | Colorectum | MSS | 1.09e-03 | -3.85e-01 | 0.294 |
| 54503 | ZDHHC13 | HTA11_99999971662_82457 | Human | Colorectum | MSS | 5.48e-05 | -3.79e-01 | 0.3859 |
| 54503 | ZDHHC13 | HTA11_99999974143_84620 | Human | Colorectum | MSS | 4.13e-15 | -4.92e-01 | 0.3005 |
| 54503 | ZDHHC13 | F007 | Human | Colorectum | FAP | 5.46e-03 | -2.65e-01 | 0.1176 |
| 54503 | ZDHHC13 | A001-C-207 | Human | Colorectum | FAP | 2.52e-03 | -2.92e-01 | 0.1278 |
| 54503 | ZDHHC13 | A015-C-203 | Human | Colorectum | FAP | 5.61e-16 | -2.91e-01 | -0.1294 |
| 54503 | ZDHHC13 | A015-C-204 | Human | Colorectum | FAP | 1.22e-02 | -1.84e-01 | -0.0228 |
| 54503 | ZDHHC13 | A002-C-201 | Human | Colorectum | FAP | 6.47e-09 | -2.53e-01 | 0.0324 |
| 54503 | ZDHHC13 | A002-C-203 | Human | Colorectum | FAP | 2.34e-04 | -2.17e-01 | 0.2786 |
| 54503 | ZDHHC13 | A001-C-119 | Human | Colorectum | FAP | 3.11e-02 | -5.98e-03 | -0.1557 |
| 54503 | ZDHHC13 | A001-C-108 | Human | Colorectum | FAP | 2.52e-10 | -1.21e-01 | -0.0272 |
| 54503 | ZDHHC13 | A002-C-205 | Human | Colorectum | FAP | 8.79e-15 | -2.87e-01 | -0.1236 |
| 54503 | ZDHHC13 | A015-C-006 | Human | Colorectum | FAP | 5.87e-10 | -4.03e-01 | -0.0994 |
| 54503 | ZDHHC13 | A015-C-106 | Human | Colorectum | FAP | 5.86e-07 | -2.79e-01 | -0.0511 |
| Page: 1 2 3 4 5 6 |
| Tissue | Expression Dynamics | Abbreviation |
| Colorectum (GSE201348) |  | FAP: Familial adenomatous polyposis |
| CRC: Colorectal cancer | ||
| Colorectum (HTA11) |  | AD: Adenomas |
| SER: Sessile serrated lesions | ||
| MSI-H: Microsatellite-high colorectal cancer | ||
| MSS: Microsatellite stable colorectal cancer | ||
| Esophagus | 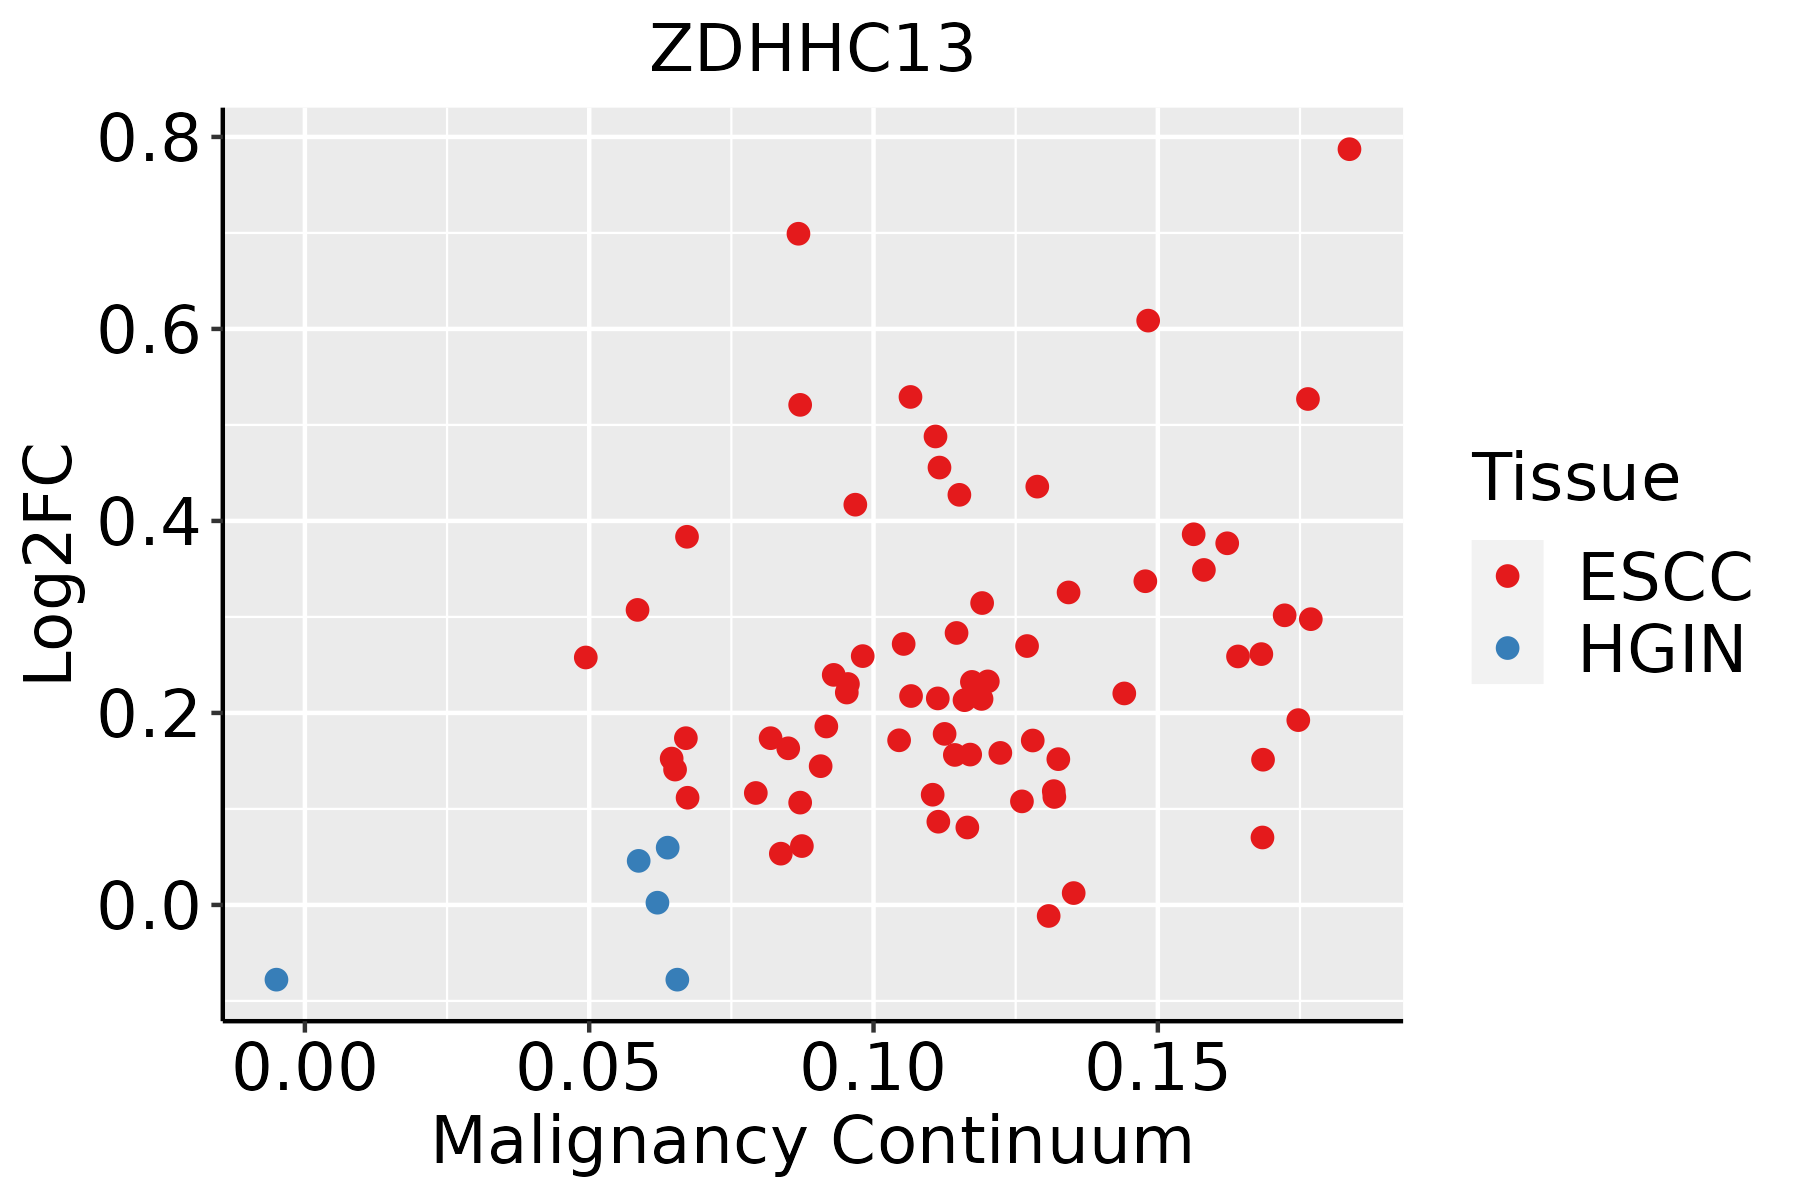 | ESCC: Esophageal squamous cell carcinoma |
| HGIN: High-grade intraepithelial neoplasias | ||
| LGIN: Low-grade intraepithelial neoplasias | ||
| Oral Cavity | 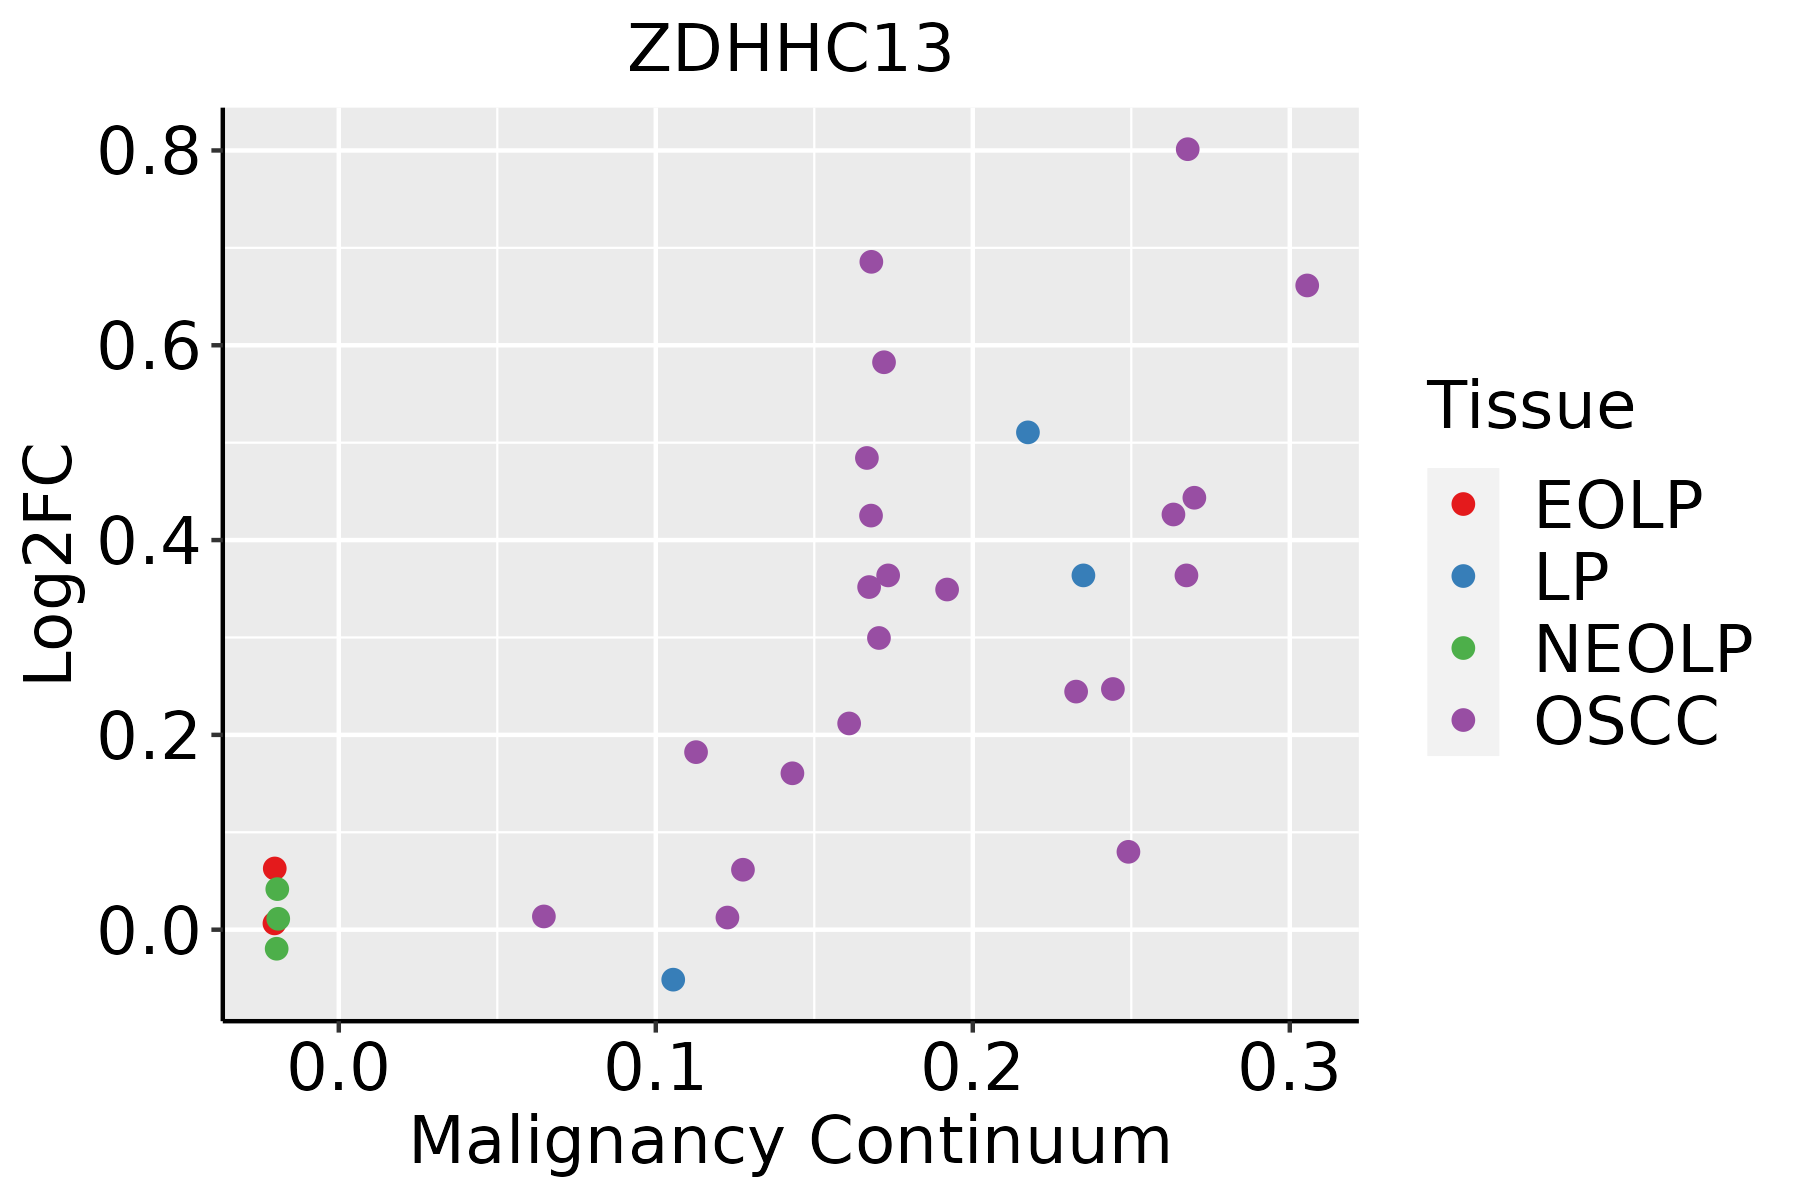 | EOLP: Erosive Oral lichen planus |
| LP: leukoplakia | ||
| NEOLP: Non-erosive oral lichen planus | ||
| OSCC: Oral squamous cell carcinoma |
| ∗log2FC in expression of this searched gene in stem-like cells from each diseased tissue sample relative to stem-like cells in normal samples in each tissue plotted against the malignancy continuum. Samples are colored based on if they are from different disease stage. |
Top |
Malignant transformation related pathway analysis |
| Find out the enriched GO biological processes and KEGG pathways involved in transition from healthy to precancer to cancer |
| Tissue | Disease Stage | Enriched GO biological Processes |
| Colorectum | AD |  |
| Colorectum | SER |  |
| Colorectum | MSS |  |
| Colorectum | MSI-H |  |
| Colorectum | FAP |  |
| ∗Top 15 enriched GO BP terms are showed in the bar plot of each disease state in each tissue. Each row represents a significant GO biological process which is colored according to the -log10(p.adjust). |
| Page: 1 2 3 4 5 6 7 8 9 |
| GO ID | Tissue | Disease Stage | Description | Gene Ratio | Bg Ratio | pvalue | p.adjust | Count |
| GO:0043123 | Colorectum | AD | positive regulation of I-kappaB kinase/NF-kappaB signaling | 60/3918 | 186/18723 | 1.91e-04 | 2.56e-03 | 60 |
| GO:0043122 | Colorectum | AD | regulation of I-kappaB kinase/NF-kappaB signaling | 76/3918 | 249/18723 | 2.17e-04 | 2.85e-03 | 76 |
| GO:0007249 | Colorectum | AD | I-kappaB kinase/NF-kappaB signaling | 82/3918 | 281/18723 | 6.09e-04 | 6.40e-03 | 82 |
| GO:00431221 | Colorectum | MSS | regulation of I-kappaB kinase/NF-kappaB signaling | 71/3467 | 249/18723 | 7.12e-05 | 1.21e-03 | 71 |
| GO:00072491 | Colorectum | MSS | I-kappaB kinase/NF-kappaB signaling | 77/3467 | 281/18723 | 1.51e-04 | 2.19e-03 | 77 |
| GO:00431231 | Colorectum | MSS | positive regulation of I-kappaB kinase/NF-kappaB signaling | 55/3467 | 186/18723 | 1.60e-04 | 2.29e-03 | 55 |
| GO:00431222 | Colorectum | FAP | regulation of I-kappaB kinase/NF-kappaB signaling | 56/2622 | 249/18723 | 1.82e-04 | 2.69e-03 | 56 |
| GO:00431232 | Colorectum | FAP | positive regulation of I-kappaB kinase/NF-kappaB signaling | 42/2622 | 186/18723 | 1.01e-03 | 9.89e-03 | 42 |
| GO:00072492 | Colorectum | FAP | I-kappaB kinase/NF-kappaB signaling | 58/2622 | 281/18723 | 1.37e-03 | 1.24e-02 | 58 |
| GO:1903830 | Colorectum | FAP | magnesium ion transmembrane transport | 7/2622 | 17/18723 | 5.62e-03 | 3.61e-02 | 7 |
| GO:0015693 | Colorectum | FAP | magnesium ion transport | 7/2622 | 18/18723 | 8.10e-03 | 4.77e-02 | 7 |
| GO:19038301 | Colorectum | CRC | magnesium ion transmembrane transport | 7/2078 | 17/18723 | 1.46e-03 | 1.57e-02 | 7 |
| GO:00156931 | Colorectum | CRC | magnesium ion transport | 7/2078 | 18/18723 | 2.16e-03 | 2.11e-02 | 7 |
| GO:00431223 | Colorectum | CRC | regulation of I-kappaB kinase/NF-kappaB signaling | 41/2078 | 249/18723 | 6.39e-03 | 4.64e-02 | 41 |
| GO:004354313 | Esophagus | ESCC | protein acylation | 165/8552 | 243/18723 | 1.69e-12 | 7.14e-11 | 165 |
| GO:004312318 | Esophagus | ESCC | positive regulation of I-kappaB kinase/NF-kappaB signaling | 132/8552 | 186/18723 | 2.07e-12 | 8.58e-11 | 132 |
| GO:0043122110 | Esophagus | ESCC | regulation of I-kappaB kinase/NF-kappaB signaling | 167/8552 | 249/18723 | 6.11e-12 | 2.32e-10 | 167 |
| GO:000724919 | Esophagus | ESCC | I-kappaB kinase/NF-kappaB signaling | 183/8552 | 281/18723 | 3.02e-11 | 1.01e-09 | 183 |
| GO:00421573 | Esophagus | ESCC | lipoprotein metabolic process | 86/8552 | 135/18723 | 1.78e-05 | 1.57e-04 | 86 |
| GO:00064973 | Esophagus | ESCC | protein lipidation | 62/8552 | 92/18723 | 2.08e-05 | 1.80e-04 | 62 |
| Page: 1 2 |
| Pathway ID | Tissue | Disease Stage | Description | Gene Ratio | Bg Ratio | pvalue | p.adjust | qvalue | Count |
| Page: 1 |
Top |
Cell-cell communication analysis |
| Identification of potential cell-cell interactions between two cell types and their ligand-receptor pairs for different disease states |
| Ligand | Receptor | LRpair | Pathway | Tissue | Disease Stage |
| Page: 1 |
Top |
Single-cell gene regulatory network inference analysis |
| Find out the significant the regulons (TFs) and the target genes of each regulon across cell types for different disease states |
| TF | Cell Type | Tissue | Disease Stage | Target Gene | RSS | Regulon Activity |
| ∗The dot plots of a searched regulon are shown for all cell subpopulations in each disease state of each tissue based on the regulon specific score inferred using pySCENIC and by calculating the average expression. |
| Page: 1 |
Top |
Somatic mutation of malignant transformation related genes |
| Annotation of somatic variants for genes involved in malignant transformation |
| Hugo Symbol | Variant Class | Variant Classification | dbSNP RS | HGVSc | HGVSp | HGVSp Short | SWISSPROT | BIOTYPE | SIFT | PolyPhen | Tumor Sample Barcode | Tissue | Histology | Sex | Age | Stage | Therapy Types | Drugs | Outcome |
| ZDHHC13 | SNV | Missense_Mutation | c.374G>A | p.Arg125Gln | p.R125Q | Q8IUH4 | protein_coding | deleterious(0) | probably_damaging(0.999) | TCGA-C8-A12Q-01 | Breast | breast invasive carcinoma | Female | >=65 | III/IV | Unknown | Unknown | PD | |
| ZDHHC13 | SNV | Missense_Mutation | c.1853N>C | p.Val618Ala | p.V618A | Q8IUH4 | protein_coding | tolerated_low_confidence(0.52) | benign(0.237) | TCGA-D8-A1XK-01 | Breast | breast invasive carcinoma | Female | <65 | I/II | Chemotherapy | doxorubicine+cyclophosphamide | SD | |
| ZDHHC13 | SNV | Missense_Mutation | novel | c.470N>C | p.Val157Ala | p.V157A | Q8IUH4 | protein_coding | tolerated(0.45) | probably_damaging(0.932) | TCGA-2W-A8YY-01 | Cervix | cervical & endocervical cancer | Female | <65 | I/II | Chemotherapy | cisplatin | CR |
| ZDHHC13 | SNV | Missense_Mutation | c.1804N>T | p.Asp602Tyr | p.D602Y | Q8IUH4 | protein_coding | deleterious(0) | probably_damaging(0.999) | TCGA-EK-A3GM-01 | Cervix | cervical & endocervical cancer | Female | >=65 | I/II | Unknown | Unknown | SD | |
| ZDHHC13 | SNV | Missense_Mutation | c.1079T>G | p.Phe360Cys | p.F360C | Q8IUH4 | protein_coding | tolerated(0.08) | benign(0.43) | TCGA-CA-6718-01 | Colorectum | colon adenocarcinoma | Male | <65 | I/II | Unknown | Unknown | PD | |
| ZDHHC13 | SNV | Missense_Mutation | c.1513N>A | p.Gly505Arg | p.G505R | Q8IUH4 | protein_coding | deleterious(0) | probably_damaging(1) | TCGA-CM-6165-01 | Colorectum | colon adenocarcinoma | Male | >=65 | I/II | Unknown | Unknown | SD | |
| ZDHHC13 | SNV | Missense_Mutation | novel | c.46N>A | p.Gly16Ser | p.G16S | Q8IUH4 | protein_coding | deleterious_low_confidence(0) | benign(0.04) | TCGA-EF-5831-01 | Colorectum | rectum adenocarcinoma | Male | >=65 | I/II | Unknown | Unknown | SD |
| ZDHHC13 | insertion | Frame_Shift_Ins | novel | c.987dupT | p.Leu330SerfsTer13 | p.L330Sfs*13 | Q8IUH4 | protein_coding | TCGA-AA-3811-01 | Colorectum | colon adenocarcinoma | Female | >=65 | III/IV | Unknown | Unknown | PD | ||
| ZDHHC13 | insertion | Frame_Shift_Ins | novel | c.1066_1067insT | p.Trp358LeufsTer13 | p.W358Lfs*13 | Q8IUH4 | protein_coding | TCGA-AD-5900-01 | Colorectum | colon adenocarcinoma | Male | >=65 | I/II | Unknown | Unknown | SD | ||
| ZDHHC13 | SNV | Missense_Mutation | novel | c.444N>T | p.Glu148Asp | p.E148D | Q8IUH4 | protein_coding | deleterious(0) | probably_damaging(0.99) | TCGA-A5-A0G2-01 | Endometrium | uterine corpus endometrioid carcinoma | Female | <65 | III/IV | Unknown | Unknown | SD |
| Page: 1 2 3 4 |
Top |
Related drugs of malignant transformation related genes |
| Identification of chemicals and drugs interact with genes involved in malignant transfromation |
| (DGIdb 4.0) |
| Entrez ID | Symbol | Category | Interaction Types | Drug Claim Name | Drug Name | PMIDs |
| Page: 1 |

Copyright 2023-Present -The University of Texas Health Science Center at Houston |