Schematic overview of the cellular and molecular mechanisms involved in the cancer progression, including the proposed cellular and molecular mechanisms in cancer cells trajectory. AT1: alveolar type 1 cells; AT2: alveolar type 2 cells; AAH: atypical adenomatous hyperplasia; AIS: adenocarcinoma in situ; MIA: minimally invasive adenocarcinoma; IA: invasive adenocarcinoma; EMT: epithelial-mesenchymal transition

Home

Download

Statistics

Help

Contact

Center for Computational Systems Medicine
leaf

Gene summary

leaf

Malignant transformation analysis

leaf

Malignant transformation related pathway analysis

leaf

Cell-cell communication analysis

leaf

Single-cell gene regulatory network inference analysis

leaf

Somatic mutation of malignant transformation related genes

leaf

Related drugs of malignant transformation related genes

Gene: ZDHHC12

Gene summary for ZDHHC12

check button Gene summary.

Gene informationSpeciesHuman
Gene symbol

ZDHHC12

Gene ID

84885

Gene namezinc finger DHHC-type palmitoyltransferase 12
Gene AliasDHHC-12
Cytomap9q34.11
Gene Typeprotein-coding
GO ID

GO:0006464

UniProtAcc

Q96GR4


Top

Malignant transformation analysis

check button Identification of the aberrant gene expression in precancerous and cancerous lesions by comparing the gene expression of stem-like cells in diseased tissues with normal stem cells
check button Malignant transformation involving gene list.
Entrez IDSymbolReplicatesSpeciesOrganTissueAdj P-valueLog2FCMalignancy
84885ZDHHC12LZE2THumanEsophagusESCC1.27e-044.10e-010.082
84885ZDHHC12LZE4THumanEsophagusESCC3.51e-175.10e-010.0811
84885ZDHHC12LZE5THumanEsophagusESCC2.57e-021.18e-010.0514
84885ZDHHC12LZE7THumanEsophagusESCC2.12e-065.94e-010.0667
84885ZDHHC12LZE8THumanEsophagusESCC3.95e-111.71e-010.067
84885ZDHHC12LZE20THumanEsophagusESCC2.42e-166.95e-010.0662
84885ZDHHC12LZE22D1HumanEsophagusHGIN6.10e-042.89e-010.0595
84885ZDHHC12LZE22THumanEsophagusESCC2.24e-025.25e-010.068
84885ZDHHC12LZE24THumanEsophagusESCC2.67e-268.18e-010.0596
84885ZDHHC12LZE21THumanEsophagusESCC2.45e-035.87e-010.0655
84885ZDHHC12LZE6THumanEsophagusESCC5.47e-085.69e-010.0845
84885ZDHHC12P1T-EHumanEsophagusESCC4.73e-135.79e-010.0875
84885ZDHHC12P2T-EHumanEsophagusESCC7.34e-235.28e-010.1177
84885ZDHHC12P4T-EHumanEsophagusESCC8.00e-266.94e-010.1323
84885ZDHHC12P5T-EHumanEsophagusESCC7.19e-246.00e-010.1327
84885ZDHHC12P8T-EHumanEsophagusESCC1.08e-581.22e+000.0889
84885ZDHHC12P9T-EHumanEsophagusESCC1.44e-256.99e-010.1131
84885ZDHHC12P10T-EHumanEsophagusESCC2.12e-184.37e-010.116
84885ZDHHC12P11T-EHumanEsophagusESCC1.44e-209.38e-010.1426
84885ZDHHC12P12T-EHumanEsophagusESCC8.86e-212.97e-010.1122
Page: 1 2 3 4 5 6 7 

check button Transcriptomic changes along malignancy continuum.
TissueExpression DynamicsAbbreviation
EsophagusThe image shows the transcriptomic changes along malignancy continuum.log2FC in expression of this searched gene in stem-like cells from each diseased tissue sample relative to stem-like cells in normal samples in each tissue plotted against the malignancy continuum. Samples are colored based on if they are from different disease stage.
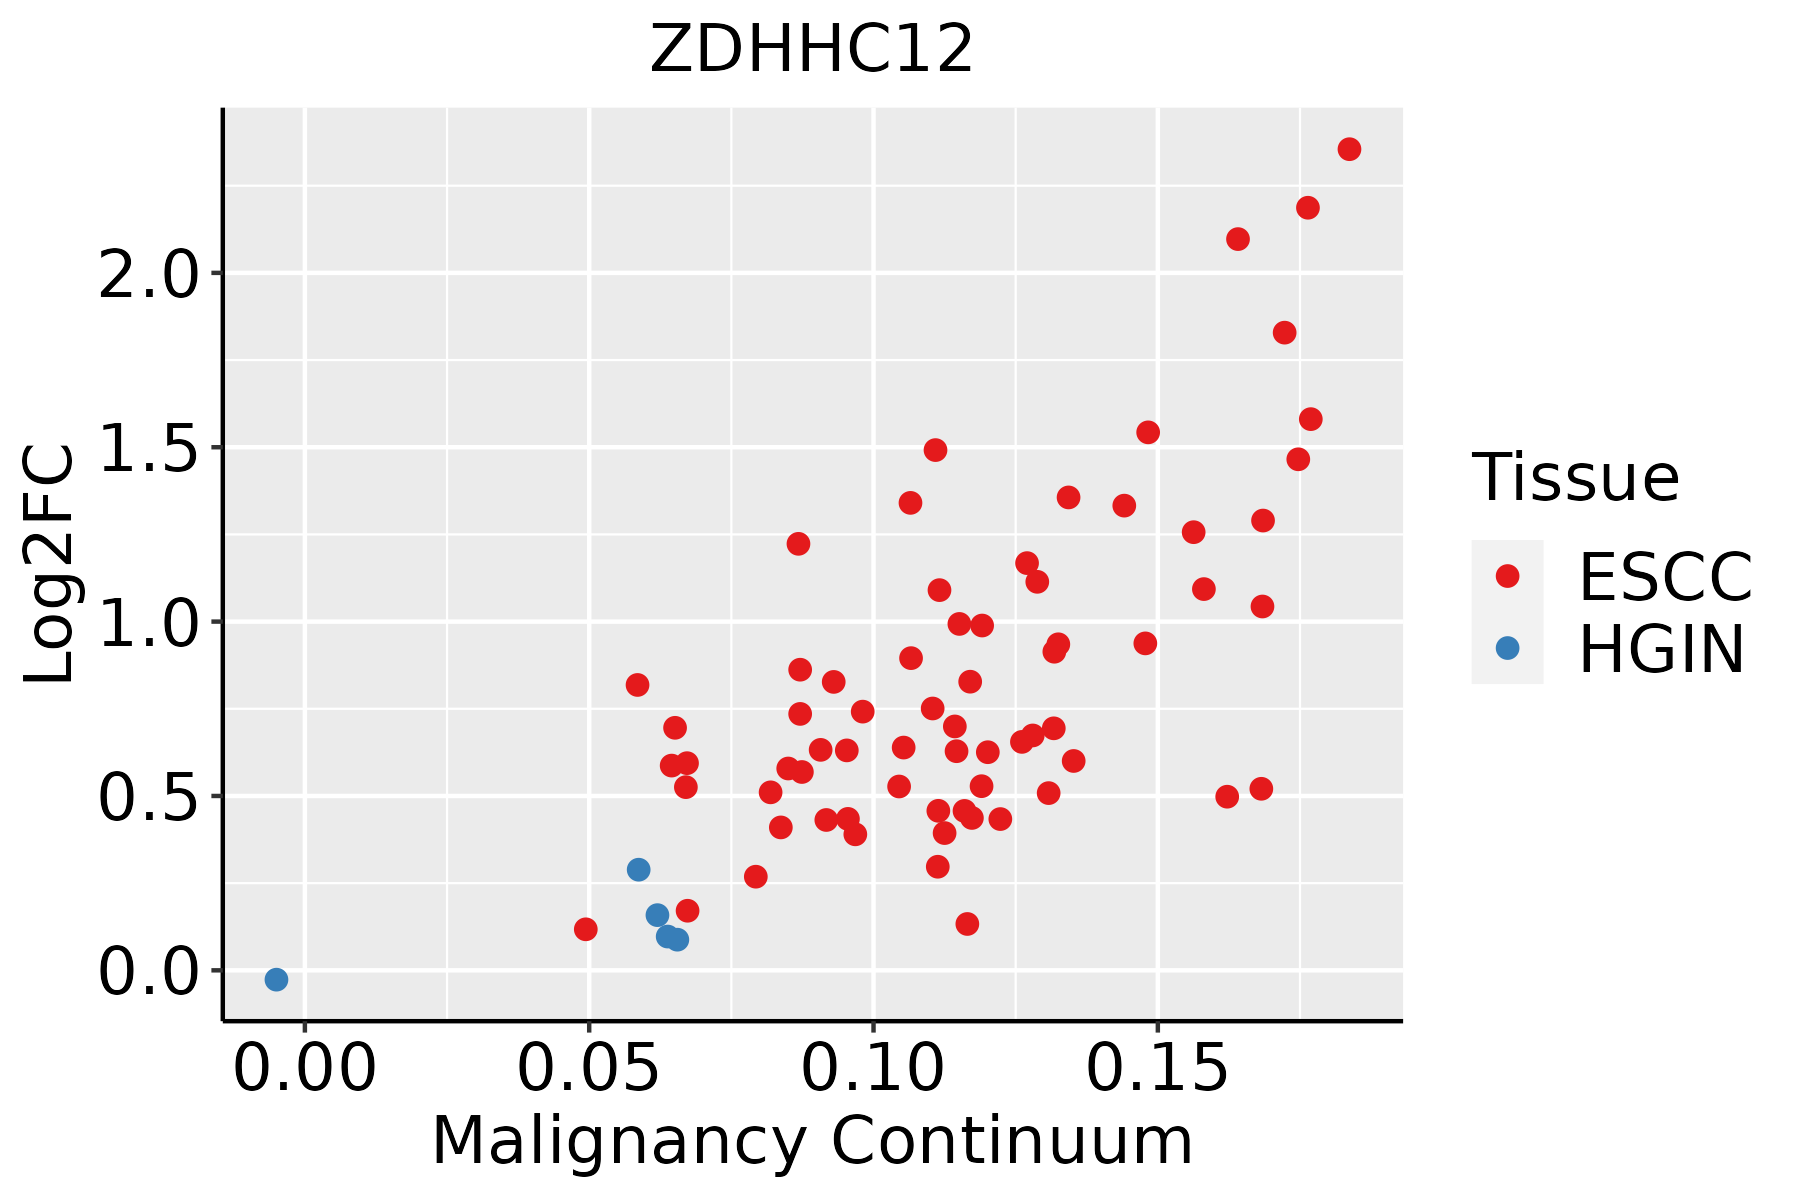
ESCC: Esophageal squamous cell carcinoma
HGIN: High-grade intraepithelial neoplasias
LGIN: Low-grade intraepithelial neoplasias
LiverThe image shows the transcriptomic changes along malignancy continuum.log2FC in expression of this searched gene in stem-like cells from each diseased tissue sample relative to stem-like cells in normal samples in each tissue plotted against the malignancy continuum. Samples are colored based on if they are from different disease stage.
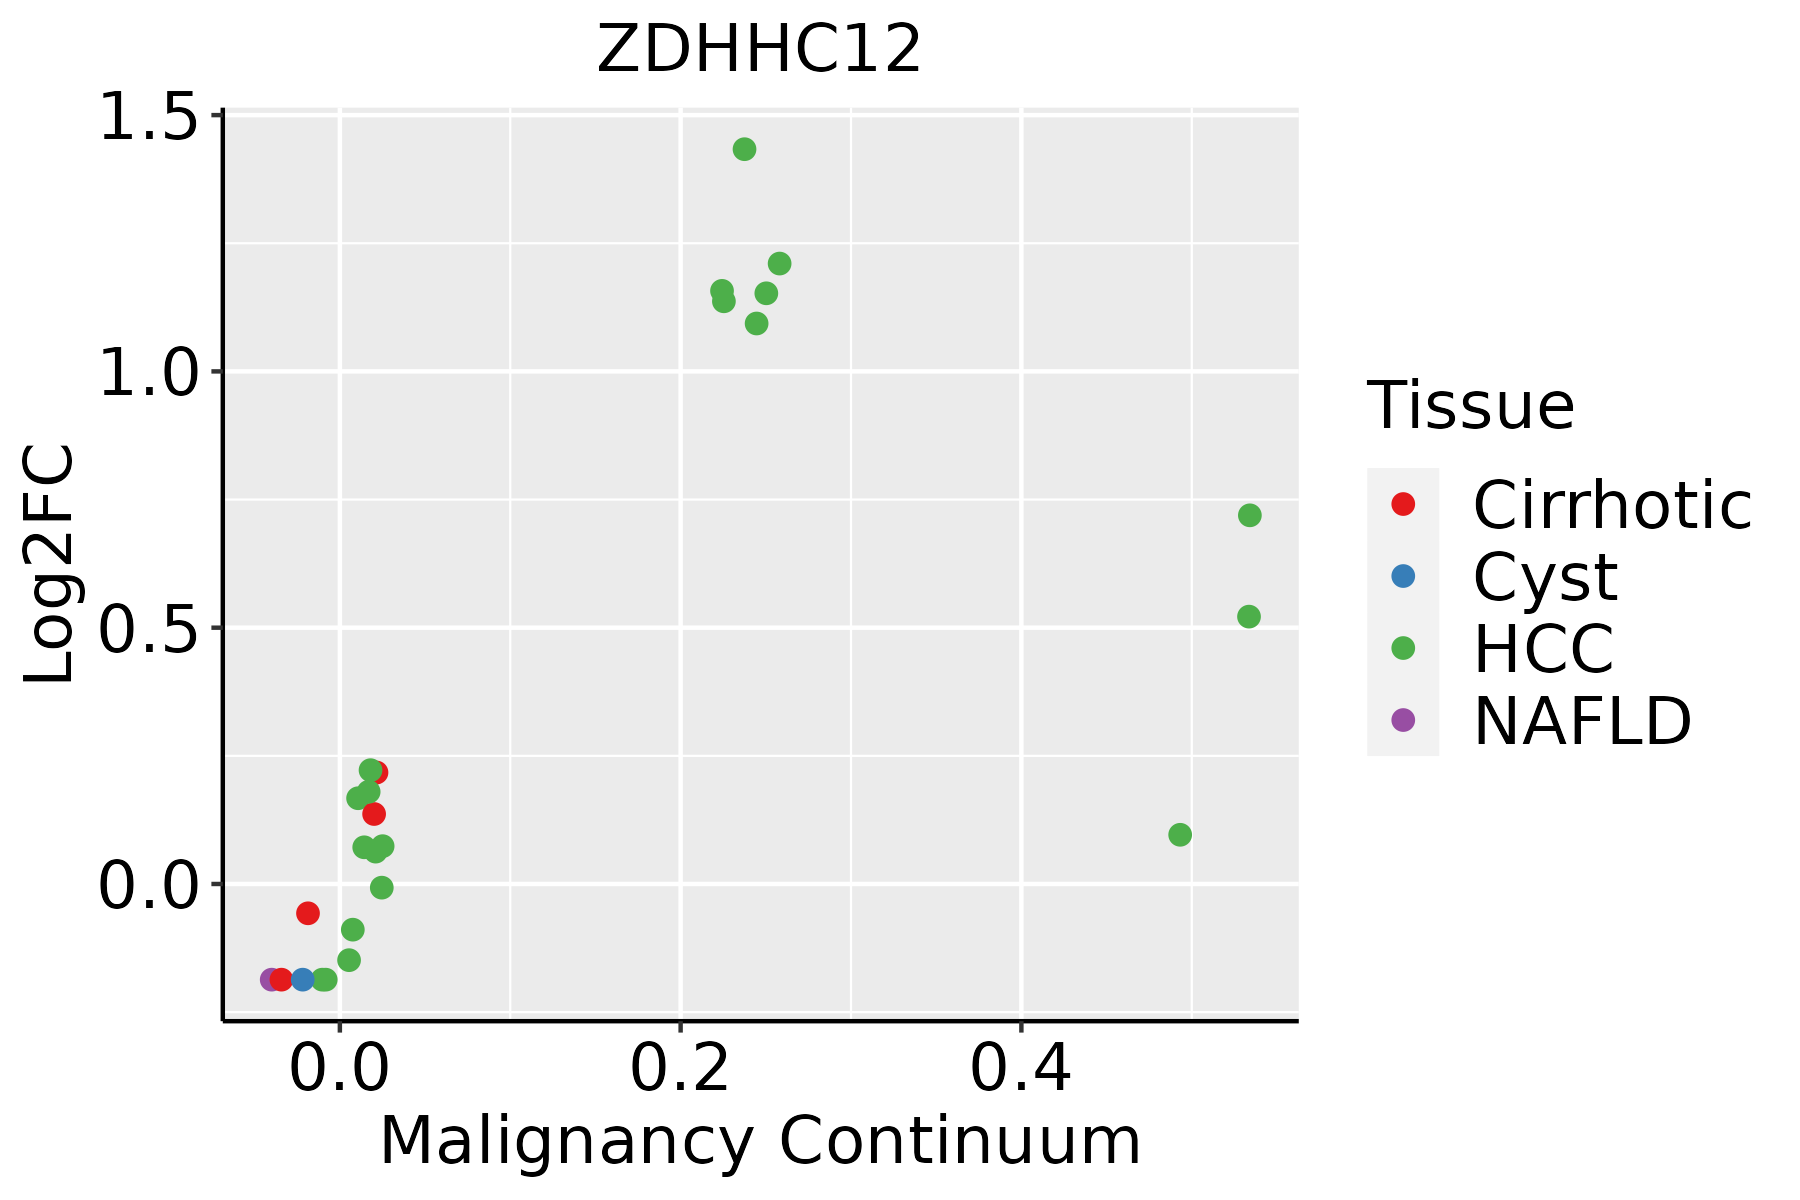
HCC: Hepatocellular carcinoma
NAFLD: Non-alcoholic fatty liver disease
Oral CavityThe image shows the transcriptomic changes along malignancy continuum.log2FC in expression of this searched gene in stem-like cells from each diseased tissue sample relative to stem-like cells in normal samples in each tissue plotted against the malignancy continuum. Samples are colored based on if they are from different disease stage.
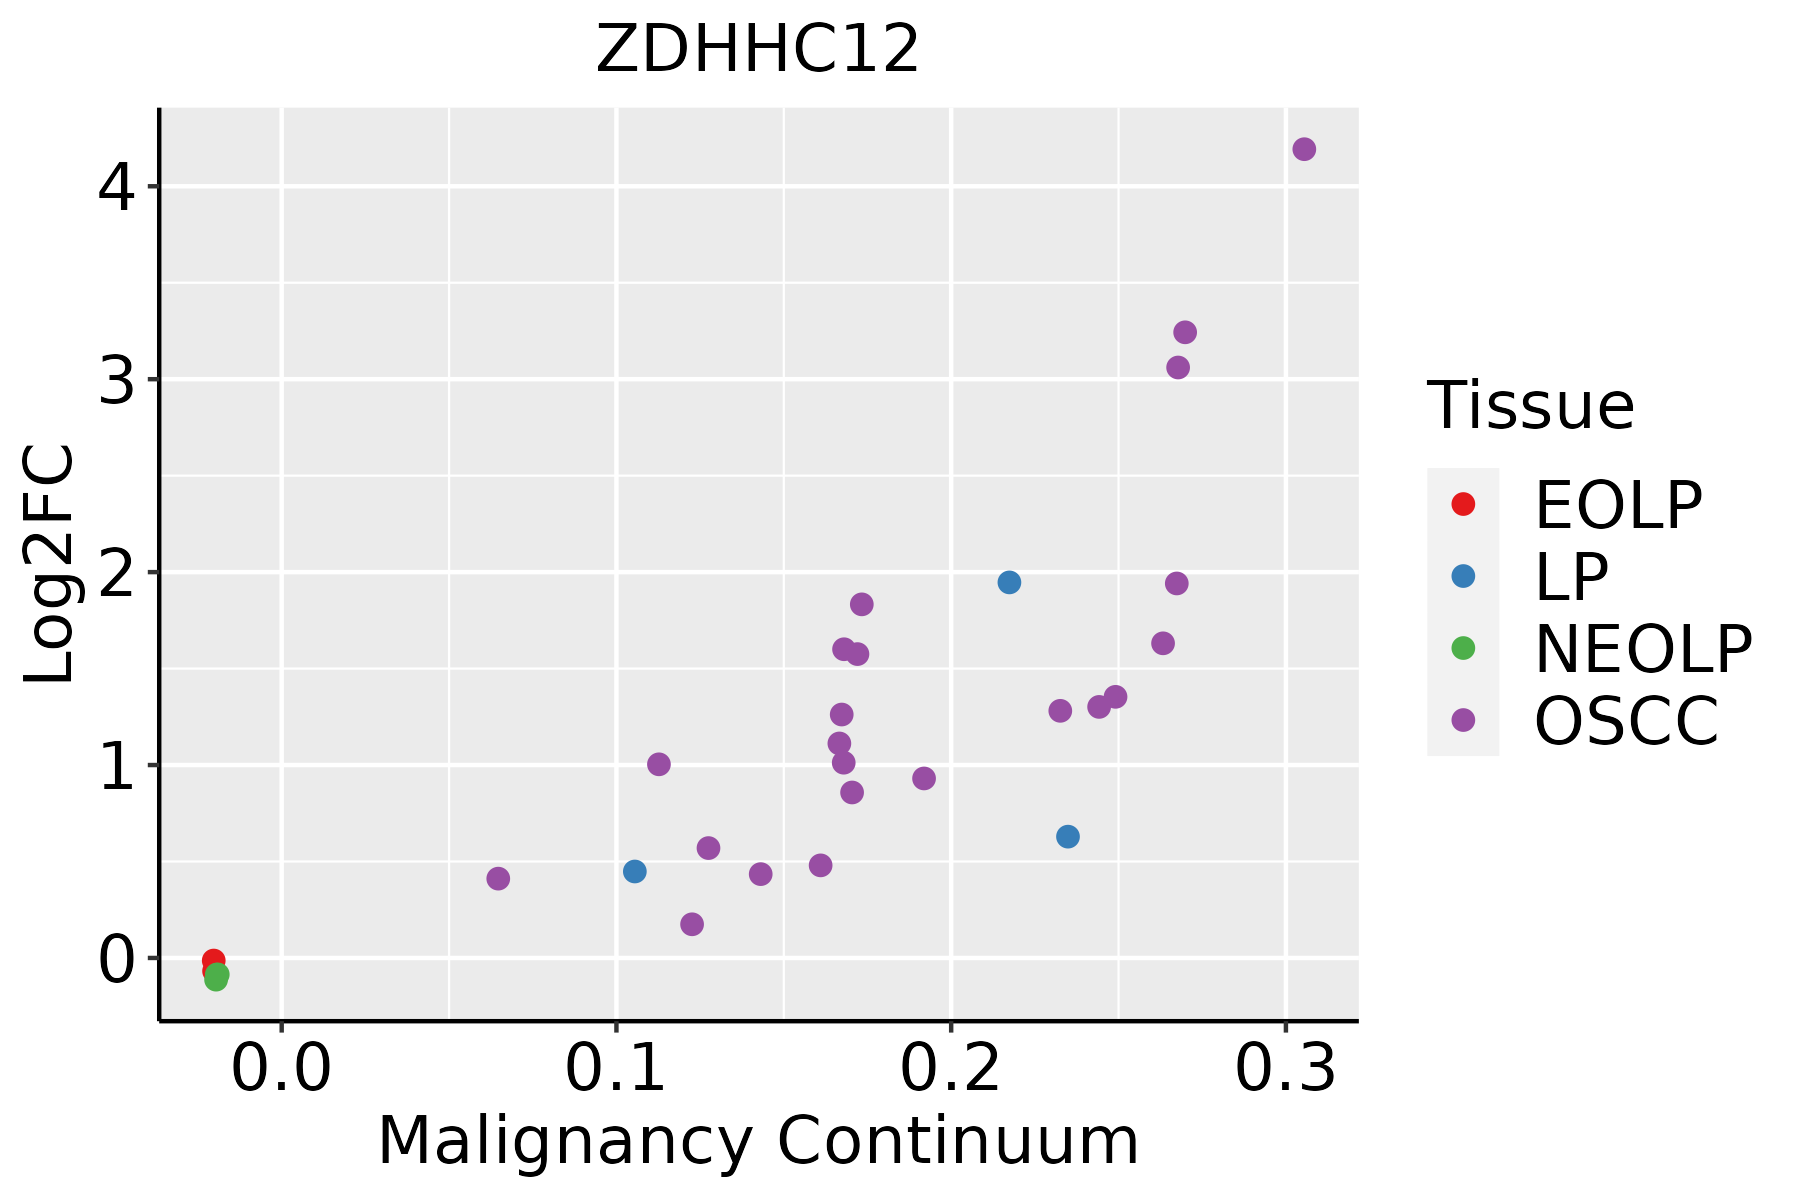
EOLP: Erosive Oral lichen planus
LP: leukoplakia
NEOLP: Non-erosive oral lichen planus
OSCC: Oral squamous cell carcinoma
ProstateThe image shows the transcriptomic changes along malignancy continuum.log2FC in expression of this searched gene in stem-like cells from each diseased tissue sample relative to stem-like cells in normal samples in each tissue plotted against the malignancy continuum. Samples are colored based on if they are from different disease stage.BPH: Benign Prostatic Hyperplasia
SkinThe image shows the transcriptomic changes along malignancy continuum.log2FC in expression of this searched gene in stem-like cells from each diseased tissue sample relative to stem-like cells in normal samples in each tissue plotted against the malignancy continuum. Samples are colored based on if they are from different disease stage.
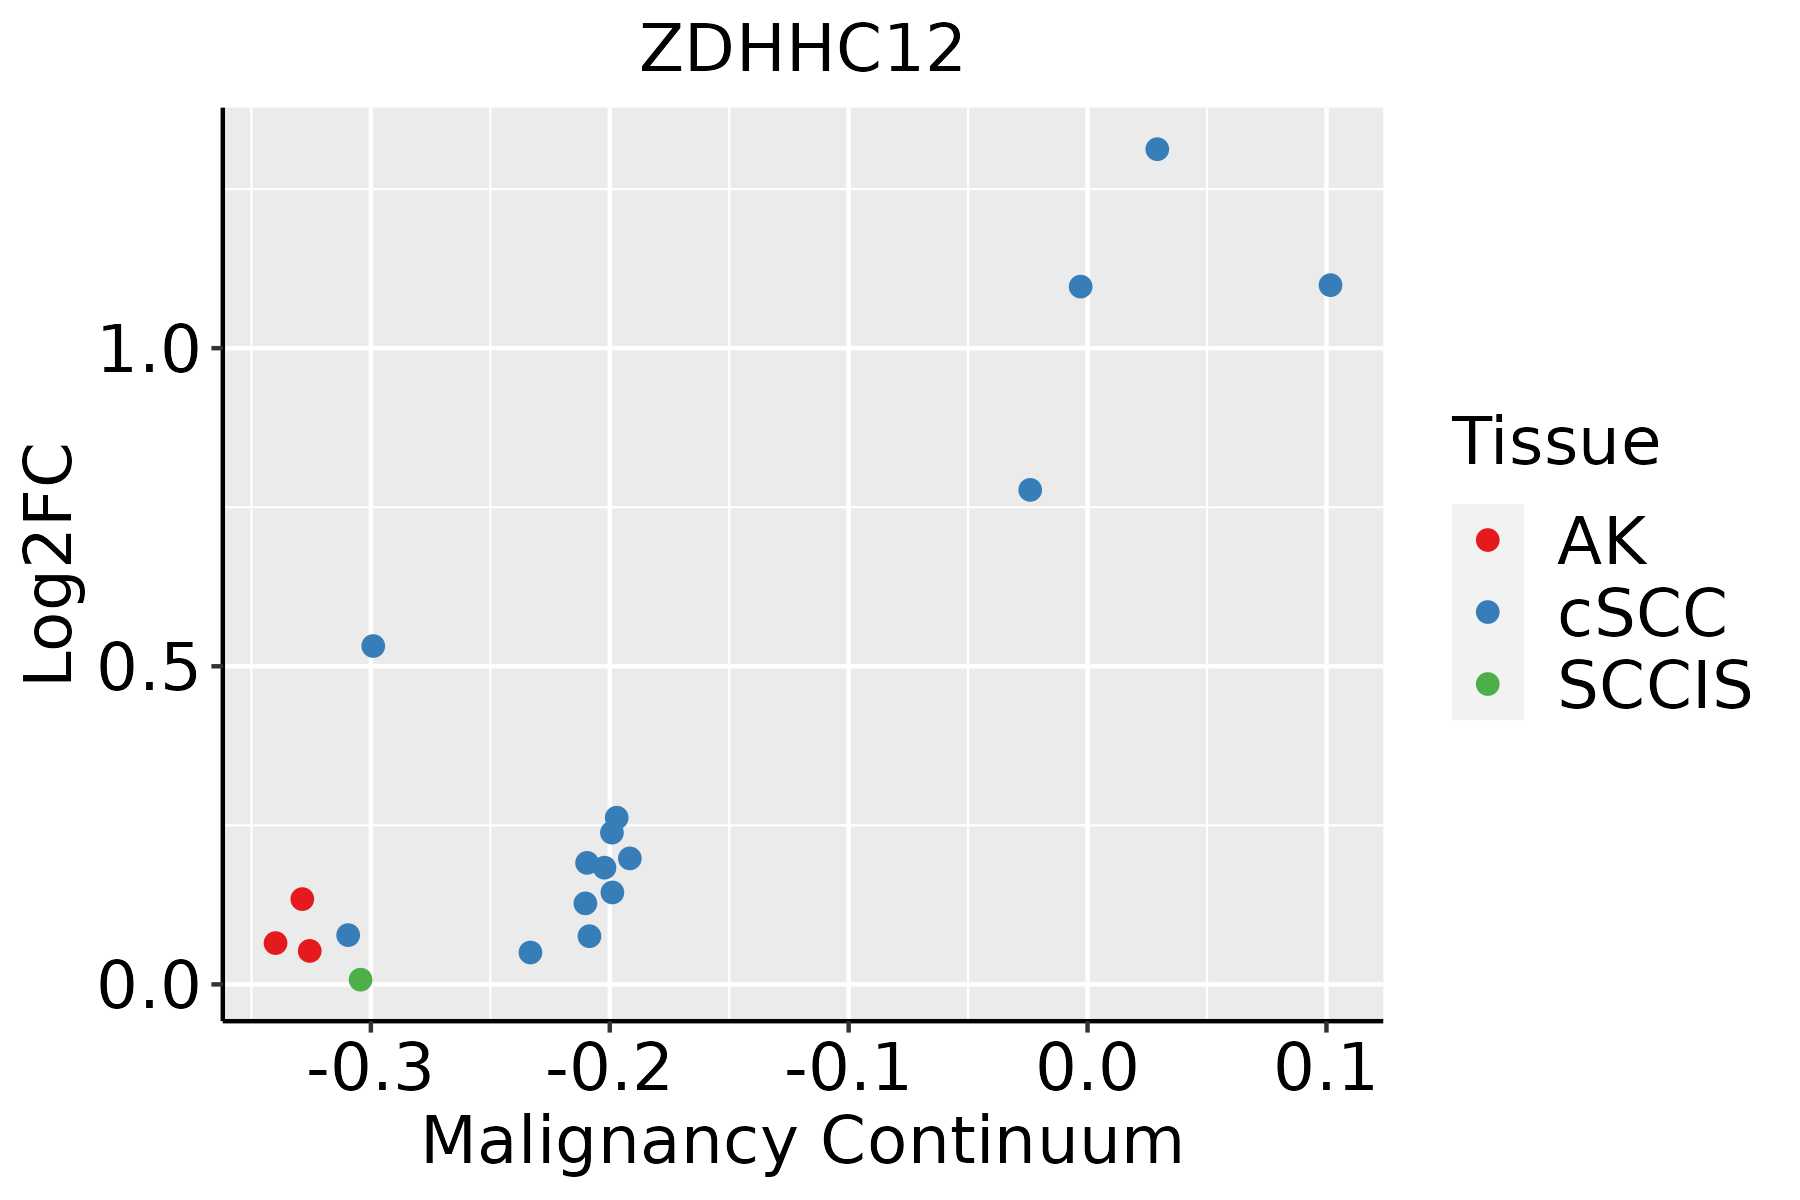
AK: Actinic keratosis
cSCC: Cutaneous squamous cell carcinoma
SCCIS:squamous cell carcinoma in situ
ThyroidThe image shows the transcriptomic changes along malignancy continuum.log2FC in expression of this searched gene in stem-like cells from each diseased tissue sample relative to stem-like cells in normal samples in each tissue plotted against the malignancy continuum. Samples are colored based on if they are from different disease stage.
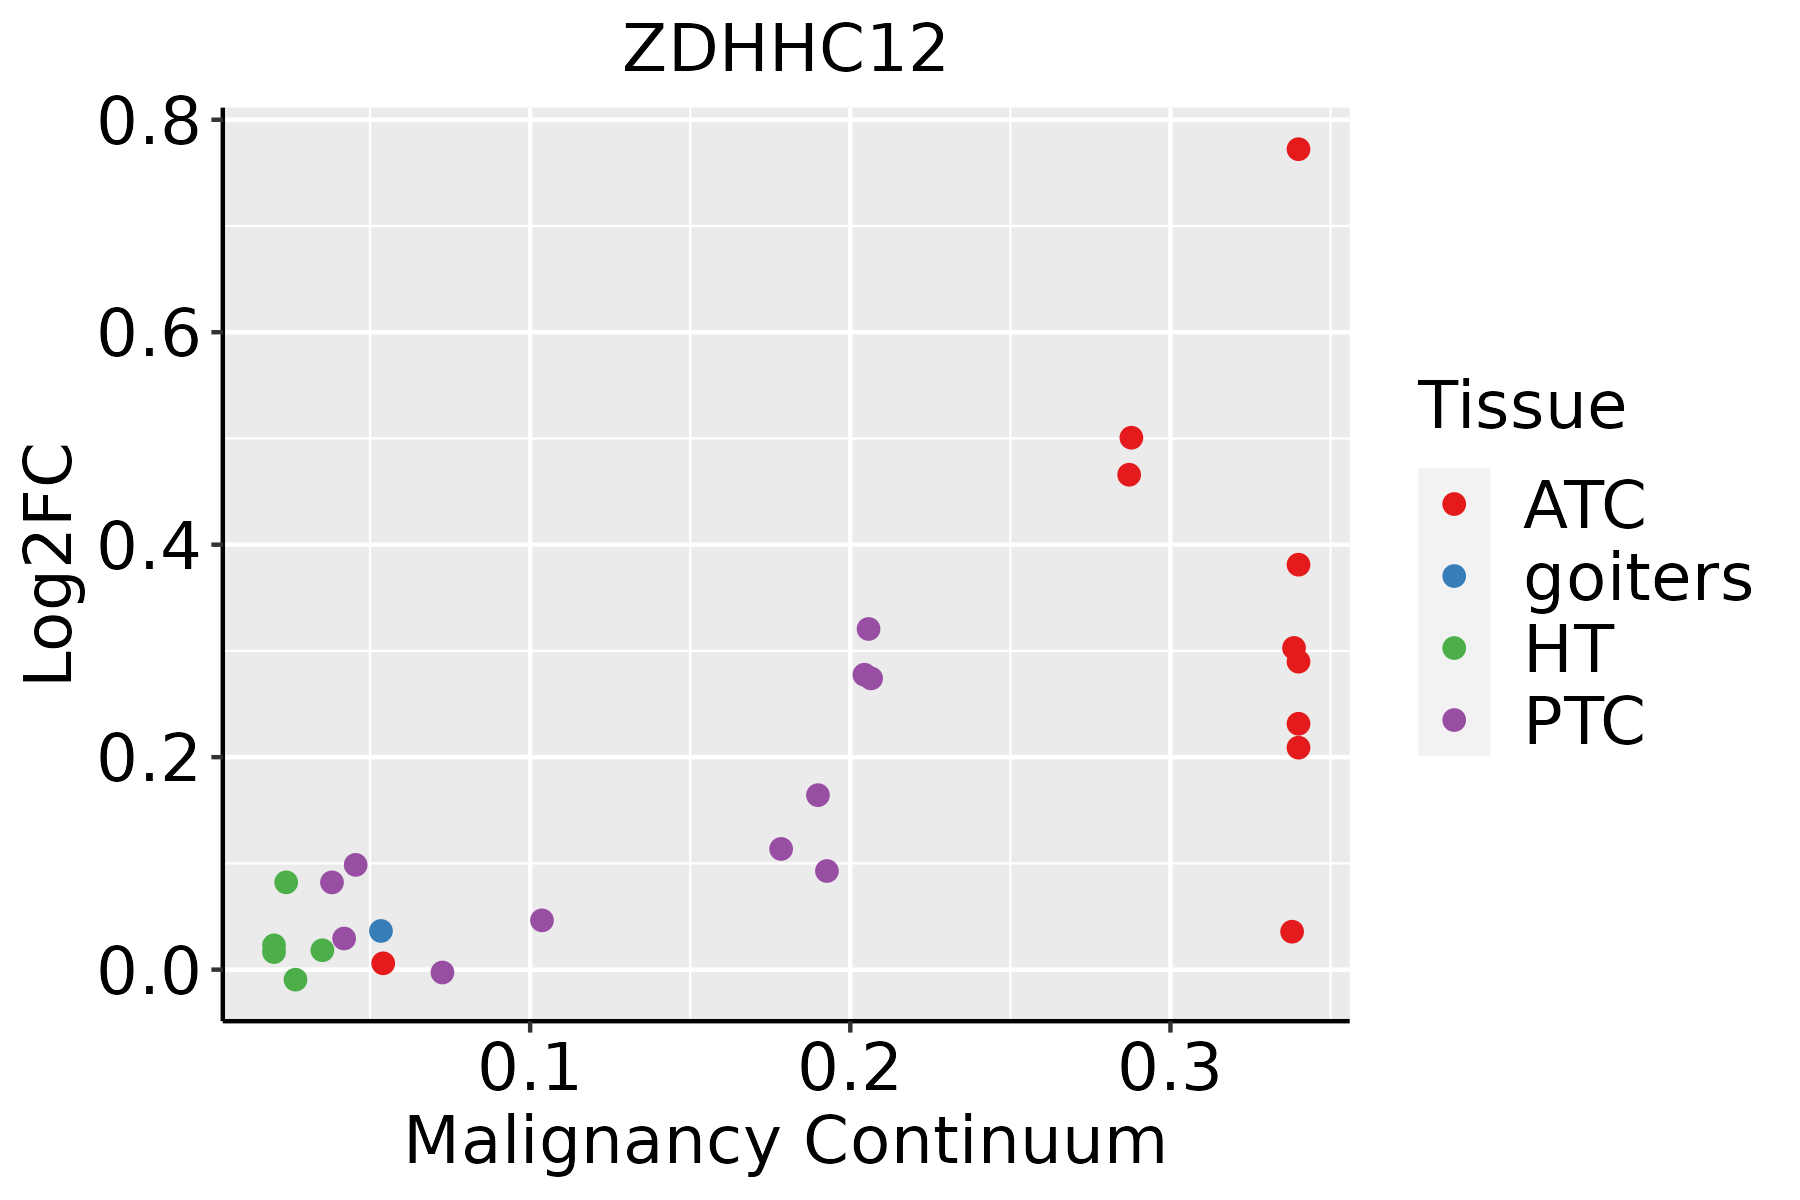
ATC: Anaplastic thyroid cancer
HT: Hashimoto's thyroiditis
PTC: Papillary thyroid cancer
∗log2FC in expression of this searched gene in stem-like cells from each diseased tissue sample relative to stem-like cells in normal samples in each tissue plotted against the malignancy continuum. Samples are colored based on if they are from different disease stage.

Top

Malignant transformation related pathway analysis

check buttonFind out the enriched GO biological processes and KEGG pathways involved in transition from healthy to precancer to cancer
check button Figure of enriched GO biological processes.
TissueDisease StageEnriched GO biological Processes
ColorectumADGO analysis - Figure of enriched GO biological processes: Top 15 enriched GO BP terms are showed in the bar plot of each disease state in each tissue. Each row represents a significant GO biological process which is colored according to the -log10(p.adjust).
ColorectumSERGO analysis - Figure of enriched GO biological processes: Top 15 enriched GO BP terms are showed in the bar plot of each disease state in each tissue. Each row represents a significant GO biological process which is colored according to the -log10(p.adjust).
ColorectumMSSGO analysis - Figure of enriched GO biological processes: Top 15 enriched GO BP terms are showed in the bar plot of each disease state in each tissue. Each row represents a significant GO biological process which is colored according to the -log10(p.adjust).
ColorectumMSI-HGO analysis - Figure of enriched GO biological processes: Top 15 enriched GO BP terms are showed in the bar plot of each disease state in each tissue. Each row represents a significant GO biological process which is colored according to the -log10(p.adjust).
ColorectumFAPGO analysis - Figure of enriched GO biological processes: Top 15 enriched GO BP terms are showed in the bar plot of each disease state in each tissue. Each row represents a significant GO biological process which is colored according to the -log10(p.adjust).
∗Top 15 enriched GO BP terms are showed in the bar plot of each disease state in each tissue. Each row represents a significant GO biological process which is colored according to the -log10(p.adjust).
Page: 1 2 3 4 5 6 7 8 9 

check button Enriched GO biological processes.
GO IDTissueDisease StageDescriptionGene RatioBg Ratiopvaluep.adjustCount
GO:000660525EsophagusHGINprotein targeting78/2587314/187231.08e-075.47e-0678
GO:009015020EsophagusHGINestablishment of protein localization to membrane67/2587260/187231.96e-079.57e-0667
GO:00435435EsophagusHGINprotein acylation51/2587243/187231.33e-031.57e-0251
GO:0006605111EsophagusESCCprotein targeting229/8552314/187234.93e-231.01e-20229
GO:0090150110EsophagusESCCestablishment of protein localization to membrane182/8552260/187231.27e-158.19e-14182
GO:004354313EsophagusESCCprotein acylation165/8552243/187231.69e-127.14e-11165
GO:00421573EsophagusESCClipoprotein metabolic process86/8552135/187231.78e-051.57e-0486
GO:00064973EsophagusESCCprotein lipidation62/855292/187232.08e-051.80e-0462
GO:00421583EsophagusESCClipoprotein biosynthetic process64/855296/187232.61e-052.20e-0464
GO:00066124EsophagusESCCprotein targeting to membrane83/8552131/187233.31e-052.73e-0483
GO:003432918EsophagusESCCcell junction assembly227/8552420/187233.06e-041.83e-03227
GO:00066057LiverCirrhoticprotein targeting148/4634314/187233.86e-186.20e-16148
GO:00901507LiverCirrhoticestablishment of protein localization to membrane123/4634260/187231.85e-152.15e-13123
GO:00435431LiverCirrhoticprotein acylation95/4634243/187234.73e-071.07e-0595
GO:00066122LiverCirrhoticprotein targeting to membrane53/4634131/187235.17e-055.95e-0453
GO:0042157LiverCirrhoticlipoprotein metabolic process53/4634135/187231.32e-041.29e-0353
GO:0042158LiverCirrhoticlipoprotein biosynthetic process36/463496/187233.69e-032.03e-0236
GO:0006497LiverCirrhoticprotein lipidation33/463492/187231.12e-024.92e-0233
GO:000660512LiverHCCprotein targeting219/7958314/187237.74e-231.49e-20219
GO:009015012LiverHCCestablishment of protein localization to membrane168/7958260/187234.07e-132.13e-11168
Page: 1 2 3 4 

check button Enriched KEGG pathways.
Pathway IDTissueDisease StageDescriptionGene RatioBg Ratiopvaluep.adjustqvalueCount
Page: 1 

Top

Cell-cell communication analysis

check buttonIdentification of potential cell-cell interactions between two cell types and their ligand-receptor pairs for different disease states
LigandReceptorLRpairPathwayTissueDisease Stage
Page: 1 

Top

Single-cell gene regulatory network inference analysis

check buttonFind out the significant the regulons (TFs) and the target genes of each regulon across cell types for different disease states
TFCell TypeTissueDisease StageTarget GeneRSSRegulon Activity
∗The dot plots of a searched regulon are shown for all cell subpopulations in each disease state of each tissue based on the regulon specific score inferred using pySCENIC and by calculating the average expression.
Page: 1 

Top

Somatic mutation of malignant transformation related genes

check buttonAnnotation of somatic variants for genes involved in malignant transformation
Hugo SymbolVariant ClassVariant ClassificationdbSNP RSHGVScHGVSpHGVSp ShortSWISSPROTBIOTYPESIFTPolyPhenTumor Sample BarcodeTissueHistologySexAgeStageTherapy TypesDrugsOutcome
ZDHHC12SNVMissense_Mutationc.94N>Cp.Asp32Hisp.D32HQ96GR4protein_codingdeleterious(0.01)possibly_damaging(0.752)TCGA-AC-A23H-01Breastbreast invasive carcinomaFemale>=65I/IIUnknownUnknownPD
ZDHHC12insertionIn_Frame_Insnovelc.343_344insGAGGGGGAAGGGACACACTTTGCCCAGTGACACTGAGCAp.Glu115delinsGlyGlyGlyArgAspThrLeuCysProValThrLeuSerLysp.E115delinsGGGRDTLCPVTLSKQ96GR4protein_codingTCGA-AN-A0FX-01Breastbreast invasive carcinomaFemale<65I/IIUnknownUnknownSD
ZDHHC12SNVMissense_Mutationnovelc.676N>Tp.Arg226Cysp.R226CQ96GR4protein_codingtolerated(0.08)benign(0.003)TCGA-MA-AA41-01Cervixcervical & endocervical cancerFemale<65I/IIUnknownUnknownSD
ZDHHC12SNVMissense_Mutationrs373582038c.187N>Ap.Ala63Thrp.A63TQ96GR4protein_codingtolerated(0.4)possibly_damaging(0.807)TCGA-D5-6928-01Colorectumcolon adenocarcinomaMale>=65I/IIUnknownUnknownSD
ZDHHC12SNVMissense_Mutationc.514N>Ap.Gln172Lysp.Q172KQ96GR4protein_codingtolerated(0.92)benign(0.007)TCGA-AP-A059-01Endometriumuterine corpus endometrioid carcinomaFemale>=65I/IIUnknownUnknownSD
ZDHHC12SNVMissense_Mutationrs754548655c.410N>Ap.Arg137Hisp.R137HQ96GR4protein_codingdeleterious(0)probably_damaging(0.947)TCGA-AP-A0LM-01Endometriumuterine corpus endometrioid carcinomaFemale<65III/IVChemotherapycisplatinSD
ZDHHC12SNVMissense_Mutationnovelc.661N>Ap.Ala221Thrp.A221TQ96GR4protein_codingtolerated(0.16)benign(0.007)TCGA-AX-A1CE-01Endometriumuterine corpus endometrioid carcinomaFemale<65I/IIUnspecificPaclitaxelSD
ZDHHC12SNVMissense_Mutationnovelc.655N>Ap.Arg219Serp.R219SQ96GR4protein_codingdeleterious(0)probably_damaging(0.995)TCGA-B5-A1MX-01Endometriumuterine corpus endometrioid carcinomaFemale<65I/IIHormone TherapymegaceSD
ZDHHC12SNVMissense_Mutationrs779093383c.524G>Ap.Arg175Glnp.R175QQ96GR4protein_codingtolerated(0.44)benign(0.017)TCGA-B5-A3FC-01Endometriumuterine corpus endometrioid carcinomaFemale<65I/IIUnknownUnknownSD
ZDHHC12SNVMissense_Mutationnovelc.430N>Ap.Val144Ilep.V144IQ96GR4protein_codingtolerated(0.39)benign(0.01)TCGA-DF-A2KU-01Endometriumuterine corpus endometrioid carcinomaFemaleUnknownI/IIUnknownUnknownSD
Page: 1 2 3 

Top

Related drugs of malignant transformation related genes

check buttonIdentification of chemicals and drugs interact with genes involved in malignant transfromation
(DGIdb 4.0)
Entrez IDSymbolCategoryInteraction TypesDrug Claim NameDrug NamePMIDs
Page: 1