
|
|||||
|
 | |
| |
| |
| |
| |
| |
|
Gene: ZDBF2 |
Gene summary for ZDBF2 |
| Gene information | Species | Human | Gene symbol | ZDBF2 | Gene ID | 57683 |
| Gene name | zinc finger DBF-type containing 2 | |
| Gene Alias | Slx9 | |
| Cytomap | 2q33.3 | |
| Gene Type | protein-coding | GO ID | GO:0003674 | UniProtAcc | N0DVX5 |
Top |
Malignant transformation analysis |
| Identification of the aberrant gene expression in precancerous and cancerous lesions by comparing the gene expression of stem-like cells in diseased tissues with normal stem cells |
| Entrez ID | Symbol | Replicates | Species | Organ | Tissue | Adj P-value | Log2FC | Malignancy |
| 57683 | ZDBF2 | LZE4T | Human | Esophagus | ESCC | 6.44e-07 | 2.97e-01 | 0.0811 |
| 57683 | ZDBF2 | LZE7T | Human | Esophagus | ESCC | 1.89e-08 | 5.99e-01 | 0.0667 |
| 57683 | ZDBF2 | P2T-E | Human | Esophagus | ESCC | 2.06e-08 | 1.51e-01 | 0.1177 |
| 57683 | ZDBF2 | P9T-E | Human | Esophagus | ESCC | 3.65e-03 | 8.10e-02 | 0.1131 |
| 57683 | ZDBF2 | P10T-E | Human | Esophagus | ESCC | 7.90e-03 | 7.02e-02 | 0.116 |
| 57683 | ZDBF2 | P16T-E | Human | Esophagus | ESCC | 9.35e-10 | 1.40e-01 | 0.1153 |
| 57683 | ZDBF2 | P22T-E | Human | Esophagus | ESCC | 4.44e-08 | 1.53e-01 | 0.1236 |
| 57683 | ZDBF2 | P32T-E | Human | Esophagus | ESCC | 8.84e-05 | 1.03e-01 | 0.1666 |
| 57683 | ZDBF2 | P37T-E | Human | Esophagus | ESCC | 3.04e-07 | 1.29e-01 | 0.1371 |
| 57683 | ZDBF2 | P48T-E | Human | Esophagus | ESCC | 3.97e-04 | 1.07e-01 | 0.0959 |
| 57683 | ZDBF2 | P49T-E | Human | Esophagus | ESCC | 1.22e-03 | 6.53e-01 | 0.1768 |
| 57683 | ZDBF2 | P56T-E | Human | Esophagus | ESCC | 3.65e-05 | 6.51e-01 | 0.1613 |
| 57683 | ZDBF2 | P62T-E | Human | Esophagus | ESCC | 2.37e-05 | 9.93e-02 | 0.1302 |
| 57683 | ZDBF2 | P76T-E | Human | Esophagus | ESCC | 8.40e-04 | 7.63e-02 | 0.1207 |
| 57683 | ZDBF2 | P79T-E | Human | Esophagus | ESCC | 1.76e-12 | 2.34e-01 | 0.1154 |
| 57683 | ZDBF2 | P107T-E | Human | Esophagus | ESCC | 1.41e-03 | 1.68e-01 | 0.171 |
| 57683 | ZDBF2 | P130T-E | Human | Esophagus | ESCC | 9.67e-18 | 3.82e-01 | 0.1676 |
| 57683 | ZDBF2 | male-WTA | Human | Thyroid | PTC | 9.88e-08 | 6.31e-02 | 0.1037 |
| 57683 | ZDBF2 | PTC01 | Human | Thyroid | PTC | 1.69e-05 | 3.47e-02 | 0.1899 |
| 57683 | ZDBF2 | PTC04 | Human | Thyroid | PTC | 1.74e-06 | 1.92e-01 | 0.1927 |
| Page: 1 2 |
| Tissue | Expression Dynamics | Abbreviation |
| Esophagus | 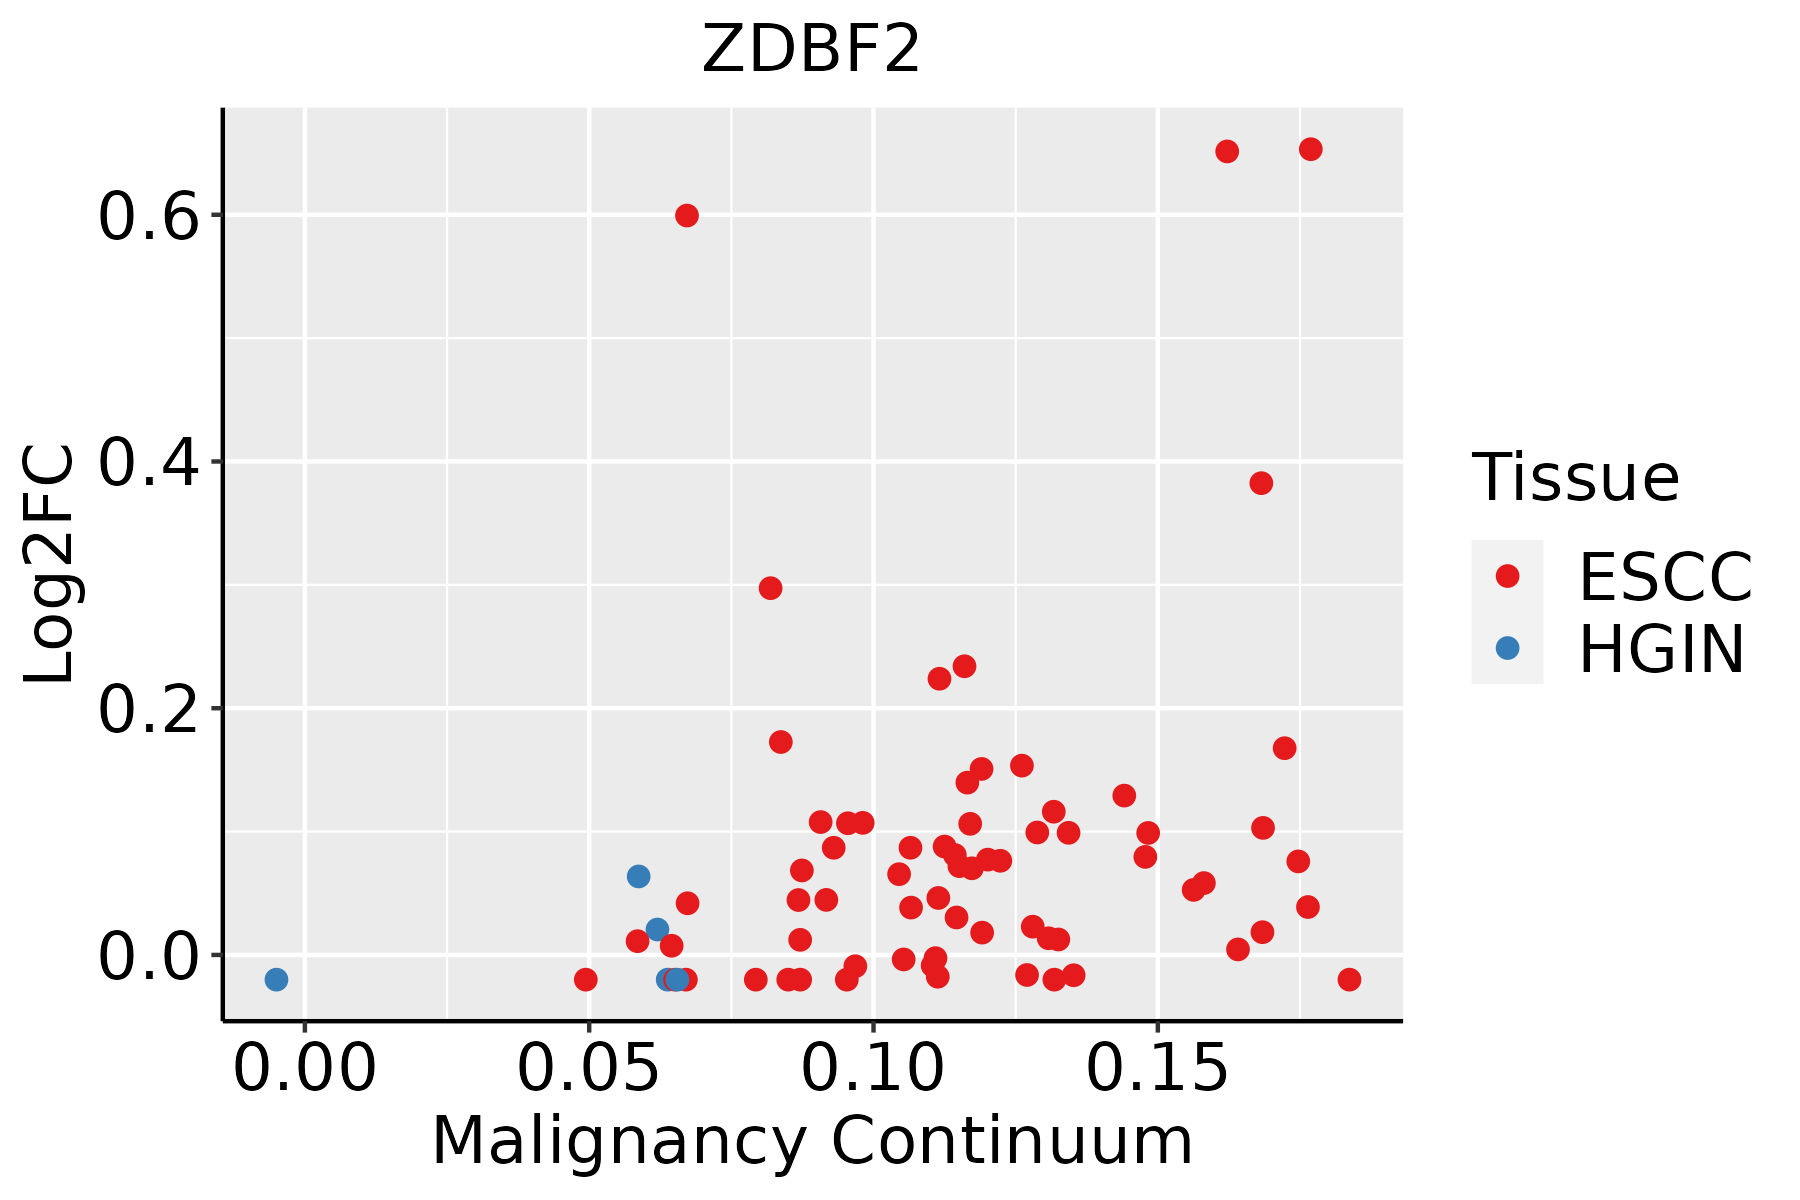 | ESCC: Esophageal squamous cell carcinoma |
| HGIN: High-grade intraepithelial neoplasias | ||
| LGIN: Low-grade intraepithelial neoplasias | ||
| Thyroid | 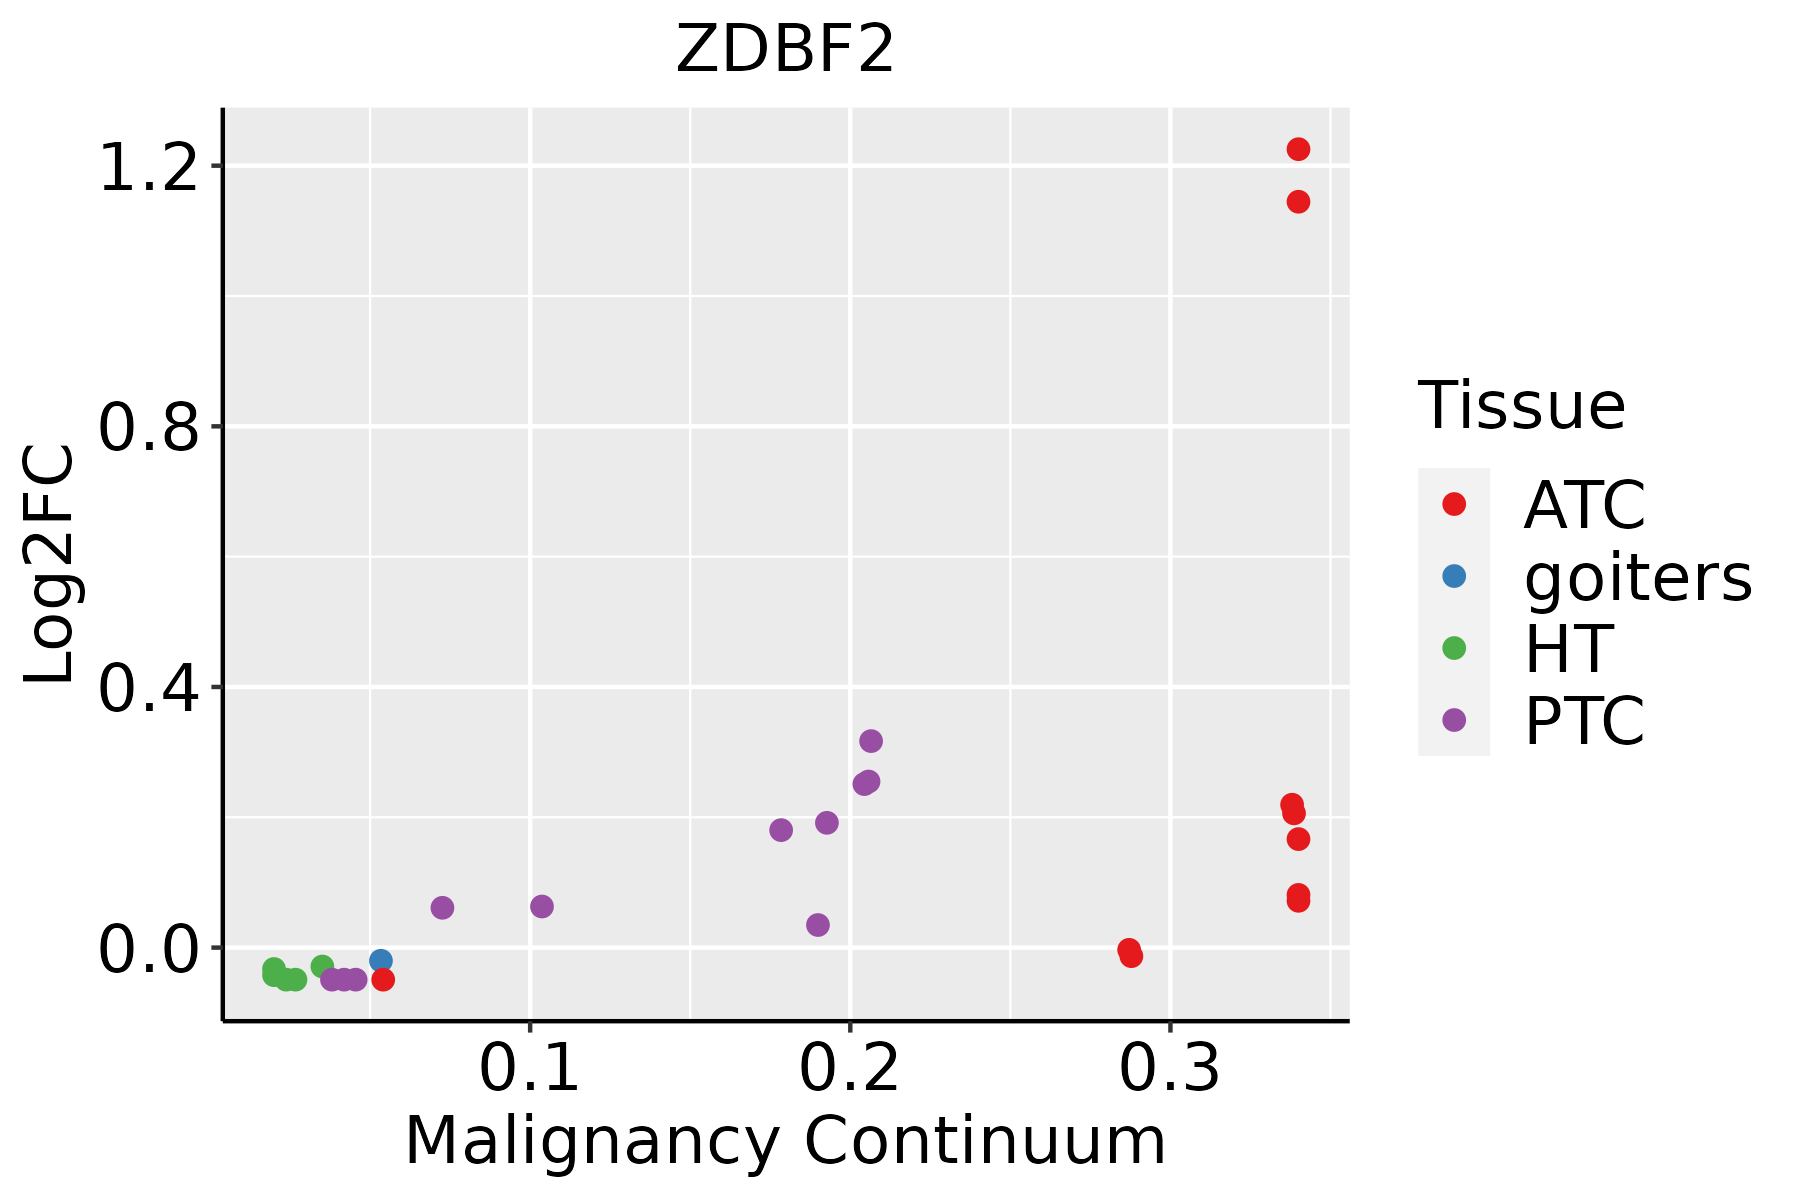 | ATC: Anaplastic thyroid cancer |
| HT: Hashimoto's thyroiditis | ||
| PTC: Papillary thyroid cancer |
| ∗log2FC in expression of this searched gene in stem-like cells from each diseased tissue sample relative to stem-like cells in normal samples in each tissue plotted against the malignancy continuum. Samples are colored based on if they are from different disease stage. |
Top |
Malignant transformation related pathway analysis |
| Find out the enriched GO biological processes and KEGG pathways involved in transition from healthy to precancer to cancer |
| Tissue | Disease Stage | Enriched GO biological Processes |
| Colorectum | AD |  |
| Colorectum | SER |  |
| Colorectum | MSS |  |
| Colorectum | MSI-H |  |
| Colorectum | FAP |  |
| ∗Top 15 enriched GO BP terms are showed in the bar plot of each disease state in each tissue. Each row represents a significant GO biological process which is colored according to the -log10(p.adjust). |
| Page: 1 2 3 4 5 6 7 8 9 |
| GO ID | Tissue | Disease Stage | Description | Gene Ratio | Bg Ratio | pvalue | p.adjust | Count |
| Page: 1 |
| Pathway ID | Tissue | Disease Stage | Description | Gene Ratio | Bg Ratio | pvalue | p.adjust | qvalue | Count |
| Page: 1 |
Top |
Cell-cell communication analysis |
| Identification of potential cell-cell interactions between two cell types and their ligand-receptor pairs for different disease states |
| Ligand | Receptor | LRpair | Pathway | Tissue | Disease Stage |
| Page: 1 |
Top |
Single-cell gene regulatory network inference analysis |
| Find out the significant the regulons (TFs) and the target genes of each regulon across cell types for different disease states |
| TF | Cell Type | Tissue | Disease Stage | Target Gene | RSS | Regulon Activity |
| ∗The dot plots of a searched regulon are shown for all cell subpopulations in each disease state of each tissue based on the regulon specific score inferred using pySCENIC and by calculating the average expression. |
| Page: 1 |
Top |
Somatic mutation of malignant transformation related genes |
| Annotation of somatic variants for genes involved in malignant transformation |
| Hugo Symbol | Variant Class | Variant Classification | dbSNP RS | HGVSc | HGVSp | HGVSp Short | SWISSPROT | BIOTYPE | SIFT | PolyPhen | Tumor Sample Barcode | Tissue | Histology | Sex | Age | Stage | Therapy Types | Drugs | Outcome |
| ZDBF2 | SNV | Missense_Mutation | c.6529N>G | p.His2177Asp | p.H2177D | Q9HCK1 | protein_coding | tolerated(0.28) | benign(0.023) | TCGA-A2-A0EY-01 | Breast | breast invasive carcinoma | Female | <65 | I/II | Chemotherapy | adriamycin | SD | |
| ZDBF2 | SNV | Missense_Mutation | c.2125N>T | p.Asp709Tyr | p.D709Y | Q9HCK1 | protein_coding | deleterious(0) | possibly_damaging(0.908) | TCGA-A8-A07I-01 | Breast | breast invasive carcinoma | Female | >=65 | III/IV | Chemotherapy | 5-fluorouracil | CR | |
| ZDBF2 | SNV | Missense_Mutation | novel | c.3068N>T | p.Arg1023Ile | p.R1023I | Q9HCK1 | protein_coding | tolerated(0.17) | possibly_damaging(0.797) | TCGA-AN-A046-01 | Breast | breast invasive carcinoma | Female | >=65 | I/II | Unknown | Unknown | SD |
| ZDBF2 | SNV | Missense_Mutation | novel | c.4442N>G | p.Glu1481Gly | p.E1481G | Q9HCK1 | protein_coding | tolerated(0.08) | possibly_damaging(0.452) | TCGA-AN-A046-01 | Breast | breast invasive carcinoma | Female | >=65 | I/II | Unknown | Unknown | SD |
| ZDBF2 | SNV | Missense_Mutation | rs749703720 | c.5024N>A | p.Arg1675Gln | p.R1675Q | Q9HCK1 | protein_coding | tolerated(0.07) | benign(0.052) | TCGA-AN-A046-01 | Breast | breast invasive carcinoma | Female | >=65 | I/II | Unknown | Unknown | SD |
| ZDBF2 | SNV | Missense_Mutation | novel | c.7046N>T | p.Arg2349Ile | p.R2349I | Q9HCK1 | protein_coding | deleterious(0) | benign(0.091) | TCGA-AN-A046-01 | Breast | breast invasive carcinoma | Female | >=65 | I/II | Unknown | Unknown | SD |
| ZDBF2 | SNV | Missense_Mutation | novel | c.6959N>G | p.Ser2320Cys | p.S2320C | Q9HCK1 | protein_coding | tolerated(0.18) | benign(0) | TCGA-AN-A0FX-01 | Breast | breast invasive carcinoma | Female | <65 | I/II | Unknown | Unknown | SD |
| ZDBF2 | SNV | Missense_Mutation | c.3345N>T | p.Lys1115Asn | p.K1115N | Q9HCK1 | protein_coding | deleterious(0.01) | probably_damaging(0.916) | TCGA-B6-A0IJ-01 | Breast | breast invasive carcinoma | Female | <65 | I/II | Unknown | Unknown | SD | |
| ZDBF2 | SNV | Missense_Mutation | novel | c.3208N>A | p.Asp1070Asn | p.D1070N | Q9HCK1 | protein_coding | tolerated(0.21) | benign(0.034) | TCGA-B6-A400-01 | Breast | breast invasive carcinoma | Female | <65 | III/IV | Unknown | Unknown | SD |
| ZDBF2 | SNV | Missense_Mutation | rs781279011 | c.6683C>T | p.Ser2228Leu | p.S2228L | Q9HCK1 | protein_coding | tolerated(0.66) | benign(0.023) | TCGA-BH-A0DG-01 | Breast | breast invasive carcinoma | Female | <65 | I/II | Chemotherapy | taxotere | CR |
| Page: 1 2 3 4 5 6 7 8 9 10 11 12 13 14 15 16 17 18 19 20 21 22 23 24 25 26 27 28 29 30 31 32 33 34 35 36 37 |
Top |
Related drugs of malignant transformation related genes |
| Identification of chemicals and drugs interact with genes involved in malignant transfromation |
| (DGIdb 4.0) |
| Entrez ID | Symbol | Category | Interaction Types | Drug Claim Name | Drug Name | PMIDs |
| Page: 1 |

Copyright 2023-Present -The University of Texas Health Science Center at Houston |