
|
|||||
|
 | |
| |
| |
| |
| |
| |
|
Gene: ZCWPW1 |
Gene summary for ZCWPW1 |
| Gene information | Species | Human | Gene symbol | ZCWPW1 | Gene ID | 55063 |
| Gene name | zinc finger CW-type and PWWP domain containing 1 | |
| Gene Alias | ZCW1 | |
| Cytomap | 7q22.1 | |
| Gene Type | protein-coding | GO ID | GO:0000003 | UniProtAcc | Q9H0M4 |
Top |
Malignant transformation analysis |
| Identification of the aberrant gene expression in precancerous and cancerous lesions by comparing the gene expression of stem-like cells in diseased tissues with normal stem cells |
| Entrez ID | Symbol | Replicates | Species | Organ | Tissue | Adj P-value | Log2FC | Malignancy |
| 55063 | ZCWPW1 | HCC1_Meng | Human | Liver | HCC | 6.04e-06 | -1.22e-02 | 0.0246 |
| 55063 | ZCWPW1 | HCC2 | Human | Liver | HCC | 4.92e-06 | 3.18e+00 | 0.5341 |
| 55063 | ZCWPW1 | S027 | Human | Liver | HCC | 3.19e-11 | 9.13e-01 | 0.2446 |
| 55063 | ZCWPW1 | S028 | Human | Liver | HCC | 4.81e-29 | 9.98e-01 | 0.2503 |
| 55063 | ZCWPW1 | S029 | Human | Liver | HCC | 1.74e-24 | 1.20e+00 | 0.2581 |
| 55063 | ZCWPW1 | C21 | Human | Oral cavity | OSCC | 1.15e-02 | 2.33e-01 | 0.2678 |
| 55063 | ZCWPW1 | C43 | Human | Oral cavity | OSCC | 3.38e-06 | 1.42e-01 | 0.1704 |
| 55063 | ZCWPW1 | C46 | Human | Oral cavity | OSCC | 2.98e-19 | 5.34e-01 | 0.1673 |
| 55063 | ZCWPW1 | C08 | Human | Oral cavity | OSCC | 2.30e-08 | 1.95e-01 | 0.1919 |
| 55063 | ZCWPW1 | LN46 | Human | Oral cavity | OSCC | 1.52e-15 | 5.58e-01 | 0.1666 |
| Page: 1 |
| Tissue | Expression Dynamics | Abbreviation |
| Liver | 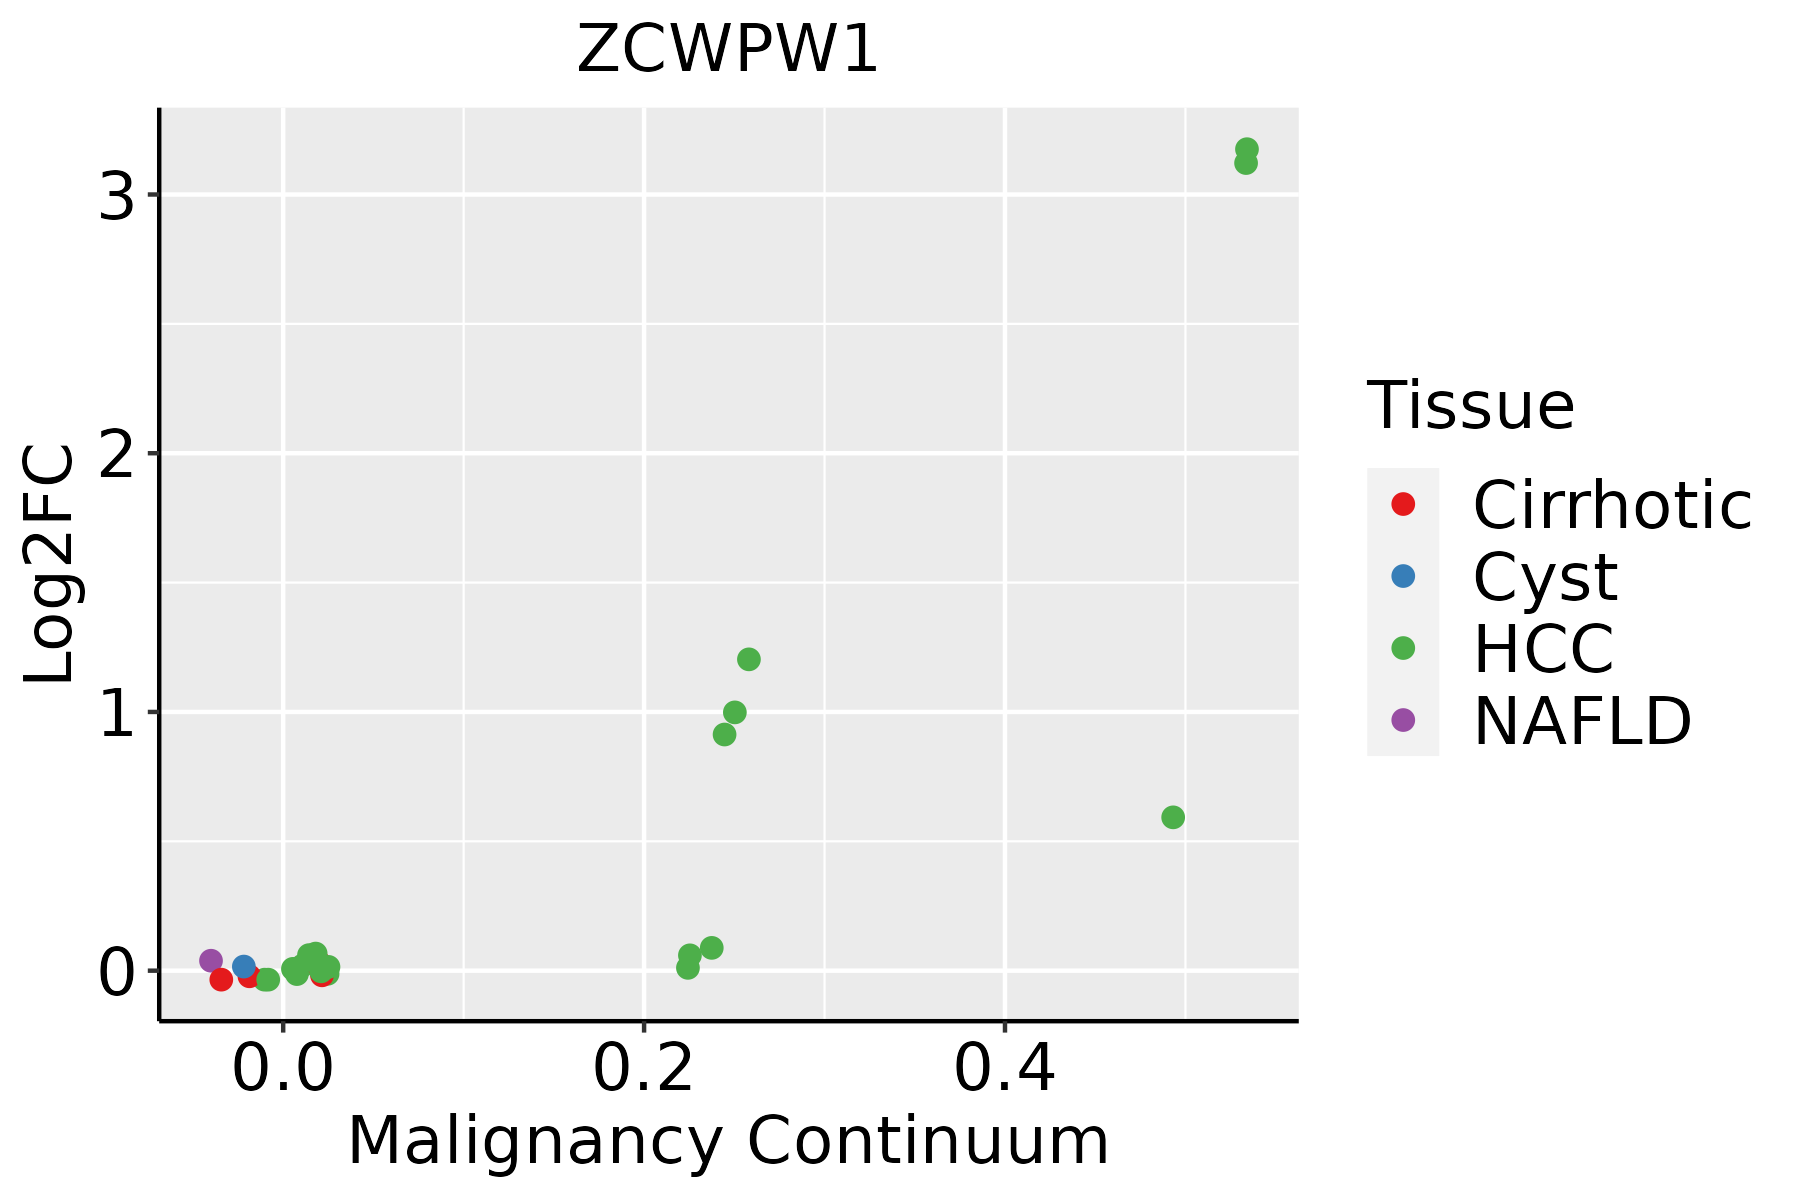 | HCC: Hepatocellular carcinoma |
| NAFLD: Non-alcoholic fatty liver disease | ||
| Oral Cavity | 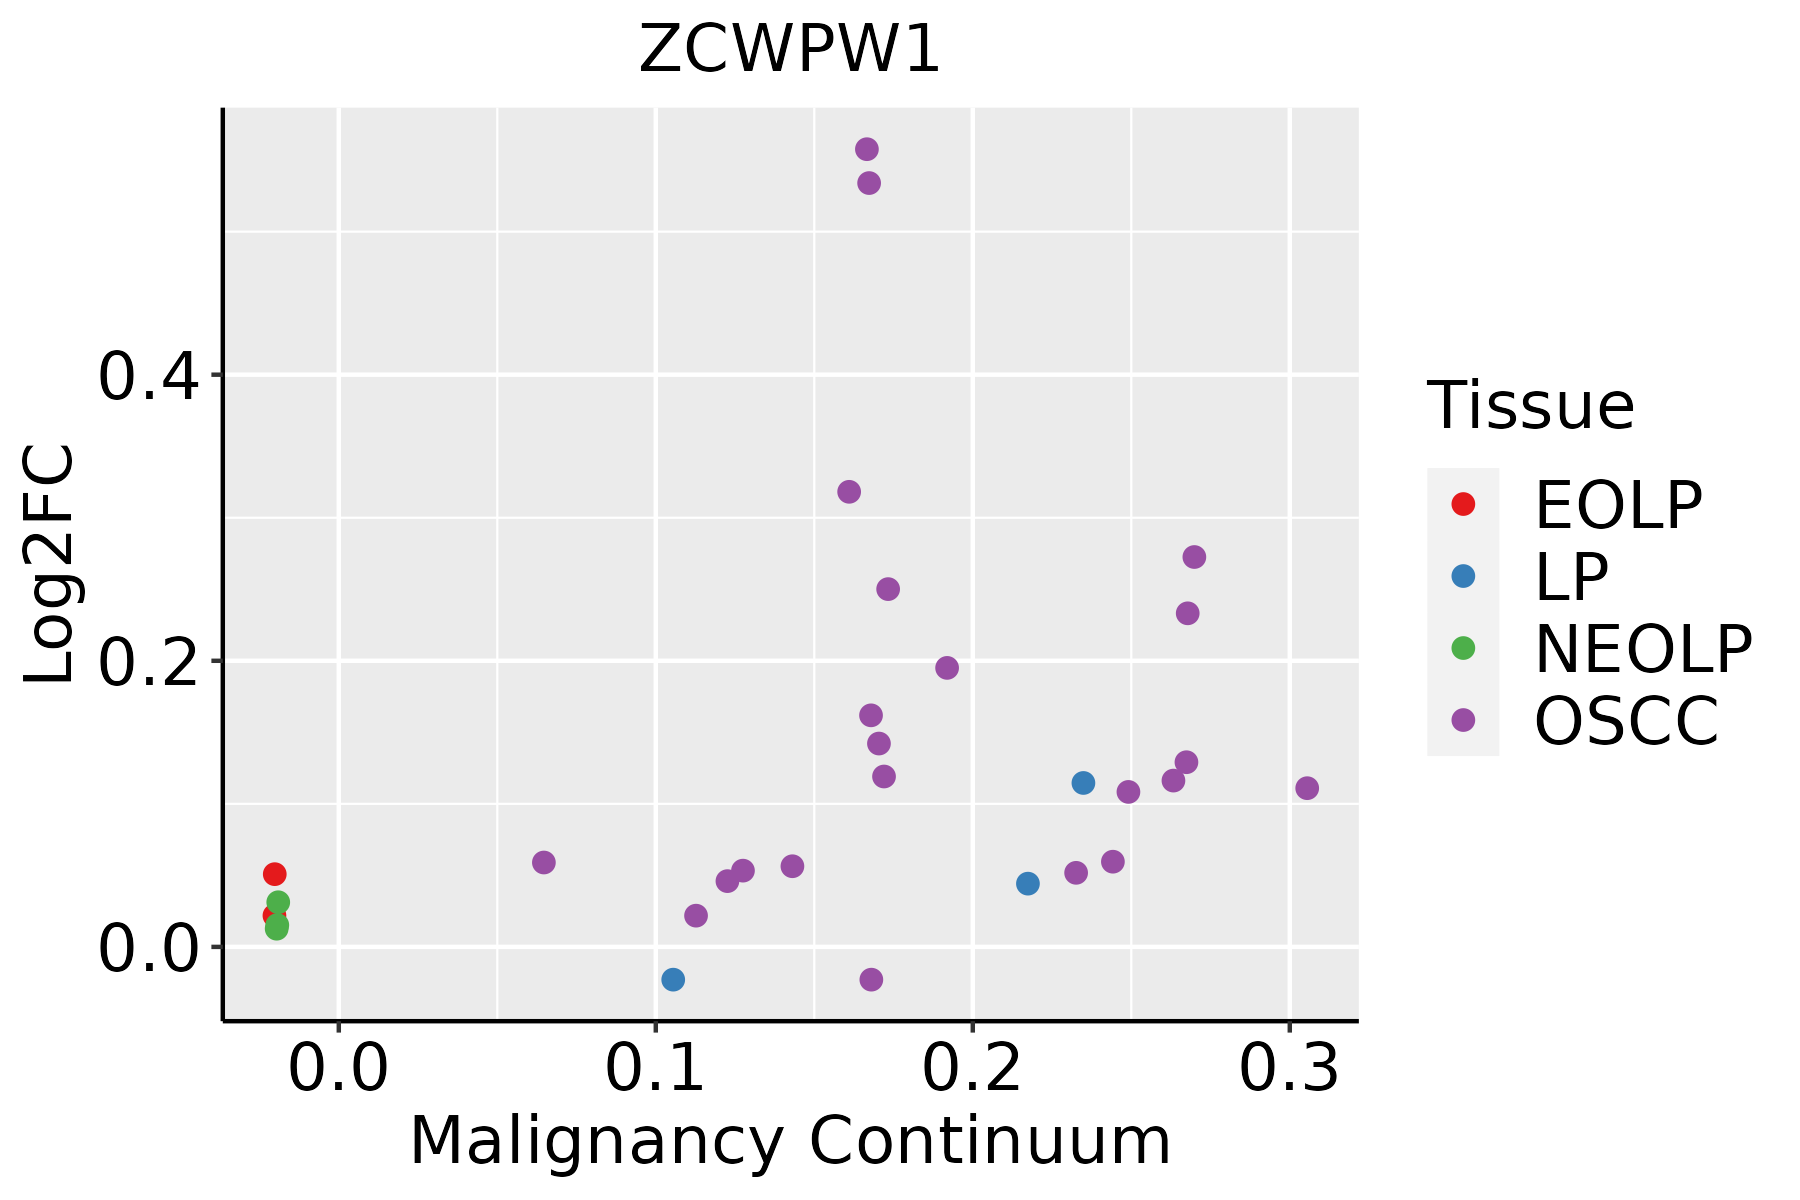 | EOLP: Erosive Oral lichen planus |
| LP: leukoplakia | ||
| NEOLP: Non-erosive oral lichen planus | ||
| OSCC: Oral squamous cell carcinoma |
| ∗log2FC in expression of this searched gene in stem-like cells from each diseased tissue sample relative to stem-like cells in normal samples in each tissue plotted against the malignancy continuum. Samples are colored based on if they are from different disease stage. |
Top |
Malignant transformation related pathway analysis |
| Find out the enriched GO biological processes and KEGG pathways involved in transition from healthy to precancer to cancer |
| Tissue | Disease Stage | Enriched GO biological Processes |
| Colorectum | AD |  |
| Colorectum | SER |  |
| Colorectum | MSS |  |
| Colorectum | MSI-H |  |
| Colorectum | FAP |  |
| ∗Top 15 enriched GO BP terms are showed in the bar plot of each disease state in each tissue. Each row represents a significant GO biological process which is colored according to the -log10(p.adjust). |
| Page: 1 2 3 4 5 6 7 8 9 |
| GO ID | Tissue | Disease Stage | Description | Gene Ratio | Bg Ratio | pvalue | p.adjust | Count |
| GO:0007059 | Liver | HCC | chromosome segregation | 197/7958 | 346/18723 | 3.57e-08 | 7.87e-07 | 197 |
| GO:005105221 | Liver | HCC | regulation of DNA metabolic process | 198/7958 | 359/18723 | 7.62e-07 | 1.17e-05 | 198 |
| GO:200102021 | Liver | HCC | regulation of response to DNA damage stimulus | 128/7958 | 219/18723 | 1.31e-06 | 1.90e-05 | 128 |
| GO:0098813 | Liver | HCC | nuclear chromosome segregation | 157/7958 | 281/18723 | 3.82e-06 | 4.95e-05 | 157 |
| GO:0048285 | Liver | HCC | organelle fission | 254/7958 | 488/18723 | 1.07e-05 | 1.23e-04 | 254 |
| GO:005105411 | Liver | HCC | positive regulation of DNA metabolic process | 113/7958 | 201/18723 | 5.76e-05 | 5.33e-04 | 113 |
| GO:200102211 | Liver | HCC | positive regulation of response to DNA damage stimulus | 64/7958 | 105/18723 | 1.03e-04 | 8.88e-04 | 64 |
| GO:00062824 | Liver | HCC | regulation of DNA repair | 74/7958 | 130/18723 | 6.27e-04 | 3.89e-03 | 74 |
| GO:0000280 | Liver | HCC | nuclear division | 220/7958 | 439/18723 | 6.90e-04 | 4.25e-03 | 220 |
| GO:00063021 | Liver | HCC | double-strand break repair | 131/7958 | 251/18723 | 1.17e-03 | 6.54e-03 | 131 |
| GO:00457393 | Liver | HCC | positive regulation of DNA repair | 43/7958 | 73/18723 | 3.43e-03 | 1.55e-02 | 43 |
| GO:2000779 | Liver | HCC | regulation of double-strand break repair | 47/7958 | 85/18723 | 1.17e-02 | 4.28e-02 | 47 |
| GO:00070592 | Oral cavity | OSCC | chromosome segregation | 206/7305 | 346/18723 | 5.82e-15 | 3.76e-13 | 206 |
| GO:005105210 | Oral cavity | OSCC | regulation of DNA metabolic process | 207/7305 | 359/18723 | 4.45e-13 | 2.17e-11 | 207 |
| GO:00482852 | Oral cavity | OSCC | organelle fission | 265/7305 | 488/18723 | 3.22e-12 | 1.27e-10 | 265 |
| GO:005105414 | Oral cavity | OSCC | positive regulation of DNA metabolic process | 126/7305 | 201/18723 | 8.12e-12 | 3.01e-10 | 126 |
| GO:00002801 | Oral cavity | OSCC | nuclear division | 237/7305 | 439/18723 | 9.62e-11 | 2.90e-09 | 237 |
| GO:00988132 | Oral cavity | OSCC | nuclear chromosome segregation | 162/7305 | 281/18723 | 1.56e-10 | 4.56e-09 | 162 |
| GO:200102017 | Oral cavity | OSCC | regulation of response to DNA damage stimulus | 131/7305 | 219/18723 | 3.21e-10 | 8.72e-09 | 131 |
| GO:00063023 | Oral cavity | OSCC | double-strand break repair | 132/7305 | 251/18723 | 7.93e-06 | 8.52e-05 | 132 |
| Page: 1 2 |
| Pathway ID | Tissue | Disease Stage | Description | Gene Ratio | Bg Ratio | pvalue | p.adjust | qvalue | Count |
| Page: 1 |
Top |
Cell-cell communication analysis |
| Identification of potential cell-cell interactions between two cell types and their ligand-receptor pairs for different disease states |
| Ligand | Receptor | LRpair | Pathway | Tissue | Disease Stage |
| Page: 1 |
Top |
Single-cell gene regulatory network inference analysis |
| Find out the significant the regulons (TFs) and the target genes of each regulon across cell types for different disease states |
| TF | Cell Type | Tissue | Disease Stage | Target Gene | RSS | Regulon Activity |
| ∗The dot plots of a searched regulon are shown for all cell subpopulations in each disease state of each tissue based on the regulon specific score inferred using pySCENIC and by calculating the average expression. |
| Page: 1 |
Top |
Somatic mutation of malignant transformation related genes |
| Annotation of somatic variants for genes involved in malignant transformation |
| Hugo Symbol | Variant Class | Variant Classification | dbSNP RS | HGVSc | HGVSp | HGVSp Short | SWISSPROT | BIOTYPE | SIFT | PolyPhen | Tumor Sample Barcode | Tissue | Histology | Sex | Age | Stage | Therapy Types | Drugs | Outcome |
| ZCWPW1 | SNV | Missense_Mutation | c.334N>G | p.Leu112Val | p.L112V | Q9H0M4 | protein_coding | deleterious(0) | probably_damaging(0.991) | TCGA-A8-A09G-01 | Breast | breast invasive carcinoma | Female | >=65 | III/IV | Unknown | Unknown | SD | |
| ZCWPW1 | SNV | Missense_Mutation | novel | c.1002N>A | p.Met334Ile | p.M334I | Q9H0M4 | protein_coding | tolerated(0.15) | possibly_damaging(0.699) | TCGA-AC-A5XS-01 | Breast | breast invasive carcinoma | Female | >=65 | I/II | Hormone Therapy | femara | SD |
| ZCWPW1 | SNV | Missense_Mutation | novel | c.1556C>T | p.Ser519Phe | p.S519F | Q9H0M4 | protein_coding | deleterious(0) | benign(0.387) | TCGA-AN-A046-01 | Breast | breast invasive carcinoma | Female | >=65 | I/II | Unknown | Unknown | SD |
| ZCWPW1 | SNV | Missense_Mutation | c.1103C>A | p.Ser368Tyr | p.S368Y | Q9H0M4 | protein_coding | deleterious(0) | probably_damaging(0.997) | TCGA-AN-A046-01 | Breast | breast invasive carcinoma | Female | >=65 | I/II | Unknown | Unknown | SD | |
| ZCWPW1 | SNV | Missense_Mutation | novel | c.55T>G | p.Phe19Val | p.F19V | Q9H0M4 | protein_coding | deleterious(0) | possibly_damaging(0.573) | TCGA-AN-A046-01 | Breast | breast invasive carcinoma | Female | >=65 | I/II | Unknown | Unknown | SD |
| ZCWPW1 | SNV | Missense_Mutation | c.759N>G | p.Cys253Trp | p.C253W | Q9H0M4 | protein_coding | deleterious(0.03) | benign(0.43) | TCGA-AR-A251-01 | Breast | breast invasive carcinoma | Female | <65 | III/IV | Chemotherapy | doxorubicin | SD | |
| ZCWPW1 | SNV | Missense_Mutation | c.593N>A | p.Ser198Tyr | p.S198Y | Q9H0M4 | protein_coding | tolerated(0.39) | benign(0.084) | TCGA-B6-A0IJ-01 | Breast | breast invasive carcinoma | Female | <65 | I/II | Unknown | Unknown | SD | |
| ZCWPW1 | SNV | Missense_Mutation | novel | c.548C>T | p.Thr183Ile | p.T183I | Q9H0M4 | protein_coding | deleterious(0.03) | benign(0.007) | TCGA-BH-A2L8-01 | Breast | breast invasive carcinoma | Female | <65 | I/II | Chemotherapy | cytoxan | CR |
| ZCWPW1 | SNV | Missense_Mutation | rs763310132 | c.1621C>T | p.Pro541Ser | p.P541S | Q9H0M4 | protein_coding | tolerated(0.06) | benign(0.021) | TCGA-D8-A1J8-01 | Breast | breast invasive carcinoma | Female | >=65 | I/II | Hormone Therapy | nolvadex | SD |
| ZCWPW1 | SNV | Missense_Mutation | c.1801A>G | p.Ser601Gly | p.S601G | Q9H0M4 | protein_coding | deleterious(0.02) | benign(0.058) | TCGA-D8-A1XK-01 | Breast | breast invasive carcinoma | Female | <65 | I/II | Chemotherapy | doxorubicine+cyclophosphamide | SD |
| Page: 1 2 3 4 5 6 |
Top |
Related drugs of malignant transformation related genes |
| Identification of chemicals and drugs interact with genes involved in malignant transfromation |
| (DGIdb 4.0) |
| Entrez ID | Symbol | Category | Interaction Types | Drug Claim Name | Drug Name | PMIDs |
| Page: 1 |

Copyright 2023-Present -The University of Texas Health Science Center at Houston |