
|
|||||
|
 | |
| |
| |
| |
| |
| |
|
Gene: ZCRB1 |
Gene summary for ZCRB1 |
| Gene information | Species | Human | Gene symbol | ZCRB1 | Gene ID | 85437 |
| Gene name | zinc finger CCHC-type and RNA binding motif containing 1 | |
| Gene Alias | MADP-1 | |
| Cytomap | 12q12 | |
| Gene Type | protein-coding | GO ID | GO:0000375 | UniProtAcc | A0A024R106 |
Top |
Malignant transformation analysis |
| Identification of the aberrant gene expression in precancerous and cancerous lesions by comparing the gene expression of stem-like cells in diseased tissues with normal stem cells |
| Entrez ID | Symbol | Replicates | Species | Organ | Tissue | Adj P-value | Log2FC | Malignancy |
| 85437 | ZCRB1 | HTA11_78_2000001011 | Human | Colorectum | AD | 4.77e-06 | 2.86e-01 | -0.1088 |
| 85437 | ZCRB1 | HTA11_347_2000001011 | Human | Colorectum | AD | 3.76e-05 | 2.82e-01 | -0.1954 |
| 85437 | ZCRB1 | HTA11_696_2000001011 | Human | Colorectum | AD | 1.12e-04 | 2.32e-01 | -0.1464 |
| 85437 | ZCRB1 | HTA11_99999965062_69753 | Human | Colorectum | MSI-H | 3.18e-03 | 7.00e-01 | 0.3487 |
| 85437 | ZCRB1 | HTA11_99999971662_82457 | Human | Colorectum | MSS | 3.83e-09 | 3.58e-01 | 0.3859 |
| 85437 | ZCRB1 | HTA11_99999973899_84307 | Human | Colorectum | MSS | 8.08e-03 | 3.08e-01 | 0.2585 |
| 85437 | ZCRB1 | AEH-subject1 | Human | Endometrium | AEH | 2.84e-12 | -3.43e-01 | -0.3059 |
| 85437 | ZCRB1 | AEH-subject2 | Human | Endometrium | AEH | 4.66e-10 | -3.26e-01 | -0.2525 |
| 85437 | ZCRB1 | AEH-subject3 | Human | Endometrium | AEH | 9.81e-11 | -3.74e-01 | -0.2576 |
| 85437 | ZCRB1 | AEH-subject4 | Human | Endometrium | AEH | 9.71e-10 | -3.84e-01 | -0.2657 |
| 85437 | ZCRB1 | EEC-subject1 | Human | Endometrium | EEC | 5.47e-11 | -3.74e-01 | -0.2682 |
| 85437 | ZCRB1 | EEC-subject2 | Human | Endometrium | EEC | 1.56e-17 | -4.61e-01 | -0.2607 |
| 85437 | ZCRB1 | EEC-subject3 | Human | Endometrium | EEC | 5.84e-39 | -4.23e-01 | -0.2525 |
| 85437 | ZCRB1 | EEC-subject4 | Human | Endometrium | EEC | 2.03e-02 | -2.40e-01 | -0.2571 |
| 85437 | ZCRB1 | EEC-subject5 | Human | Endometrium | EEC | 1.49e-05 | -2.58e-01 | -0.249 |
| 85437 | ZCRB1 | GSM5276934 | Human | Endometrium | EEC | 1.35e-19 | -4.50e-01 | -0.0913 |
| 85437 | ZCRB1 | GSM5276937 | Human | Endometrium | EEC | 1.14e-04 | -3.09e-01 | -0.0897 |
| 85437 | ZCRB1 | GSM6177620_NYU_UCEC1_lib1_lib1 | Human | Endometrium | EEC | 4.56e-29 | -2.38e-01 | -0.1869 |
| 85437 | ZCRB1 | GSM6177620_NYU_UCEC1_lib2_lib2 | Human | Endometrium | EEC | 6.24e-24 | -2.41e-01 | -0.1875 |
| 85437 | ZCRB1 | GSM6177620_NYU_UCEC1_lib3_lib3 | Human | Endometrium | EEC | 1.88e-29 | -2.27e-01 | -0.1883 |
| Page: 1 2 3 4 5 6 7 8 |
| Tissue | Expression Dynamics | Abbreviation |
| Colorectum (GSE201348) | 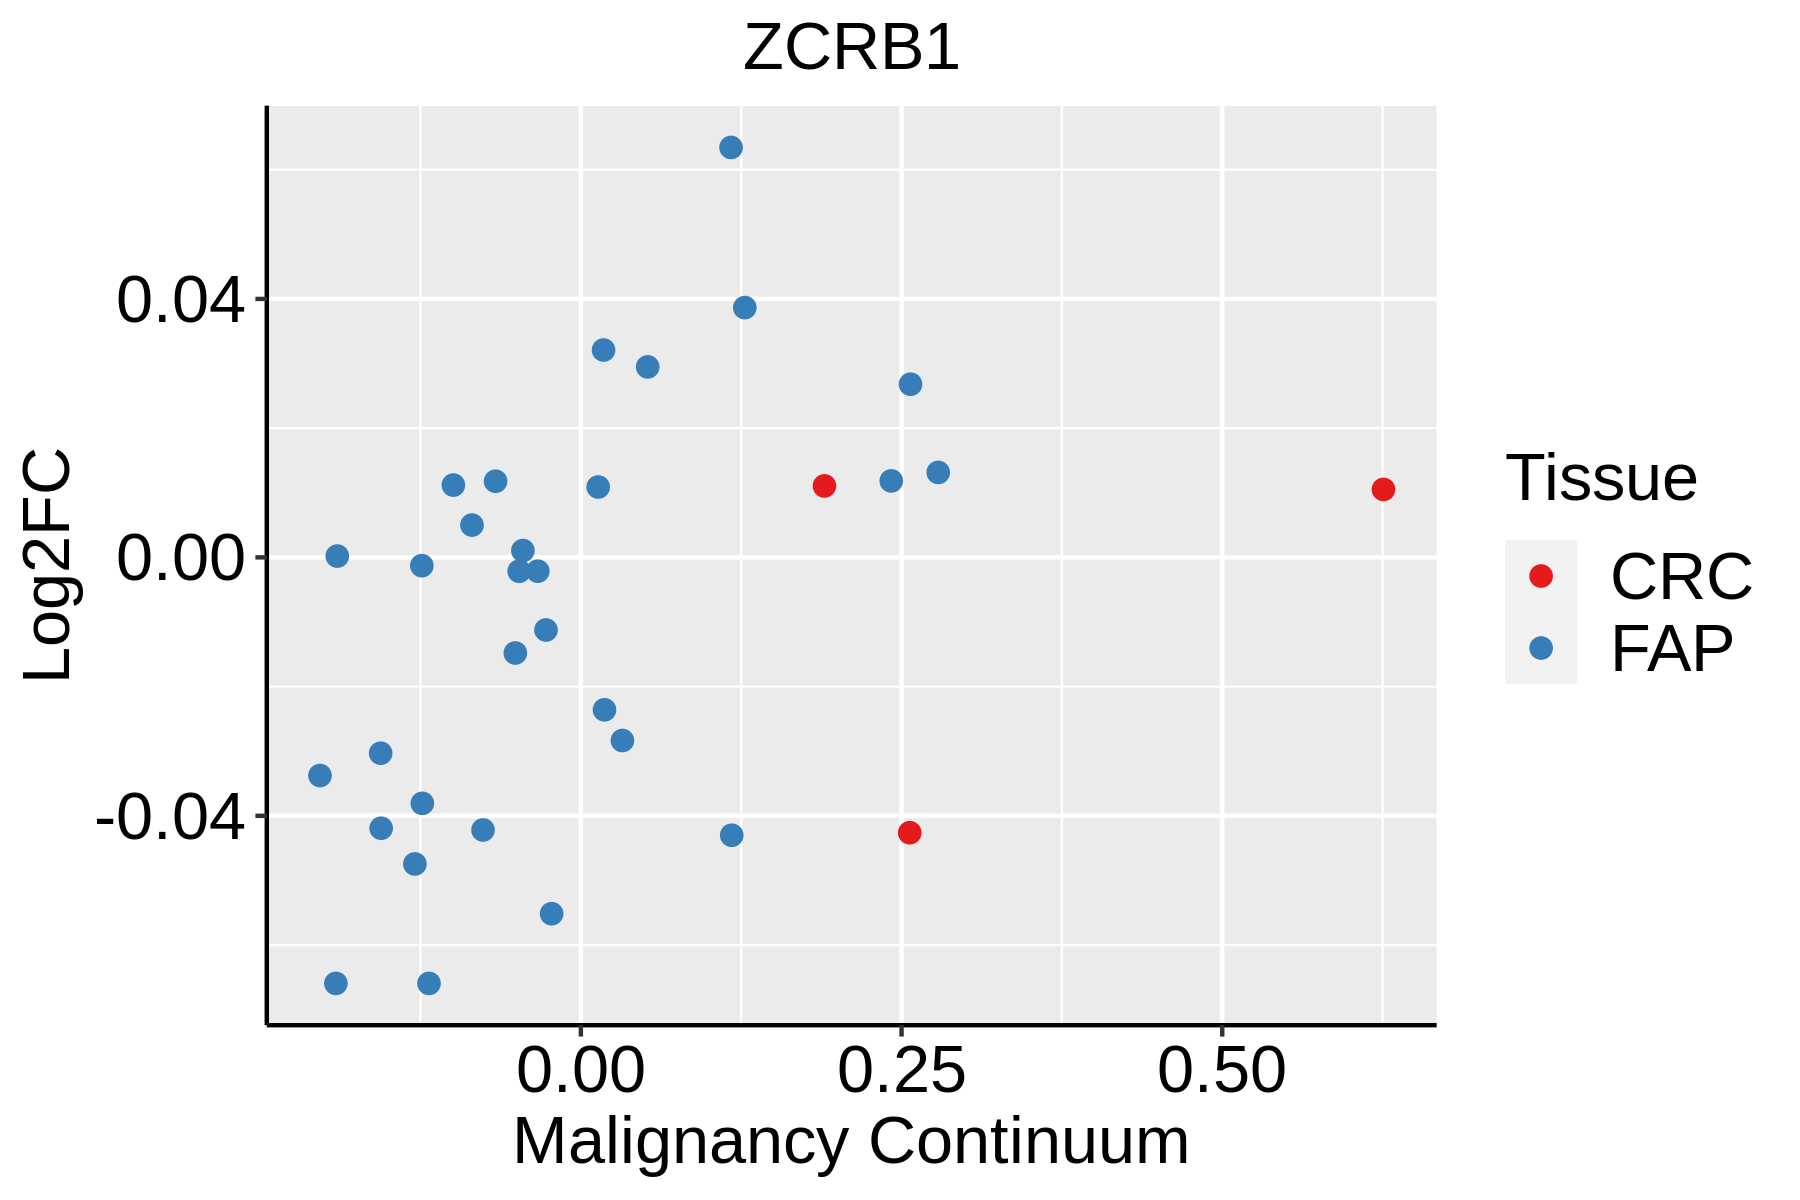 | FAP: Familial adenomatous polyposis |
| CRC: Colorectal cancer | ||
| Colorectum (HTA11) |  | AD: Adenomas |
| SER: Sessile serrated lesions | ||
| MSI-H: Microsatellite-high colorectal cancer | ||
| MSS: Microsatellite stable colorectal cancer | ||
| Endometrium |  | AEH: Atypical endometrial hyperplasia |
| EEC: Endometrioid Cancer | ||
| Esophagus |  | ESCC: Esophageal squamous cell carcinoma |
| HGIN: High-grade intraepithelial neoplasias | ||
| LGIN: Low-grade intraepithelial neoplasias | ||
| Liver | 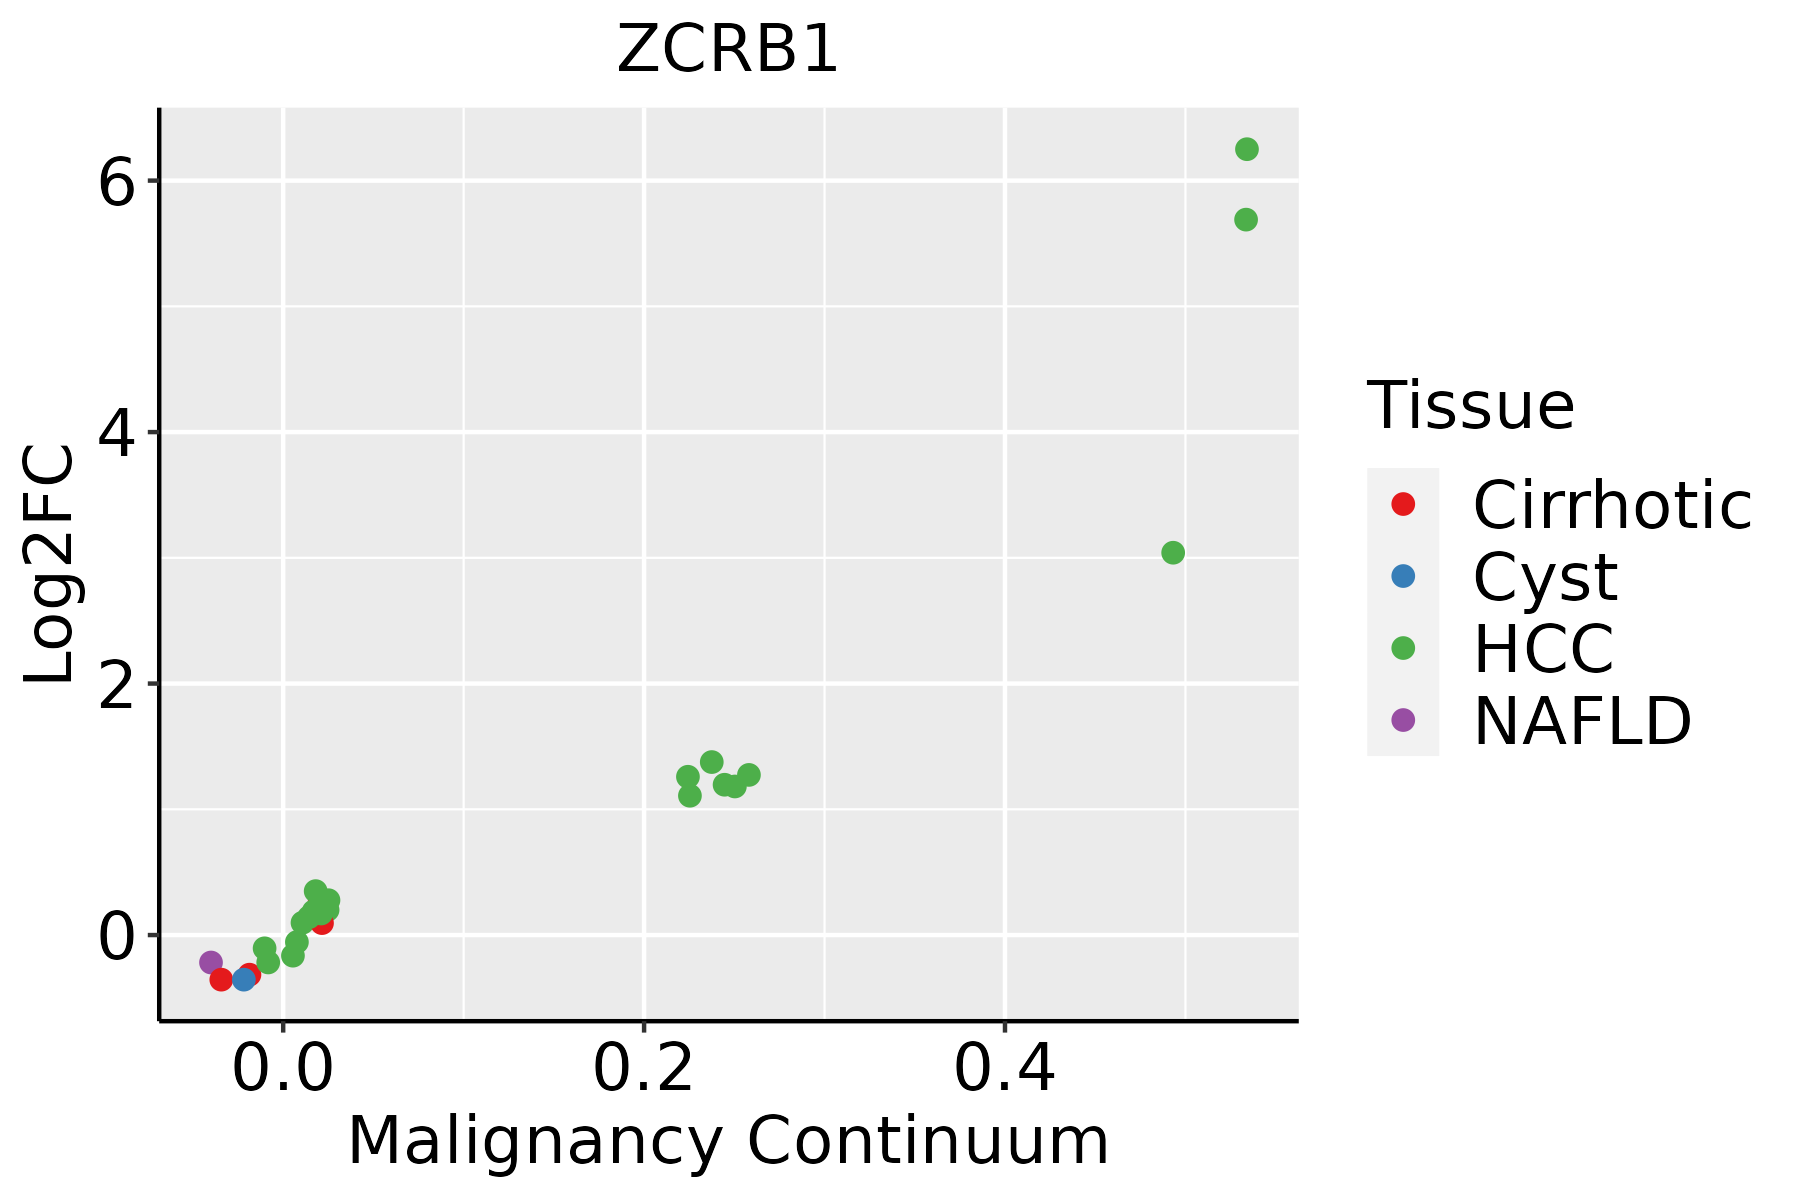 | HCC: Hepatocellular carcinoma |
| NAFLD: Non-alcoholic fatty liver disease | ||
| Oral Cavity | 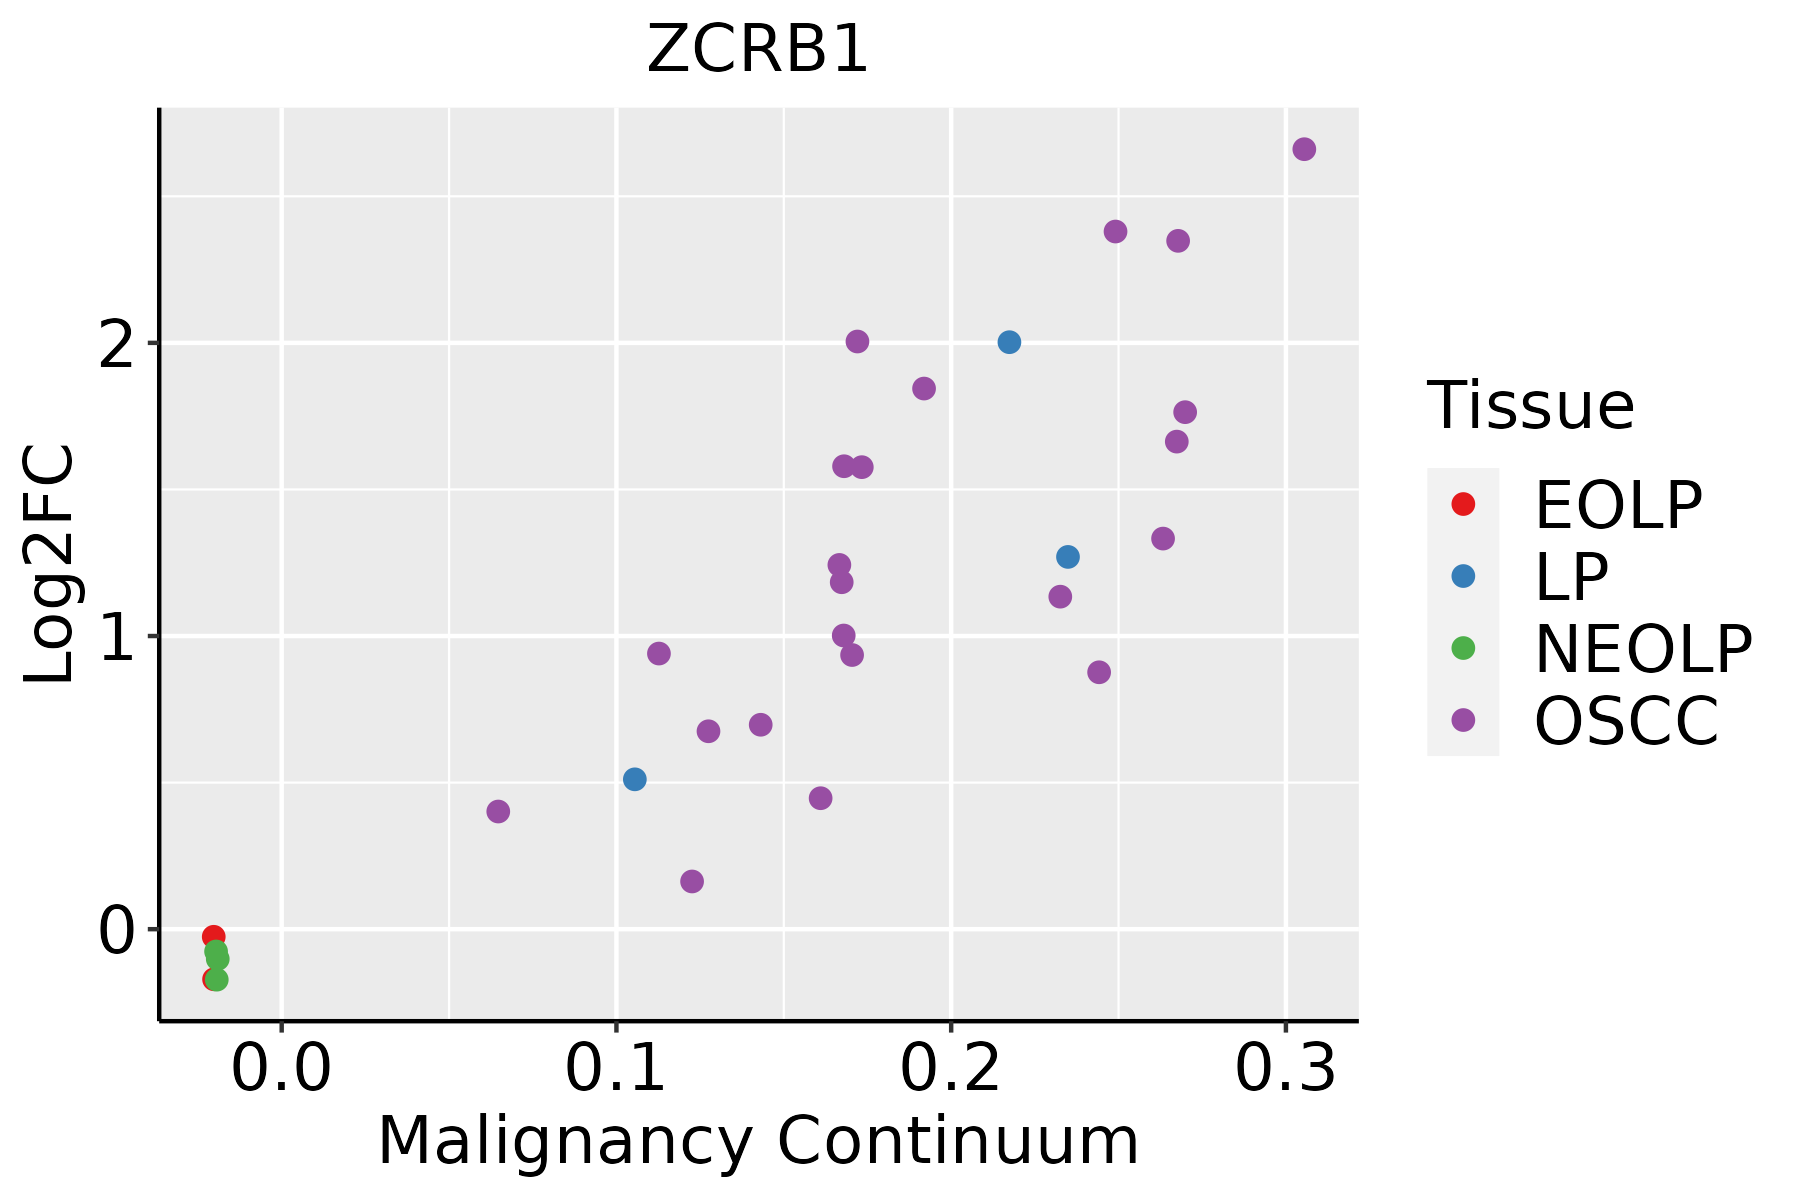 | EOLP: Erosive Oral lichen planus |
| LP: leukoplakia | ||
| NEOLP: Non-erosive oral lichen planus | ||
| OSCC: Oral squamous cell carcinoma | ||
| Prostate | 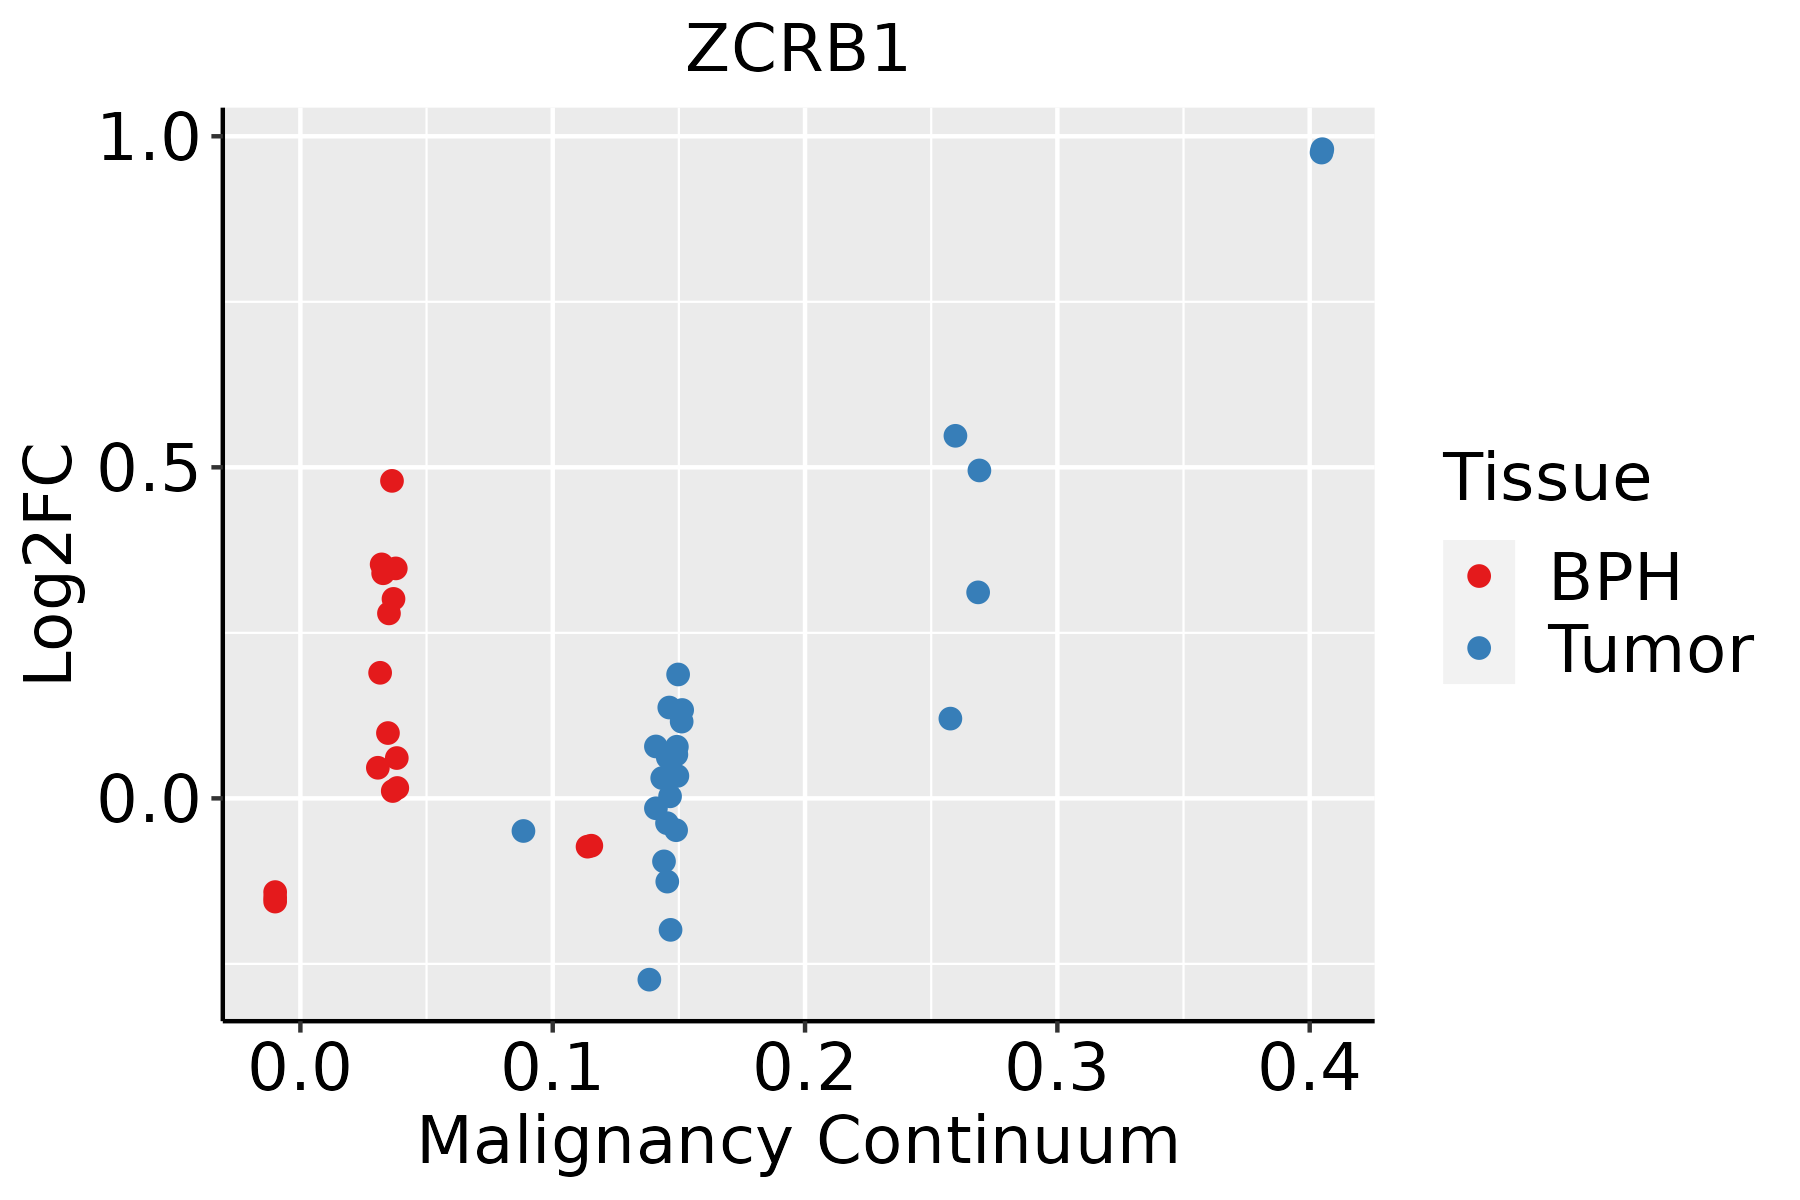 | BPH: Benign Prostatic Hyperplasia |
| Skin |  | AK: Actinic keratosis |
| cSCC: Cutaneous squamous cell carcinoma | ||
| SCCIS:squamous cell carcinoma in situ | ||
| Thyroid | 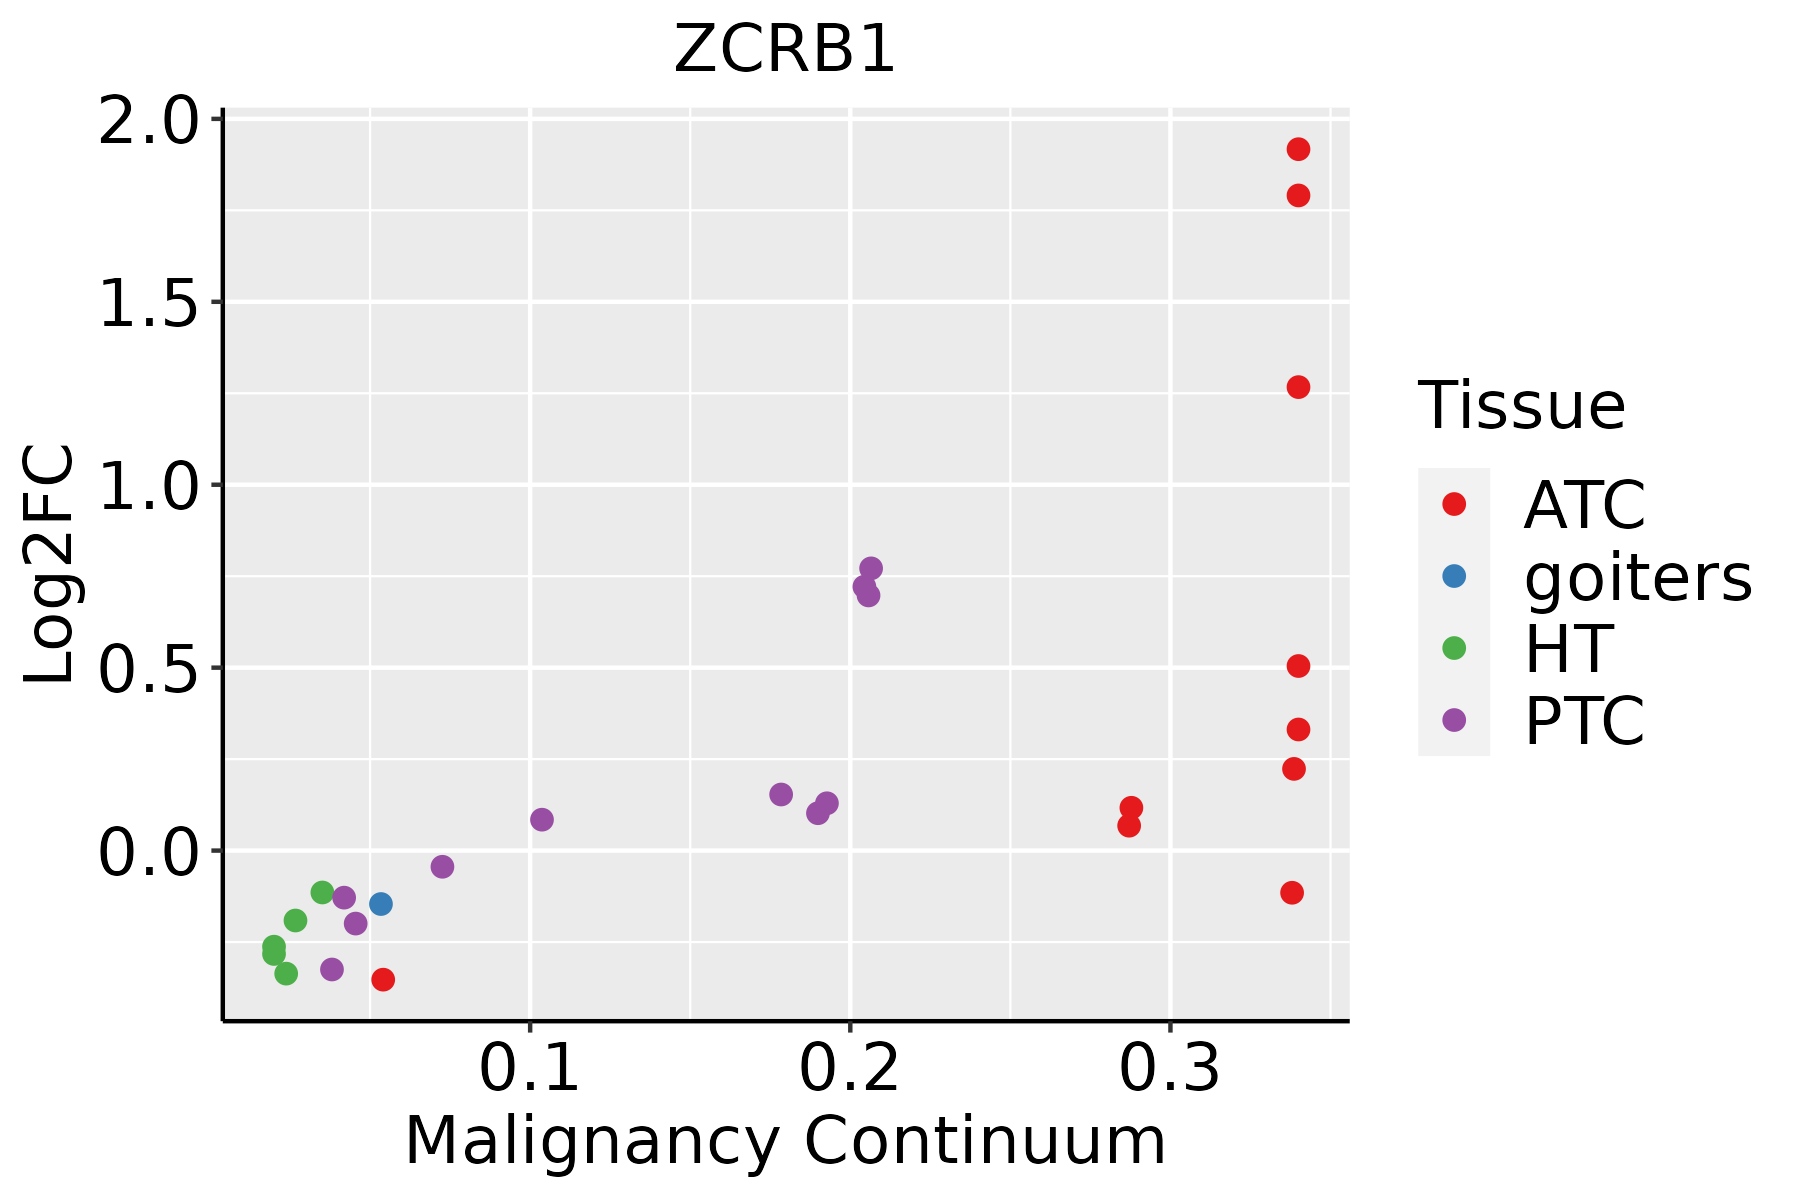 | ATC: Anaplastic thyroid cancer |
| HT: Hashimoto's thyroiditis | ||
| PTC: Papillary thyroid cancer |
| ∗log2FC in expression of this searched gene in stem-like cells from each diseased tissue sample relative to stem-like cells in normal samples in each tissue plotted against the malignancy continuum. Samples are colored based on if they are from different disease stage. |
Top |
Malignant transformation related pathway analysis |
| Find out the enriched GO biological processes and KEGG pathways involved in transition from healthy to precancer to cancer |
| Tissue | Disease Stage | Enriched GO biological Processes |
| Colorectum | AD |  |
| Colorectum | SER |  |
| Colorectum | MSS |  |
| Colorectum | MSI-H |  |
| Colorectum | FAP |  |
| ∗Top 15 enriched GO BP terms are showed in the bar plot of each disease state in each tissue. Each row represents a significant GO biological process which is colored according to the -log10(p.adjust). |
| Page: 1 2 3 4 5 6 7 8 9 |
| GO ID | Tissue | Disease Stage | Description | Gene Ratio | Bg Ratio | pvalue | p.adjust | Count |
| GO:0008380 | Colorectum | AD | RNA splicing | 169/3918 | 434/18723 | 3.59e-18 | 2.04e-15 | 169 |
| GO:0000377 | Colorectum | AD | RNA splicing, via transesterification reactions with bulged adenosine as nucleophile | 130/3918 | 320/18723 | 5.88e-16 | 2.16e-13 | 130 |
| GO:0000398 | Colorectum | AD | mRNA splicing, via spliceosome | 130/3918 | 320/18723 | 5.88e-16 | 2.16e-13 | 130 |
| GO:0000375 | Colorectum | AD | RNA splicing, via transesterification reactions | 131/3918 | 324/18723 | 7.11e-16 | 2.22e-13 | 131 |
| GO:00083802 | Colorectum | MSS | RNA splicing | 159/3467 | 434/18723 | 1.75e-19 | 1.22e-16 | 159 |
| GO:00003772 | Colorectum | MSS | RNA splicing, via transesterification reactions with bulged adenosine as nucleophile | 121/3467 | 320/18723 | 2.52e-16 | 8.27e-14 | 121 |
| GO:00003982 | Colorectum | MSS | mRNA splicing, via spliceosome | 121/3467 | 320/18723 | 2.52e-16 | 8.27e-14 | 121 |
| GO:00003752 | Colorectum | MSS | RNA splicing, via transesterification reactions | 122/3467 | 324/18723 | 2.75e-16 | 8.58e-14 | 122 |
| GO:00083803 | Colorectum | MSI-H | RNA splicing | 82/1319 | 434/18723 | 1.22e-16 | 4.53e-14 | 82 |
| GO:00003753 | Colorectum | MSI-H | RNA splicing, via transesterification reactions | 67/1319 | 324/18723 | 7.99e-16 | 2.61e-13 | 67 |
| GO:00003773 | Colorectum | MSI-H | RNA splicing, via transesterification reactions with bulged adenosine as nucleophile | 66/1319 | 320/18723 | 1.51e-15 | 4.41e-13 | 66 |
| GO:00003983 | Colorectum | MSI-H | mRNA splicing, via spliceosome | 66/1319 | 320/18723 | 1.51e-15 | 4.41e-13 | 66 |
| GO:000838016 | Endometrium | AEH | RNA splicing | 111/2100 | 434/18723 | 2.42e-17 | 1.12e-14 | 111 |
| GO:000037515 | Endometrium | AEH | RNA splicing, via transesterification reactions | 88/2100 | 324/18723 | 1.11e-15 | 3.91e-13 | 88 |
| GO:000037715 | Endometrium | AEH | RNA splicing, via transesterification reactions with bulged adenosine as nucleophile | 87/2100 | 320/18723 | 1.51e-15 | 4.78e-13 | 87 |
| GO:000039815 | Endometrium | AEH | mRNA splicing, via spliceosome | 87/2100 | 320/18723 | 1.51e-15 | 4.78e-13 | 87 |
| GO:000838017 | Endometrium | EEC | RNA splicing | 111/2168 | 434/18723 | 2.45e-16 | 1.13e-13 | 111 |
| GO:000037516 | Endometrium | EEC | RNA splicing, via transesterification reactions | 88/2168 | 324/18723 | 7.46e-15 | 2.63e-12 | 88 |
| GO:000037716 | Endometrium | EEC | RNA splicing, via transesterification reactions with bulged adenosine as nucleophile | 87/2168 | 320/18723 | 9.97e-15 | 3.15e-12 | 87 |
| GO:000039816 | Endometrium | EEC | mRNA splicing, via spliceosome | 87/2168 | 320/18723 | 9.97e-15 | 3.15e-12 | 87 |
| Page: 1 2 3 |
| Pathway ID | Tissue | Disease Stage | Description | Gene Ratio | Bg Ratio | pvalue | p.adjust | qvalue | Count |
| Page: 1 |
Top |
Cell-cell communication analysis |
| Identification of potential cell-cell interactions between two cell types and their ligand-receptor pairs for different disease states |
| Ligand | Receptor | LRpair | Pathway | Tissue | Disease Stage |
| Page: 1 |
Top |
Single-cell gene regulatory network inference analysis |
| Find out the significant the regulons (TFs) and the target genes of each regulon across cell types for different disease states |
| TF | Cell Type | Tissue | Disease Stage | Target Gene | RSS | Regulon Activity |
| ∗The dot plots of a searched regulon are shown for all cell subpopulations in each disease state of each tissue based on the regulon specific score inferred using pySCENIC and by calculating the average expression. |
| Page: 1 |
Top |
Somatic mutation of malignant transformation related genes |
| Annotation of somatic variants for genes involved in malignant transformation |
| Hugo Symbol | Variant Class | Variant Classification | dbSNP RS | HGVSc | HGVSp | HGVSp Short | SWISSPROT | BIOTYPE | SIFT | PolyPhen | Tumor Sample Barcode | Tissue | Histology | Sex | Age | Stage | Therapy Types | Drugs | Outcome |
| ZCRB1 | SNV | Missense_Mutation | c.372G>A | p.Met124Ile | p.M124I | Q8TBF4 | protein_coding | tolerated(0.62) | benign(0) | TCGA-AN-A0AK-01 | Breast | breast invasive carcinoma | Female | >=65 | I/II | Unknown | Unknown | SD | |
| ZCRB1 | SNV | Missense_Mutation | c.469G>C | p.Asp157His | p.D157H | Q8TBF4 | protein_coding | deleterious(0.01) | benign(0.259) | TCGA-D8-A27M-01 | Breast | breast invasive carcinoma | Female | <65 | I/II | Chemotherapy | methotrexate+5 | SD | |
| ZCRB1 | SNV | Missense_Mutation | rs768185852 | c.382N>T | p.Arg128Cys | p.R128C | Q8TBF4 | protein_coding | deleterious(0.01) | probably_damaging(0.941) | TCGA-AA-3984-01 | Colorectum | colon adenocarcinoma | Female | <65 | I/II | Unknown | Unknown | SD |
| ZCRB1 | SNV | Missense_Mutation | rs761704622 | c.599N>A | p.Arg200His | p.R200H | Q8TBF4 | protein_coding | deleterious(0.03) | possibly_damaging(0.707) | TCGA-D5-6534-01 | Colorectum | colon adenocarcinoma | Female | <65 | I/II | Unknown | Unknown | SD |
| ZCRB1 | SNV | Missense_Mutation | rs768185852 | c.382N>T | p.Arg128Cys | p.R128C | Q8TBF4 | protein_coding | deleterious(0.01) | probably_damaging(0.941) | TCGA-G4-6320-01 | Colorectum | colon adenocarcinoma | Male | >=65 | III/IV | Chemotherapy | oxaliplatin | SD |
| ZCRB1 | insertion | Frame_Shift_Ins | novel | c.419_420insA | p.Lys141GlufsTer4 | p.K141Efs*4 | Q8TBF4 | protein_coding | TCGA-A6-5661-01 | Colorectum | colon adenocarcinoma | Female | >=65 | I/II | Unknown | Unknown | SD | ||
| ZCRB1 | deletion | Frame_Shift_Del | rs758381772 | c.419delA | p.Lys140ArgfsTer13 | p.K140Rfs*13 | Q8TBF4 | protein_coding | TCGA-AA-3710-01 | Colorectum | colon adenocarcinoma | Female | >=65 | I/II | Unknown | Unknown | SD | ||
| ZCRB1 | deletion | Frame_Shift_Del | rs751992496 | c.552delN | p.Lys184AsnfsTer20 | p.K184Nfs*20 | Q8TBF4 | protein_coding | TCGA-AA-3966-01 | Colorectum | colon adenocarcinoma | Female | >=65 | I/II | Unknown | Unknown | SD | ||
| ZCRB1 | insertion | In_Frame_Ins | novel | c.170_171insCCCCAC | p.Leu57delinsPheProThr | p.L57delinsFPT | Q8TBF4 | protein_coding | TCGA-AM-5820-01 | Colorectum | colon adenocarcinoma | Female | <65 | I/II | Unknown | Unknown | SD | ||
| ZCRB1 | insertion | Frame_Shift_Ins | novel | c.552dupA | p.Trp185MetfsTer13 | p.W185Mfs*13 | Q8TBF4 | protein_coding | TCGA-AZ-6598-01 | Colorectum | colon adenocarcinoma | Female | >=65 | I/II | Unknown | Unknown | SD |
| Page: 1 2 3 4 5 |
Top |
Related drugs of malignant transformation related genes |
| Identification of chemicals and drugs interact with genes involved in malignant transfromation |
| (DGIdb 4.0) |
| Entrez ID | Symbol | Category | Interaction Types | Drug Claim Name | Drug Name | PMIDs |
| Page: 1 |

Copyright 2023-Present -The University of Texas Health Science Center at Houston |