
|
|||||
|
 | |
| |
| |
| |
| |
| |
|
Gene: ZCCHC8 |
Gene summary for ZCCHC8 |
| Gene information | Species | Human | Gene symbol | ZCCHC8 | Gene ID | 55596 |
| Gene name | zinc finger CCHC-type containing 8 | |
| Gene Alias | PFBMFT5 | |
| Cytomap | 12q24.31 | |
| Gene Type | protein-coding | GO ID | GO:0000375 | UniProtAcc | Q6NZY4 |
Top |
Malignant transformation analysis |
| Identification of the aberrant gene expression in precancerous and cancerous lesions by comparing the gene expression of stem-like cells in diseased tissues with normal stem cells |
| Entrez ID | Symbol | Replicates | Species | Organ | Tissue | Adj P-value | Log2FC | Malignancy |
| 55596 | ZCCHC8 | LZE4T | Human | Esophagus | ESCC | 1.82e-11 | 2.61e-01 | 0.0811 |
| 55596 | ZCCHC8 | LZE5T | Human | Esophagus | ESCC | 1.61e-05 | 3.23e-01 | 0.0514 |
| 55596 | ZCCHC8 | LZE7T | Human | Esophagus | ESCC | 9.30e-05 | 3.07e-01 | 0.0667 |
| 55596 | ZCCHC8 | LZE8T | Human | Esophagus | ESCC | 9.75e-07 | 2.45e-01 | 0.067 |
| 55596 | ZCCHC8 | LZE20T | Human | Esophagus | ESCC | 9.77e-08 | 2.39e-01 | 0.0662 |
| 55596 | ZCCHC8 | LZE24T | Human | Esophagus | ESCC | 2.65e-12 | 2.75e-01 | 0.0596 |
| 55596 | ZCCHC8 | LZE21T | Human | Esophagus | ESCC | 5.43e-05 | 2.95e-01 | 0.0655 |
| 55596 | ZCCHC8 | LZE6T | Human | Esophagus | ESCC | 1.13e-03 | 1.58e-01 | 0.0845 |
| 55596 | ZCCHC8 | P1T-E | Human | Esophagus | ESCC | 1.24e-15 | 6.31e-01 | 0.0875 |
| 55596 | ZCCHC8 | P2T-E | Human | Esophagus | ESCC | 1.60e-70 | 1.12e+00 | 0.1177 |
| 55596 | ZCCHC8 | P4T-E | Human | Esophagus | ESCC | 1.92e-21 | 5.47e-01 | 0.1323 |
| 55596 | ZCCHC8 | P5T-E | Human | Esophagus | ESCC | 2.29e-24 | 4.62e-01 | 0.1327 |
| 55596 | ZCCHC8 | P8T-E | Human | Esophagus | ESCC | 8.05e-28 | 4.43e-01 | 0.0889 |
| 55596 | ZCCHC8 | P9T-E | Human | Esophagus | ESCC | 8.35e-14 | 2.46e-01 | 0.1131 |
| 55596 | ZCCHC8 | P10T-E | Human | Esophagus | ESCC | 4.65e-16 | 2.52e-01 | 0.116 |
| 55596 | ZCCHC8 | P11T-E | Human | Esophagus | ESCC | 1.27e-17 | 5.60e-01 | 0.1426 |
| 55596 | ZCCHC8 | P12T-E | Human | Esophagus | ESCC | 8.56e-33 | 4.01e-01 | 0.1122 |
| 55596 | ZCCHC8 | P15T-E | Human | Esophagus | ESCC | 7.40e-24 | 5.28e-01 | 0.1149 |
| 55596 | ZCCHC8 | P16T-E | Human | Esophagus | ESCC | 5.40e-30 | 4.46e-01 | 0.1153 |
| 55596 | ZCCHC8 | P17T-E | Human | Esophagus | ESCC | 2.85e-02 | 2.80e-01 | 0.1278 |
| Page: 1 2 3 4 5 |
| Tissue | Expression Dynamics | Abbreviation |
| Esophagus | 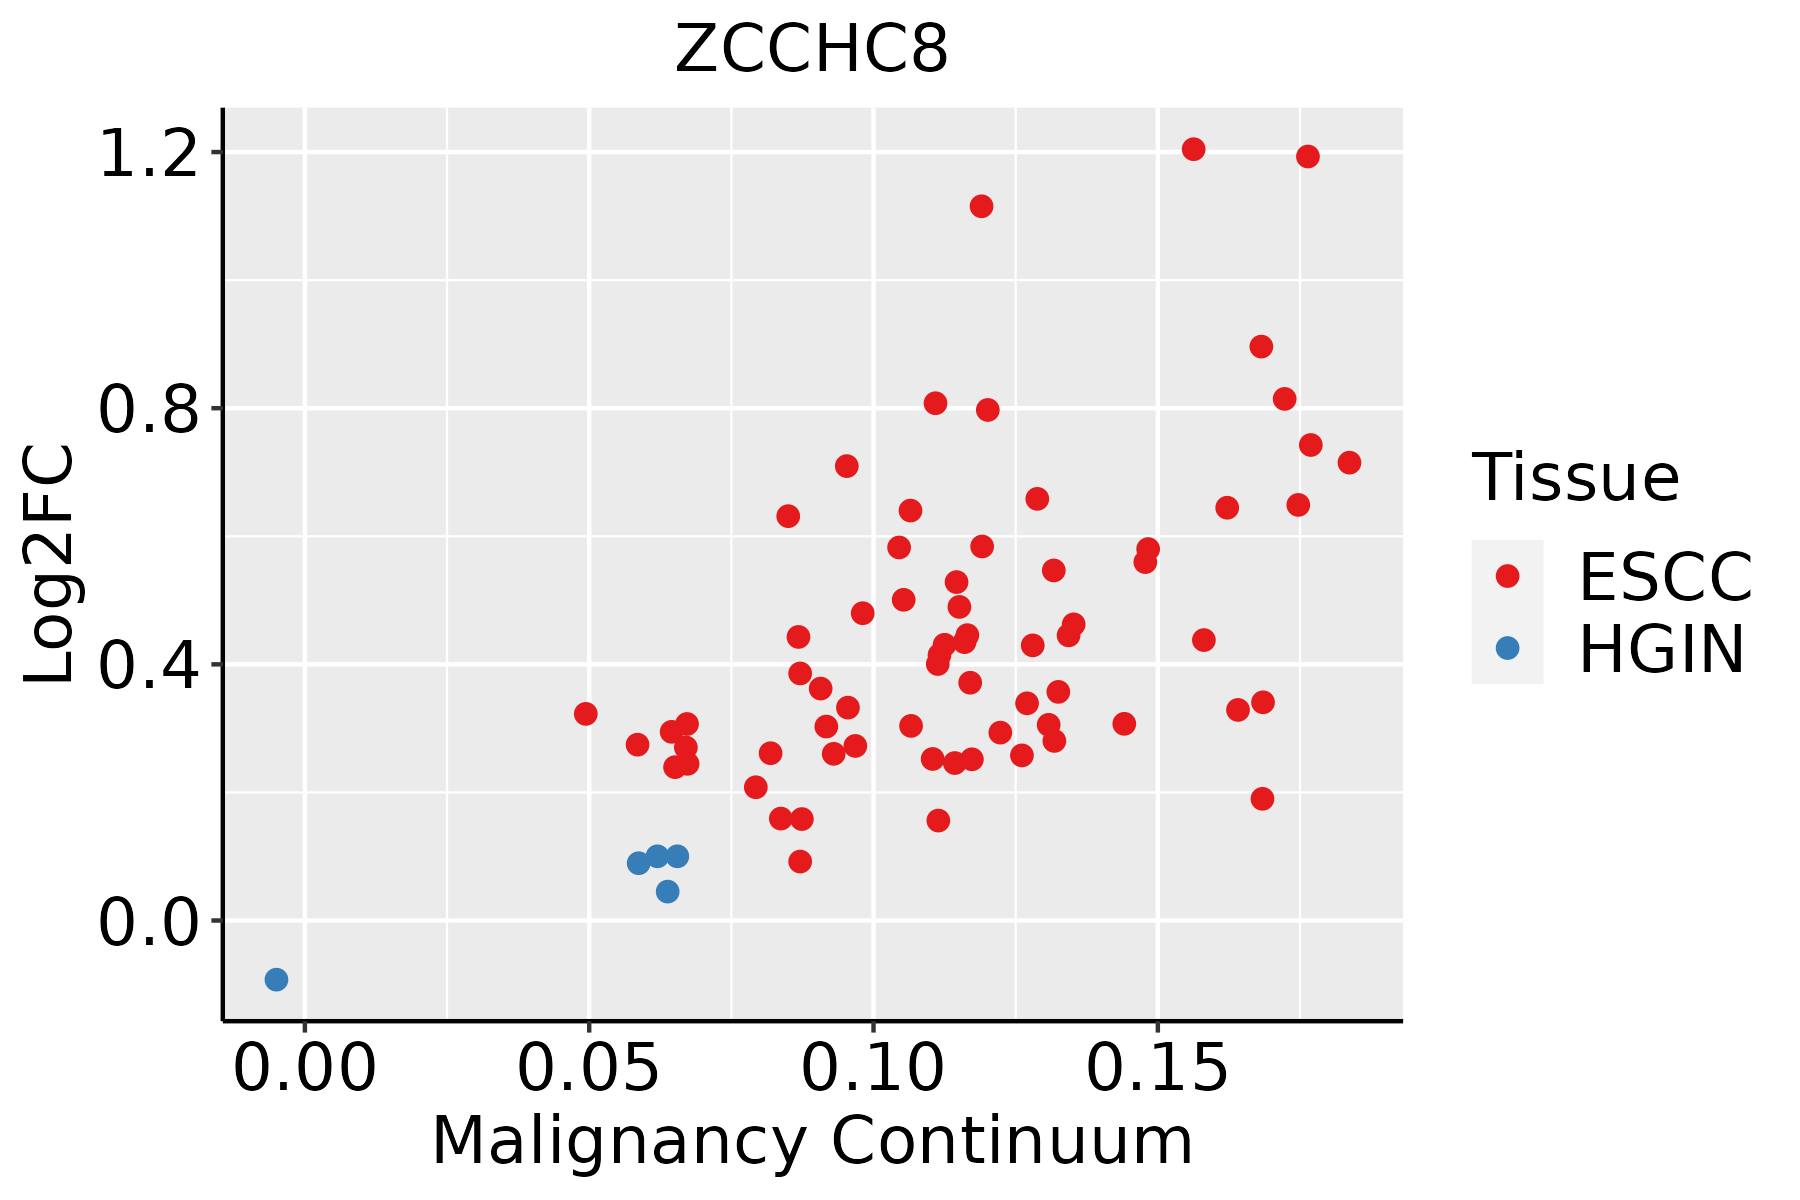 | ESCC: Esophageal squamous cell carcinoma |
| HGIN: High-grade intraepithelial neoplasias | ||
| LGIN: Low-grade intraepithelial neoplasias | ||
| Liver | 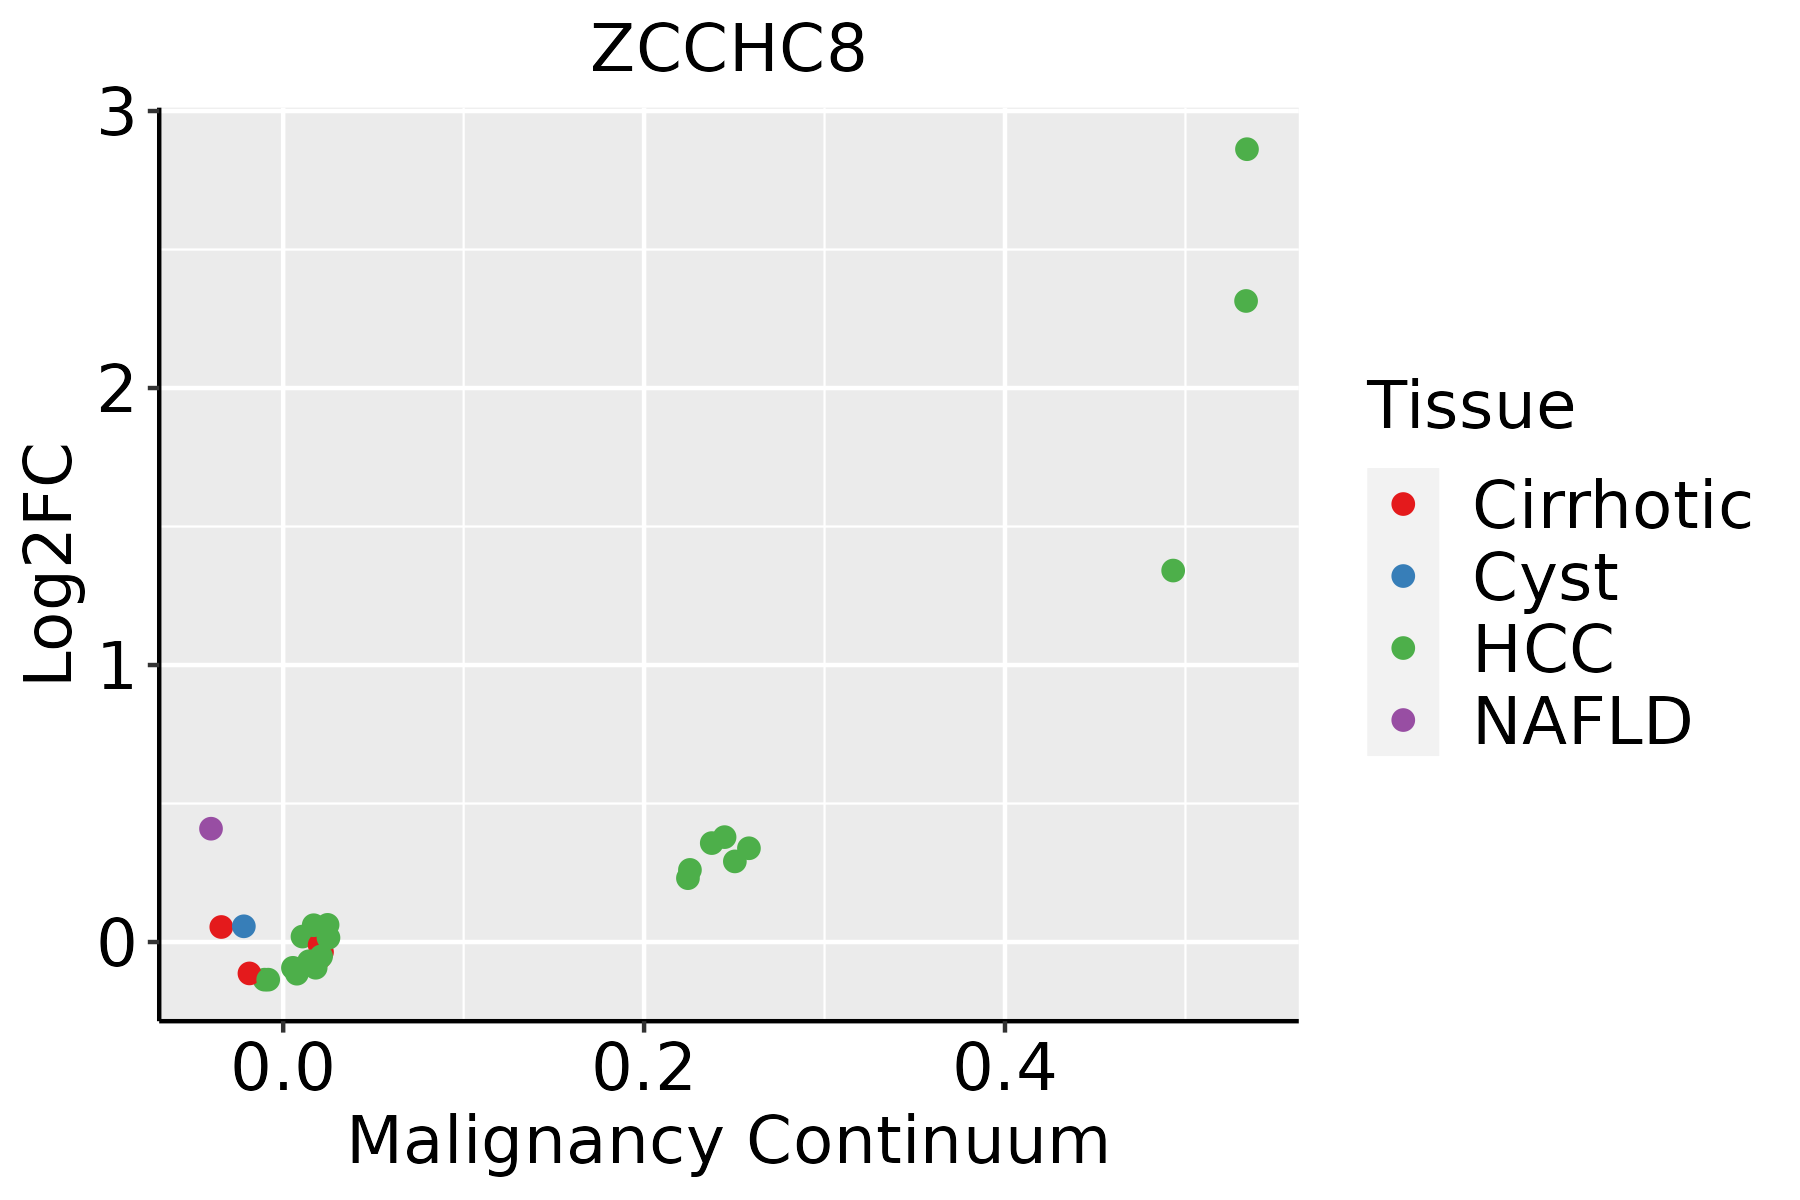 | HCC: Hepatocellular carcinoma |
| NAFLD: Non-alcoholic fatty liver disease | ||
| Oral Cavity | 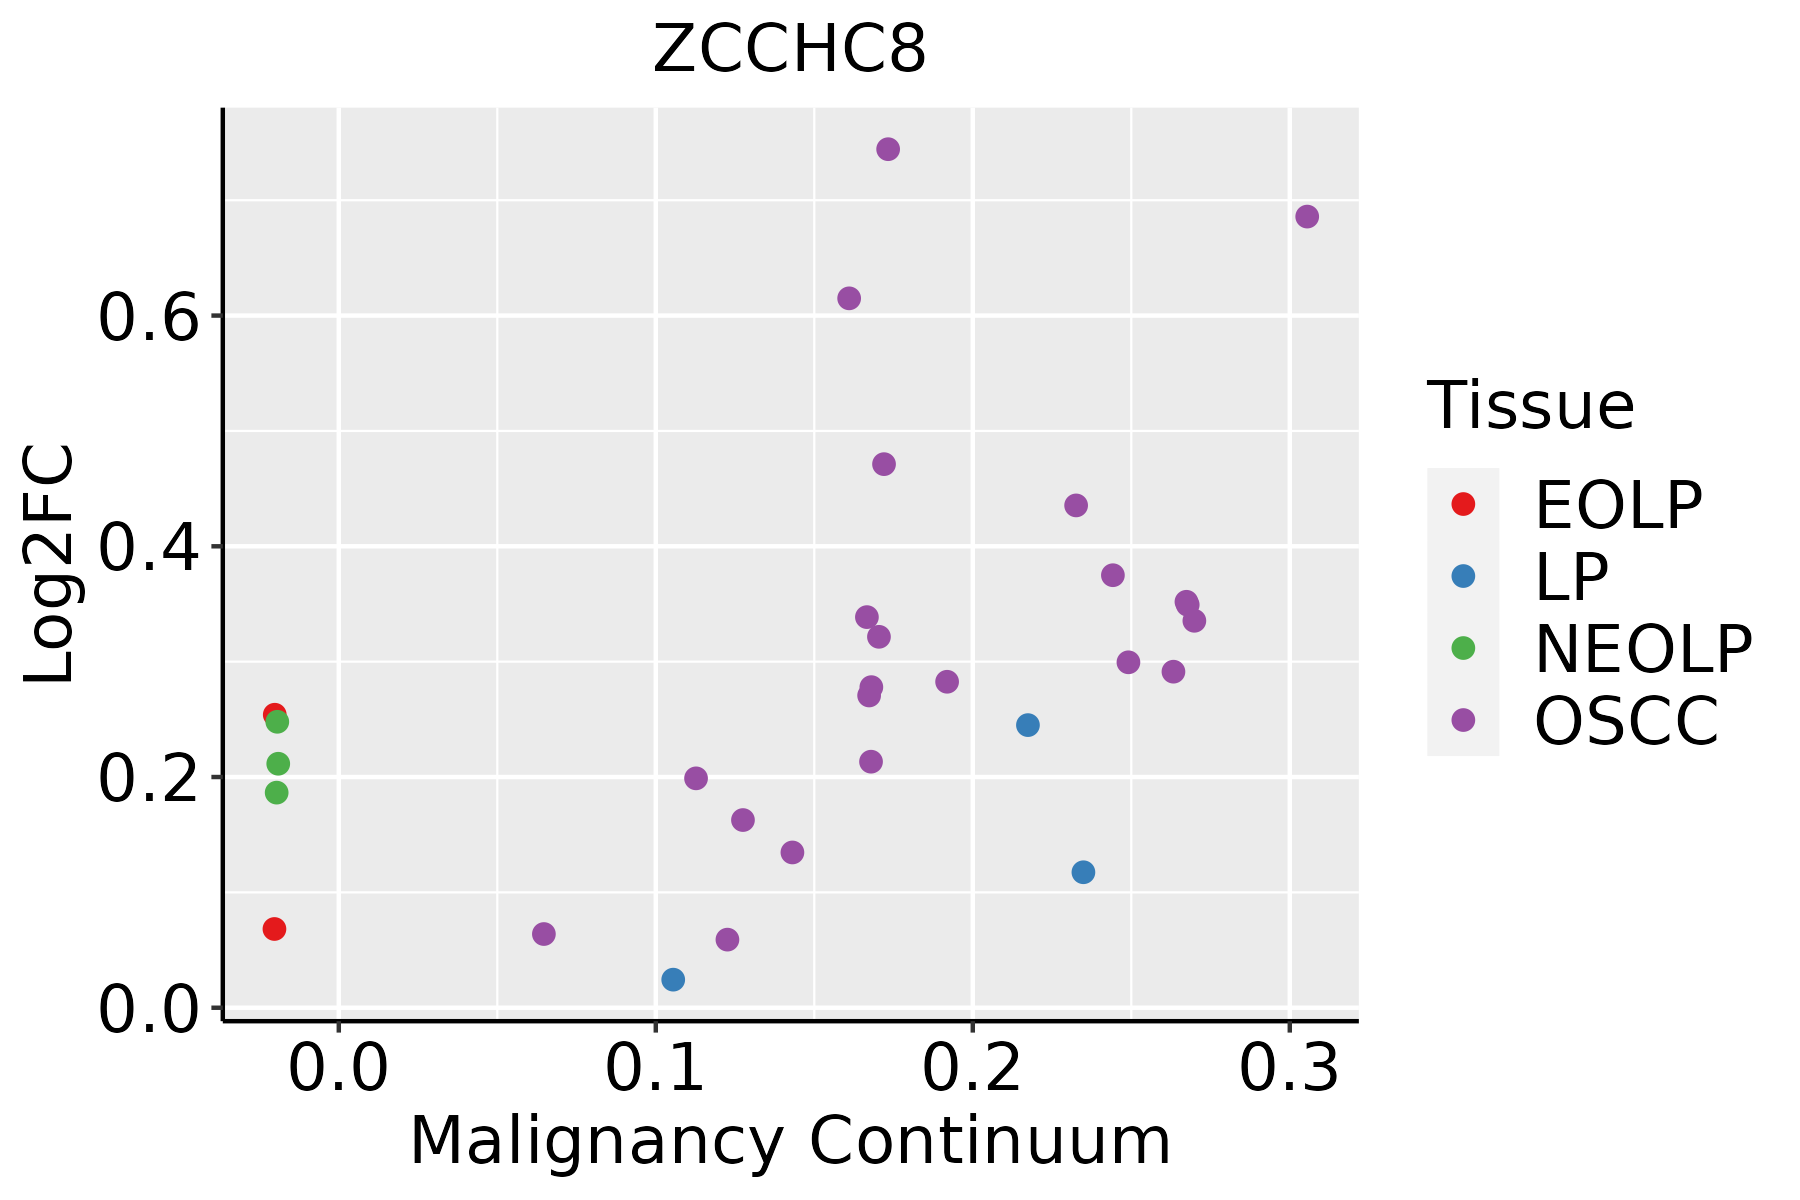 | EOLP: Erosive Oral lichen planus |
| LP: leukoplakia | ||
| NEOLP: Non-erosive oral lichen planus | ||
| OSCC: Oral squamous cell carcinoma |
| ∗log2FC in expression of this searched gene in stem-like cells from each diseased tissue sample relative to stem-like cells in normal samples in each tissue plotted against the malignancy continuum. Samples are colored based on if they are from different disease stage. |
Top |
Malignant transformation related pathway analysis |
| Find out the enriched GO biological processes and KEGG pathways involved in transition from healthy to precancer to cancer |
| Tissue | Disease Stage | Enriched GO biological Processes |
| Colorectum | AD |  |
| Colorectum | SER |  |
| Colorectum | MSS |  |
| Colorectum | MSI-H |  |
| Colorectum | FAP |  |
| ∗Top 15 enriched GO BP terms are showed in the bar plot of each disease state in each tissue. Each row represents a significant GO biological process which is colored according to the -log10(p.adjust). |
| Page: 1 2 3 4 5 6 7 8 9 |
| GO ID | Tissue | Disease Stage | Description | Gene Ratio | Bg Ratio | pvalue | p.adjust | Count |
| GO:0008380111 | Esophagus | ESCC | RNA splicing | 336/8552 | 434/18723 | 1.74e-42 | 3.67e-39 | 336 |
| GO:003447015 | Esophagus | ESCC | ncRNA processing | 300/8552 | 395/18723 | 3.09e-35 | 3.26e-32 | 300 |
| GO:003466012 | Esophagus | ESCC | ncRNA metabolic process | 346/8552 | 485/18723 | 4.35e-31 | 2.51e-28 | 346 |
| GO:0000375111 | Esophagus | ESCC | RNA splicing, via transesterification reactions | 248/8552 | 324/18723 | 3.05e-30 | 1.49e-27 | 248 |
| GO:0000377111 | Esophagus | ESCC | RNA splicing, via transesterification reactions with bulged adenosine as nucleophile | 244/8552 | 320/18723 | 2.52e-29 | 1.07e-26 | 244 |
| GO:0000398111 | Esophagus | ESCC | mRNA splicing, via spliceosome | 244/8552 | 320/18723 | 2.52e-29 | 1.07e-26 | 244 |
| GO:0006401110 | Esophagus | ESCC | RNA catabolic process | 204/8552 | 278/18723 | 3.39e-21 | 5.66e-19 | 204 |
| GO:0034655110 | Esophagus | ESCC | nucleobase-containing compound catabolic process | 272/8552 | 407/18723 | 2.92e-18 | 2.90e-16 | 272 |
| GO:004670018 | Esophagus | ESCC | heterocycle catabolic process | 286/8552 | 445/18723 | 1.12e-15 | 7.47e-14 | 286 |
| GO:004427019 | Esophagus | ESCC | cellular nitrogen compound catabolic process | 288/8552 | 451/18723 | 3.03e-15 | 1.79e-13 | 288 |
| GO:001943918 | Esophagus | ESCC | aromatic compound catabolic process | 295/8552 | 467/18723 | 1.09e-14 | 5.98e-13 | 295 |
| GO:190136118 | Esophagus | ESCC | organic cyclic compound catabolic process | 307/8552 | 495/18723 | 9.99e-14 | 4.80e-12 | 307 |
| GO:00346613 | Esophagus | ESCC | ncRNA catabolic process | 33/8552 | 43/18723 | 3.25e-05 | 2.69e-04 | 33 |
| GO:00194396 | Liver | NAFLD | aromatic compound catabolic process | 102/1882 | 467/18723 | 2.29e-14 | 1.91e-11 | 102 |
| GO:19013616 | Liver | NAFLD | organic cyclic compound catabolic process | 105/1882 | 495/18723 | 7.04e-14 | 5.15e-11 | 105 |
| GO:00442707 | Liver | NAFLD | cellular nitrogen compound catabolic process | 93/1882 | 451/18723 | 1.04e-11 | 4.34e-09 | 93 |
| GO:00467006 | Liver | NAFLD | heterocycle catabolic process | 92/1882 | 445/18723 | 1.16e-11 | 4.52e-09 | 92 |
| GO:00346556 | Liver | NAFLD | nucleobase-containing compound catabolic process | 80/1882 | 407/18723 | 3.07e-09 | 4.61e-07 | 80 |
| GO:00064016 | Liver | NAFLD | RNA catabolic process | 61/1882 | 278/18723 | 3.26e-09 | 4.76e-07 | 61 |
| GO:00083807 | Liver | NAFLD | RNA splicing | 70/1882 | 434/18723 | 4.62e-05 | 1.10e-03 | 70 |
| Page: 1 2 3 |
| Pathway ID | Tissue | Disease Stage | Description | Gene Ratio | Bg Ratio | pvalue | p.adjust | qvalue | Count |
| Page: 1 |
Top |
Cell-cell communication analysis |
| Identification of potential cell-cell interactions between two cell types and their ligand-receptor pairs for different disease states |
| Ligand | Receptor | LRpair | Pathway | Tissue | Disease Stage |
| Page: 1 |
Top |
Single-cell gene regulatory network inference analysis |
| Find out the significant the regulons (TFs) and the target genes of each regulon across cell types for different disease states |
| TF | Cell Type | Tissue | Disease Stage | Target Gene | RSS | Regulon Activity |
| ∗The dot plots of a searched regulon are shown for all cell subpopulations in each disease state of each tissue based on the regulon specific score inferred using pySCENIC and by calculating the average expression. |
| Page: 1 |
Top |
Somatic mutation of malignant transformation related genes |
| Annotation of somatic variants for genes involved in malignant transformation |
| Hugo Symbol | Variant Class | Variant Classification | dbSNP RS | HGVSc | HGVSp | HGVSp Short | SWISSPROT | BIOTYPE | SIFT | PolyPhen | Tumor Sample Barcode | Tissue | Histology | Sex | Age | Stage | Therapy Types | Drugs | Outcome |
| ZCCHC8 | SNV | Missense_Mutation | novel | c.370N>C | p.Glu124Gln | p.E124Q | Q6NZY4 | protein_coding | deleterious(0.03) | benign(0.283) | TCGA-A2-A3Y0-01 | Breast | breast invasive carcinoma | Female | <65 | I/II | Chemotherapy | adriamycin | CR |
| ZCCHC8 | SNV | Missense_Mutation | novel | c.1408N>T | p.Pro470Ser | p.P470S | Q6NZY4 | protein_coding | deleterious(0.02) | possibly_damaging(0.82) | TCGA-AN-A046-01 | Breast | breast invasive carcinoma | Female | >=65 | I/II | Unknown | Unknown | SD |
| ZCCHC8 | SNV | Missense_Mutation | novel | c.109N>A | p.Asp37Asn | p.D37N | Q6NZY4 | protein_coding | deleterious(0.02) | benign(0.107) | TCGA-BH-A203-01 | Breast | breast invasive carcinoma | Female | >=65 | I/II | Unknown | Unknown | PD |
| ZCCHC8 | SNV | Missense_Mutation | c.775N>G | p.Met259Val | p.M259V | Q6NZY4 | protein_coding | deleterious(0.03) | benign(0.058) | TCGA-D8-A1XK-01 | Breast | breast invasive carcinoma | Female | <65 | I/II | Chemotherapy | doxorubicine+cyclophosphamide | SD | |
| ZCCHC8 | SNV | Missense_Mutation | c.2038N>A | p.Glu680Lys | p.E680K | Q6NZY4 | protein_coding | deleterious(0) | possibly_damaging(0.738) | TCGA-E2-A1LH-01 | Breast | breast invasive carcinoma | Female | <65 | I/II | Chemotherapy | adriamycin | SD | |
| ZCCHC8 | SNV | Missense_Mutation | novel | c.1514N>A | p.Thr505Lys | p.T505K | Q6NZY4 | protein_coding | tolerated(0.93) | benign(0.01) | TCGA-PL-A8LZ-01 | Breast | breast invasive carcinoma | Female | <65 | III/IV | Chemotherapy | paclitaxel | SD |
| ZCCHC8 | SNV | Missense_Mutation | c.1022N>A | p.Gly341Asp | p.G341D | Q6NZY4 | protein_coding | tolerated(0.7) | benign(0) | TCGA-2W-A8YY-01 | Cervix | cervical & endocervical cancer | Female | <65 | I/II | Chemotherapy | cisplatin | CR | |
| ZCCHC8 | SNV | Missense_Mutation | c.595N>A | p.Glu199Lys | p.E199K | Q6NZY4 | protein_coding | deleterious(0) | benign(0.141) | TCGA-C5-A7UH-01 | Cervix | cervical & endocervical cancer | Female | <65 | III/IV | Chemotherapy | cisplatin | SD | |
| ZCCHC8 | SNV | Missense_Mutation | c.672G>T | p.Arg224Ser | p.R224S | Q6NZY4 | protein_coding | deleterious(0) | probably_damaging(0.991) | TCGA-FU-A3HZ-01 | Cervix | cervical & endocervical cancer | Female | <65 | I/II | Chemotherapy | cisplatin | CR | |
| ZCCHC8 | SNV | Missense_Mutation | c.1214N>G | p.Ser405Cys | p.S405C | Q6NZY4 | protein_coding | deleterious(0) | possibly_damaging(0.707) | TCGA-UC-A7PF-01 | Cervix | cervical & endocervical cancer | Female | <65 | I/II | Unknown | Unknown | SD |
| Page: 1 2 3 4 5 6 7 |
Top |
Related drugs of malignant transformation related genes |
| Identification of chemicals and drugs interact with genes involved in malignant transfromation |
| (DGIdb 4.0) |
| Entrez ID | Symbol | Category | Interaction Types | Drug Claim Name | Drug Name | PMIDs |
| Page: 1 |

Copyright 2023-Present -The University of Texas Health Science Center at Houston |