
|
|||||
|
 | |
| |
| |
| |
| |
| |
|
Gene: ZCCHC7 |
Gene summary for ZCCHC7 |
| Gene information | Species | Human | Gene symbol | ZCCHC7 | Gene ID | 84186 |
| Gene name | zinc finger CCHC-type containing 7 | |
| Gene Alias | AIR1 | |
| Cytomap | 9p13.2 | |
| Gene Type | protein-coding | GO ID | GO:0005575 | UniProtAcc | Q05DN1 |
Top |
Malignant transformation analysis |
| Identification of the aberrant gene expression in precancerous and cancerous lesions by comparing the gene expression of stem-like cells in diseased tissues with normal stem cells |
| Entrez ID | Symbol | Replicates | Species | Organ | Tissue | Adj P-value | Log2FC | Malignancy |
| 84186 | ZCCHC7 | CCI_1 | Human | Cervix | CC | 1.87e-11 | 1.09e+00 | 0.528 |
| 84186 | ZCCHC7 | CCI_2 | Human | Cervix | CC | 1.95e-14 | 1.90e+00 | 0.5249 |
| 84186 | ZCCHC7 | CCI_3 | Human | Cervix | CC | 1.17e-20 | 1.35e+00 | 0.516 |
| 84186 | ZCCHC7 | L1 | Human | Cervix | CC | 3.80e-03 | -1.68e-01 | 0.0802 |
| 84186 | ZCCHC7 | HTA11_3410_2000001011 | Human | Colorectum | AD | 1.97e-19 | -5.83e-01 | 0.0155 |
| 84186 | ZCCHC7 | HTA11_2487_2000001011 | Human | Colorectum | SER | 8.83e-07 | -5.05e-01 | -0.1808 |
| 84186 | ZCCHC7 | HTA11_2951_2000001011 | Human | Colorectum | AD | 2.34e-04 | -7.38e-01 | 0.0216 |
| 84186 | ZCCHC7 | HTA11_411_2000001011 | Human | Colorectum | SER | 4.37e-02 | 1.78e-02 | -0.2602 |
| 84186 | ZCCHC7 | HTA11_2112_2000001011 | Human | Colorectum | SER | 5.49e-03 | -5.24e-01 | -0.2196 |
| 84186 | ZCCHC7 | HTA11_3361_2000001011 | Human | Colorectum | AD | 2.19e-16 | -6.29e-01 | -0.1207 |
| 84186 | ZCCHC7 | HTA11_5212_2000001011 | Human | Colorectum | AD | 3.26e-08 | -7.08e-01 | -0.2061 |
| 84186 | ZCCHC7 | HTA11_5216_2000001011 | Human | Colorectum | SER | 3.97e-08 | -6.46e-01 | -0.1462 |
| 84186 | ZCCHC7 | HTA11_7862_2000001011 | Human | Colorectum | AD | 7.98e-04 | -5.05e-01 | -0.0179 |
| 84186 | ZCCHC7 | HTA11_866_3004761011 | Human | Colorectum | AD | 4.39e-08 | -4.85e-01 | 0.096 |
| 84186 | ZCCHC7 | HTA11_9408_2000001011 | Human | Colorectum | AD | 5.77e-08 | -7.49e-01 | 0.0451 |
| 84186 | ZCCHC7 | HTA11_8622_2000001021 | Human | Colorectum | SER | 2.20e-03 | -5.74e-01 | 0.0528 |
| 84186 | ZCCHC7 | HTA11_7696_3000711011 | Human | Colorectum | AD | 2.55e-04 | -3.82e-01 | 0.0674 |
| 84186 | ZCCHC7 | HTA11_7469_2000001011 | Human | Colorectum | AD | 1.36e-03 | -6.39e-01 | -0.0124 |
| 84186 | ZCCHC7 | HTA11_11156_2000001011 | Human | Colorectum | AD | 2.72e-06 | -7.42e-01 | 0.0397 |
| 84186 | ZCCHC7 | HTA11_99999970781_79442 | Human | Colorectum | MSS | 6.62e-10 | -4.26e-01 | 0.294 |
| Page: 1 2 3 4 5 6 7 8 9 10 11 12 13 |
| Tissue | Expression Dynamics | Abbreviation |
| Cervix |  | CC: Cervix cancer |
| HSIL_HPV: HPV-infected high-grade squamous intraepithelial lesions | ||
| N_HPV: HPV-infected normal cervix | ||
| Colorectum (GSE201348) |  | FAP: Familial adenomatous polyposis |
| CRC: Colorectal cancer | ||
| Colorectum (HTA11) | 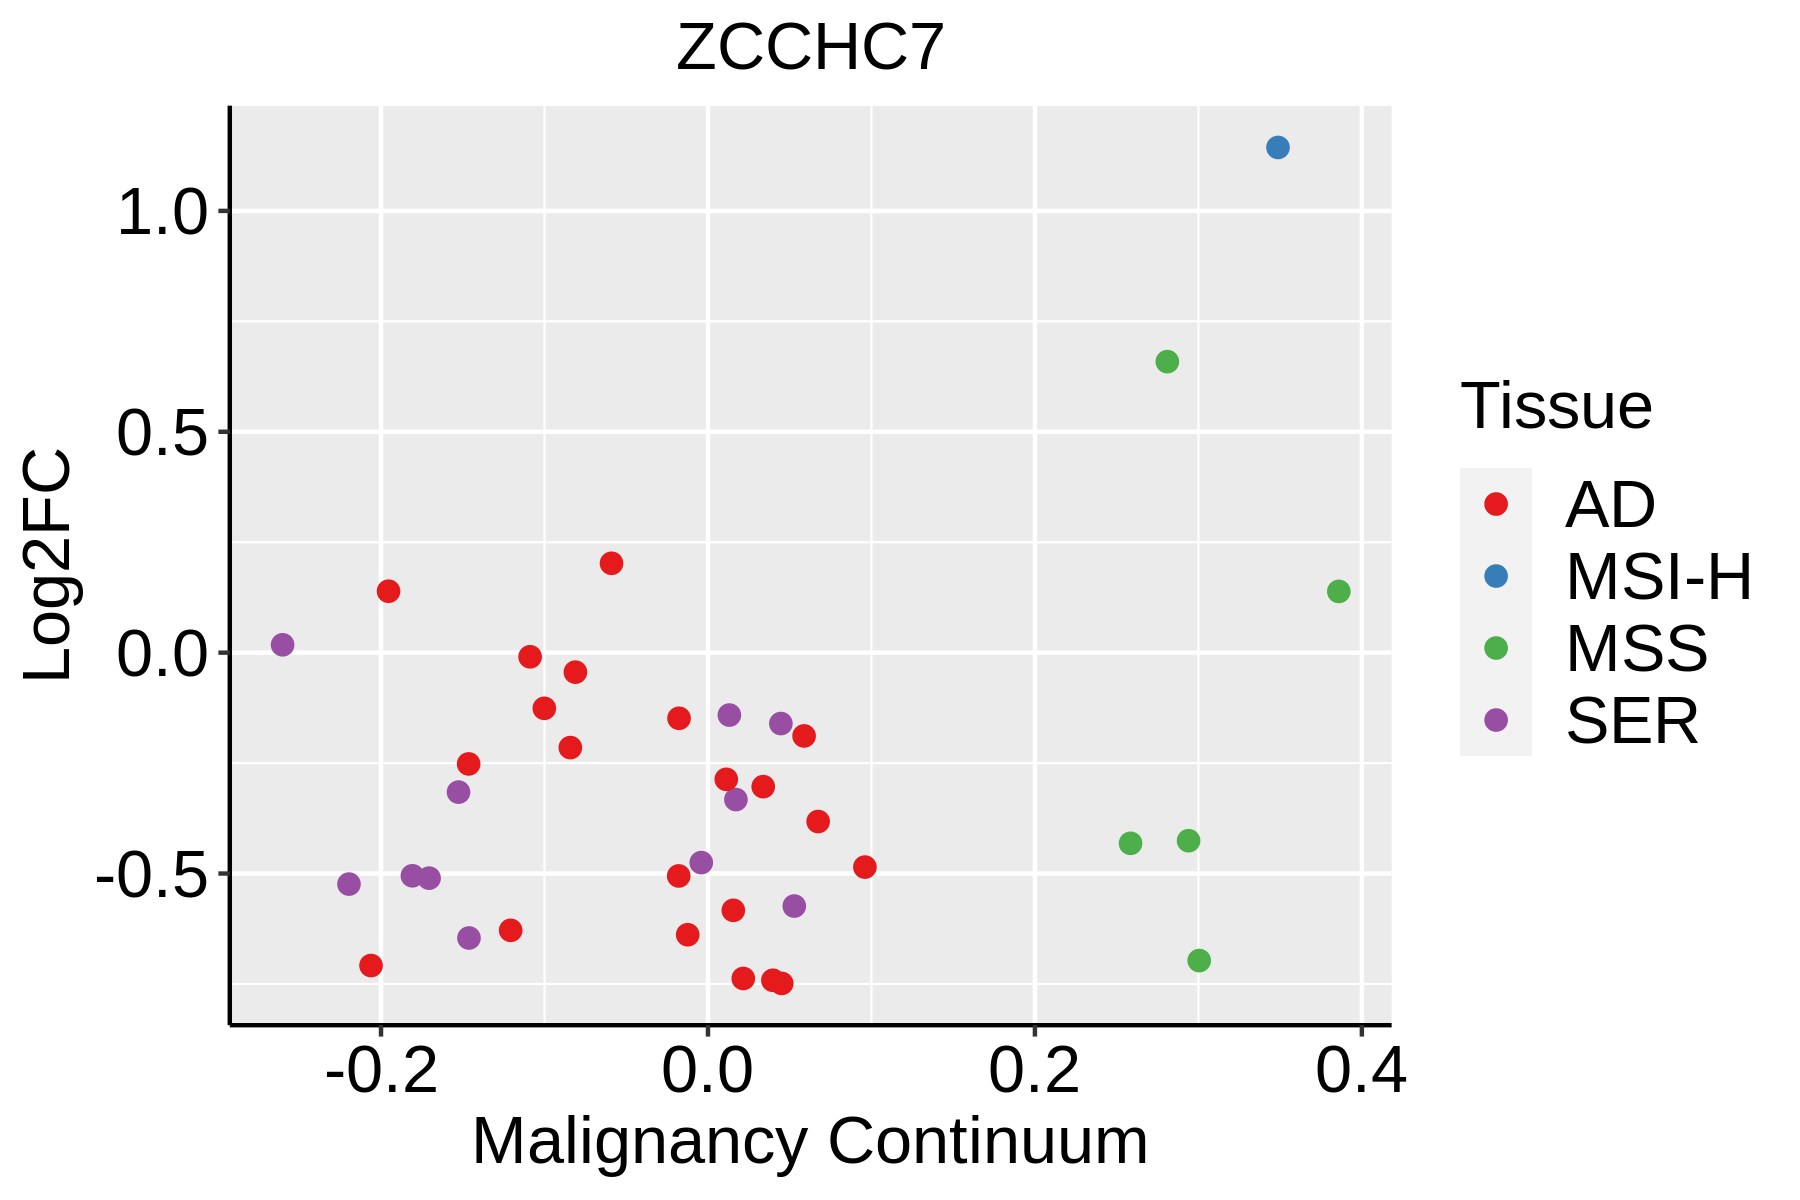 | AD: Adenomas |
| SER: Sessile serrated lesions | ||
| MSI-H: Microsatellite-high colorectal cancer | ||
| MSS: Microsatellite stable colorectal cancer | ||
| Endometrium | 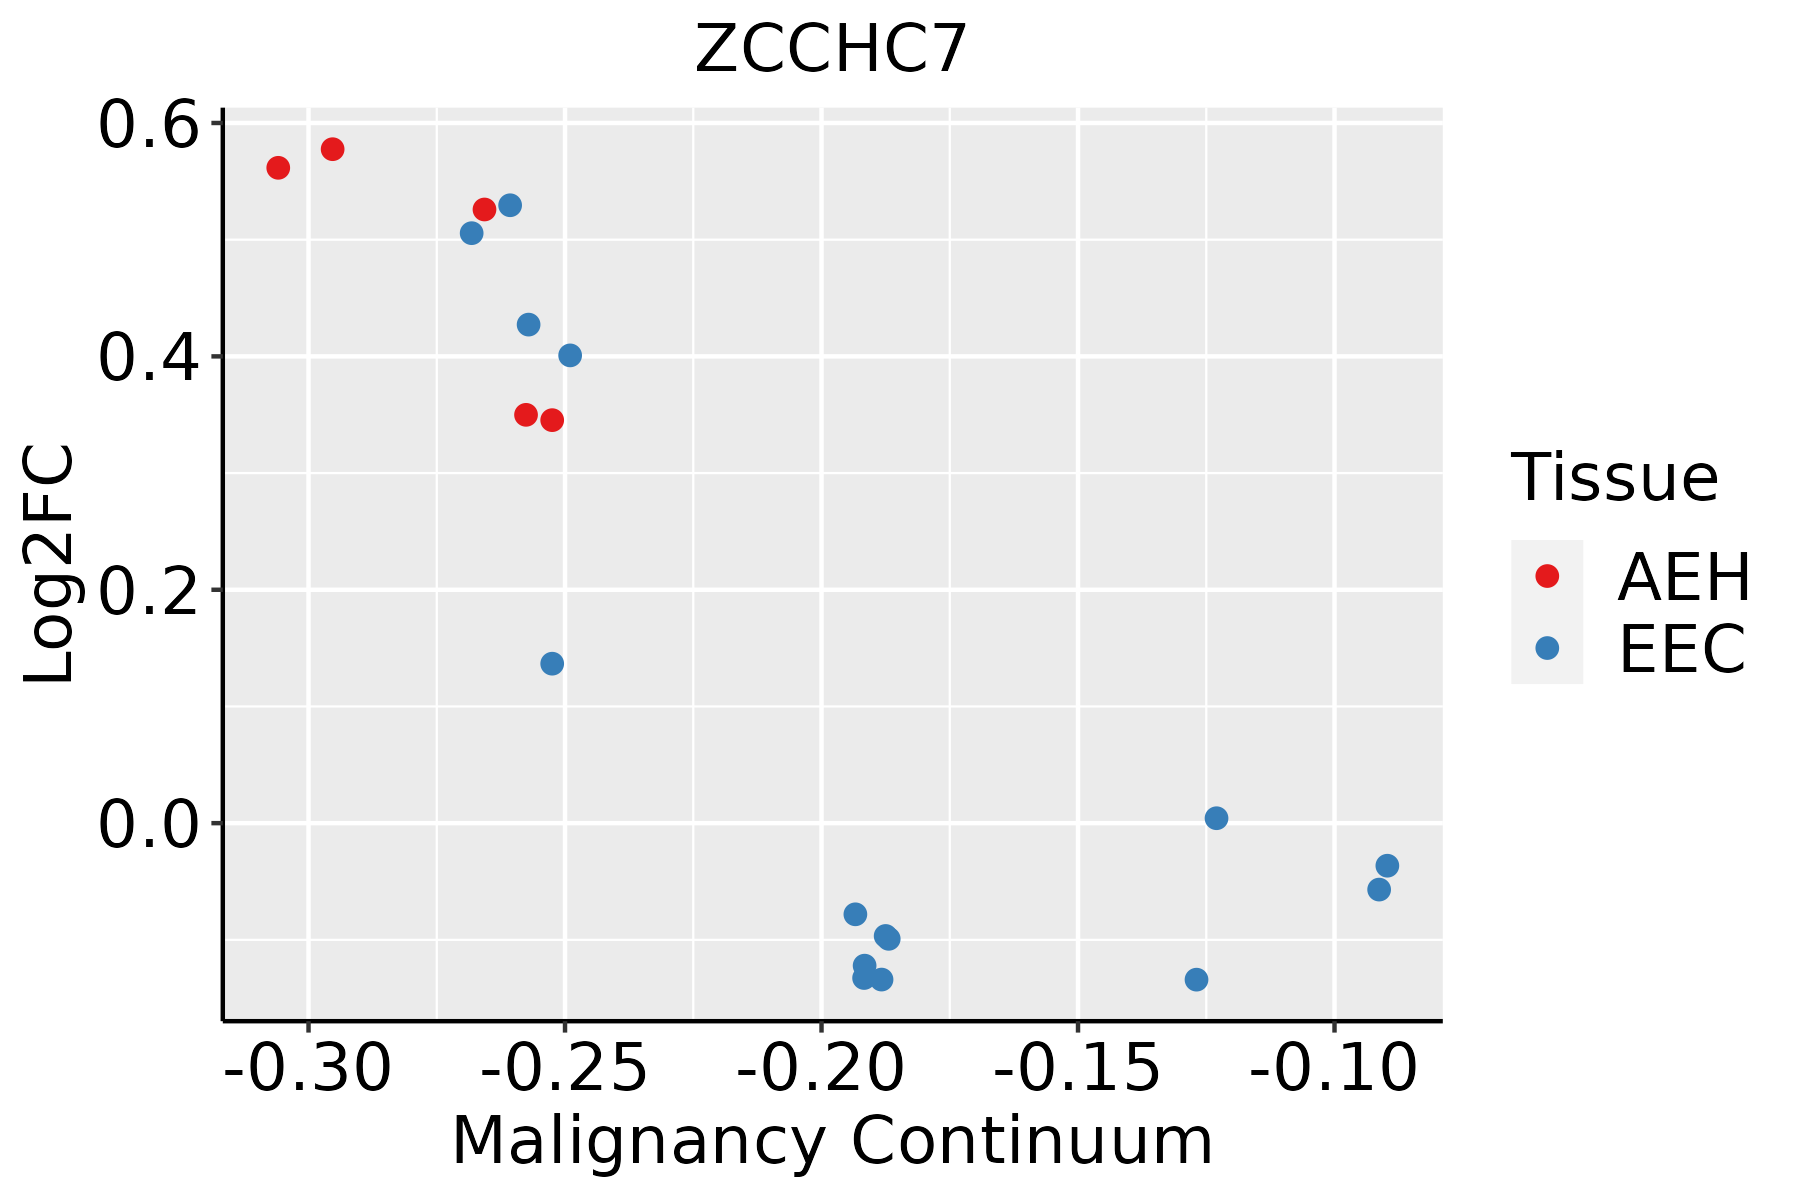 | AEH: Atypical endometrial hyperplasia |
| EEC: Endometrioid Cancer | ||
| Esophagus | 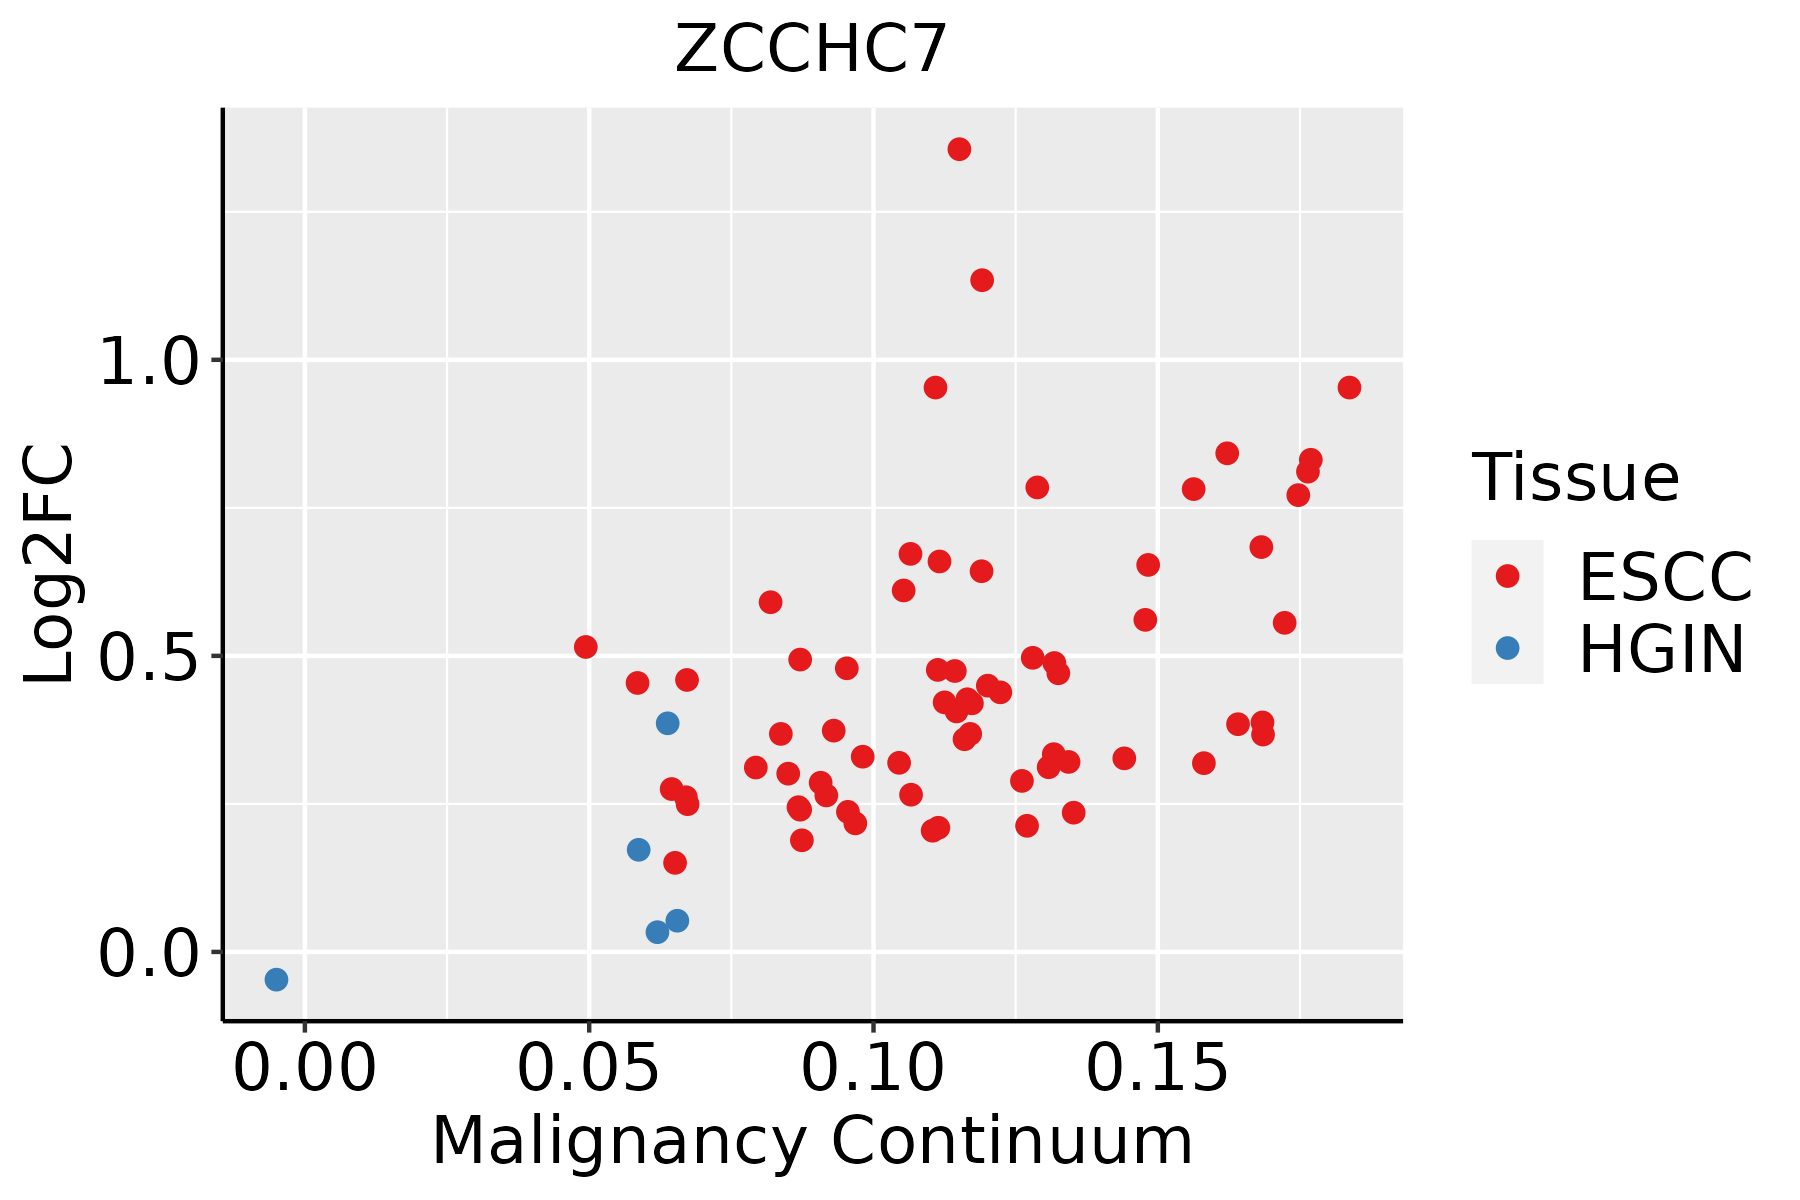 | ESCC: Esophageal squamous cell carcinoma |
| HGIN: High-grade intraepithelial neoplasias | ||
| LGIN: Low-grade intraepithelial neoplasias | ||
| GC | 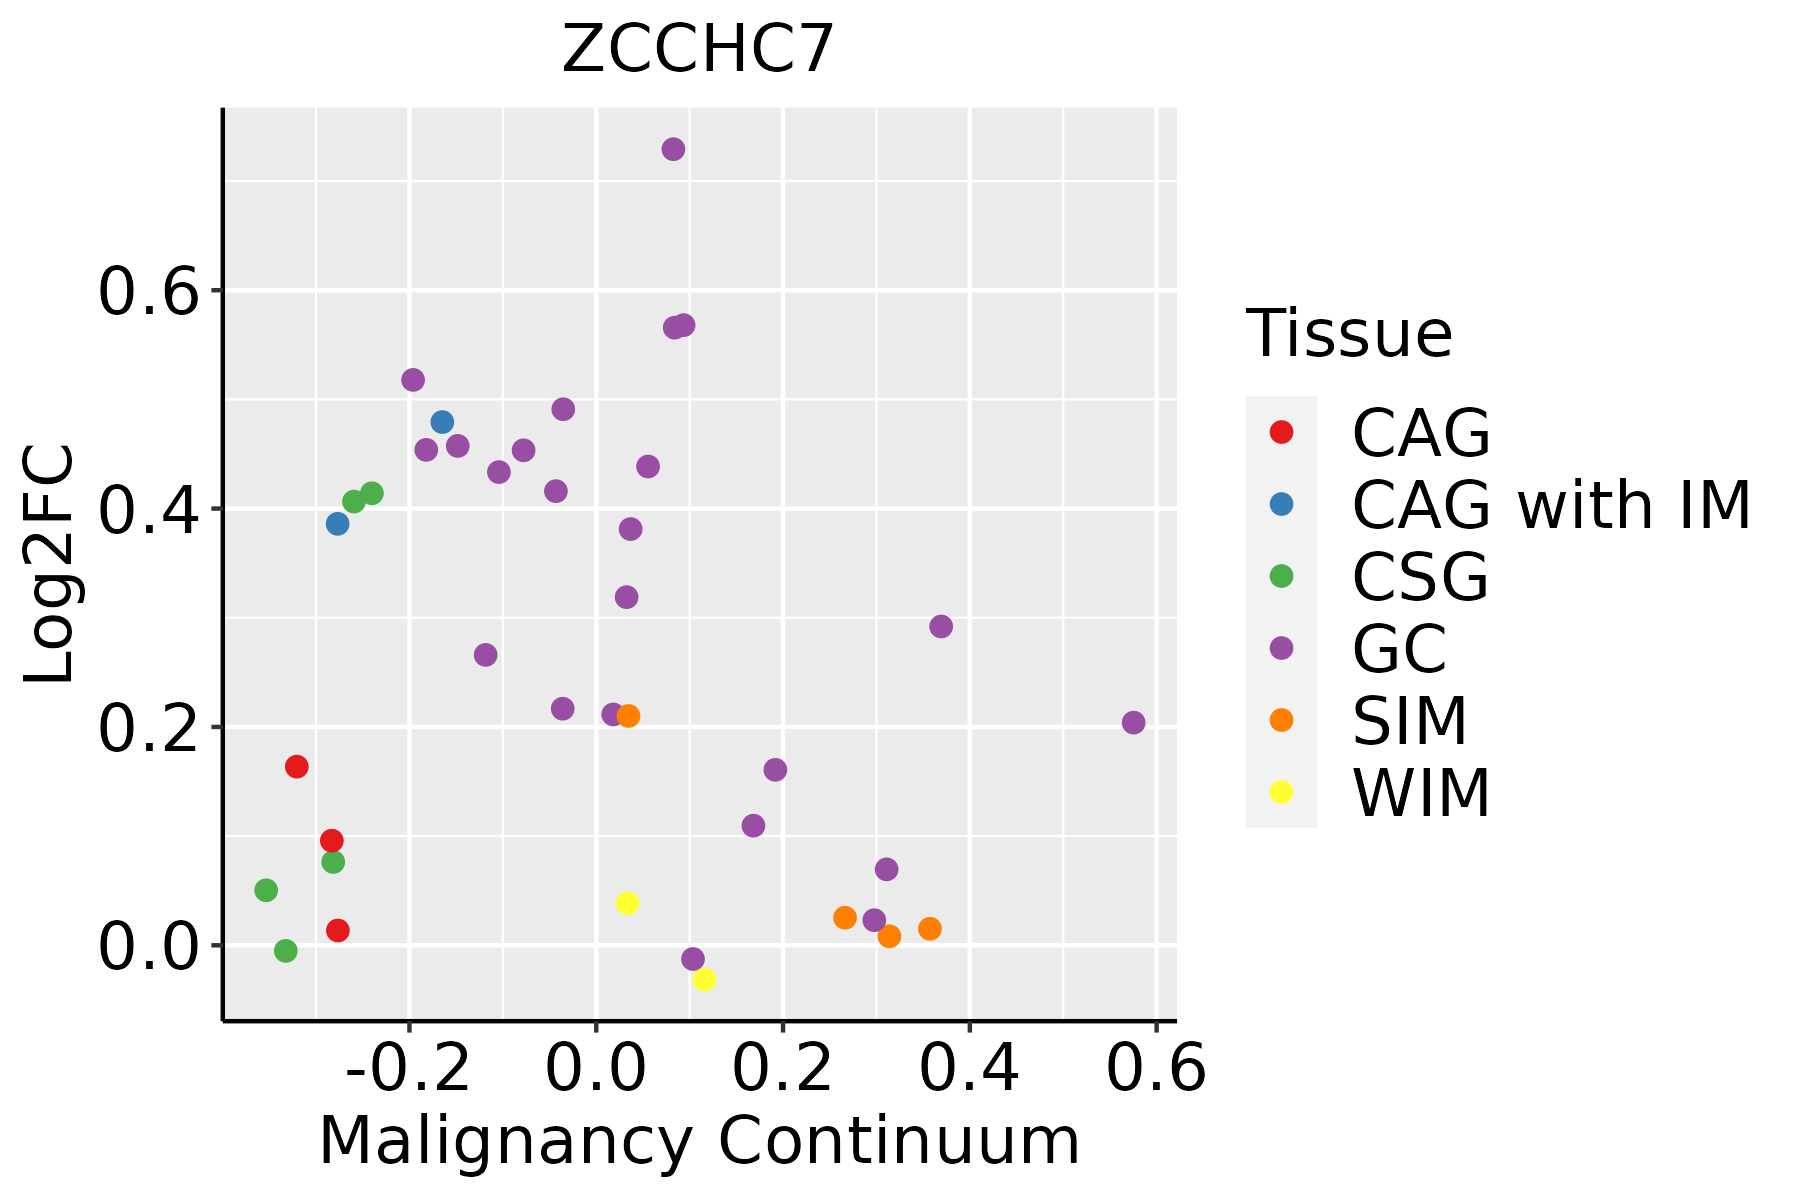 | CAG: Chronic atrophic gastritis |
| CAG with IM: Chronic atrophic gastritis with intestinal metaplasia | ||
| CSG: Chronic superficial gastritis | ||
| GC: Gastric cancer | ||
| SIM: Severe intestinal metaplasia | ||
| WIM: Wild intestinal metaplasia | ||
| Liver | 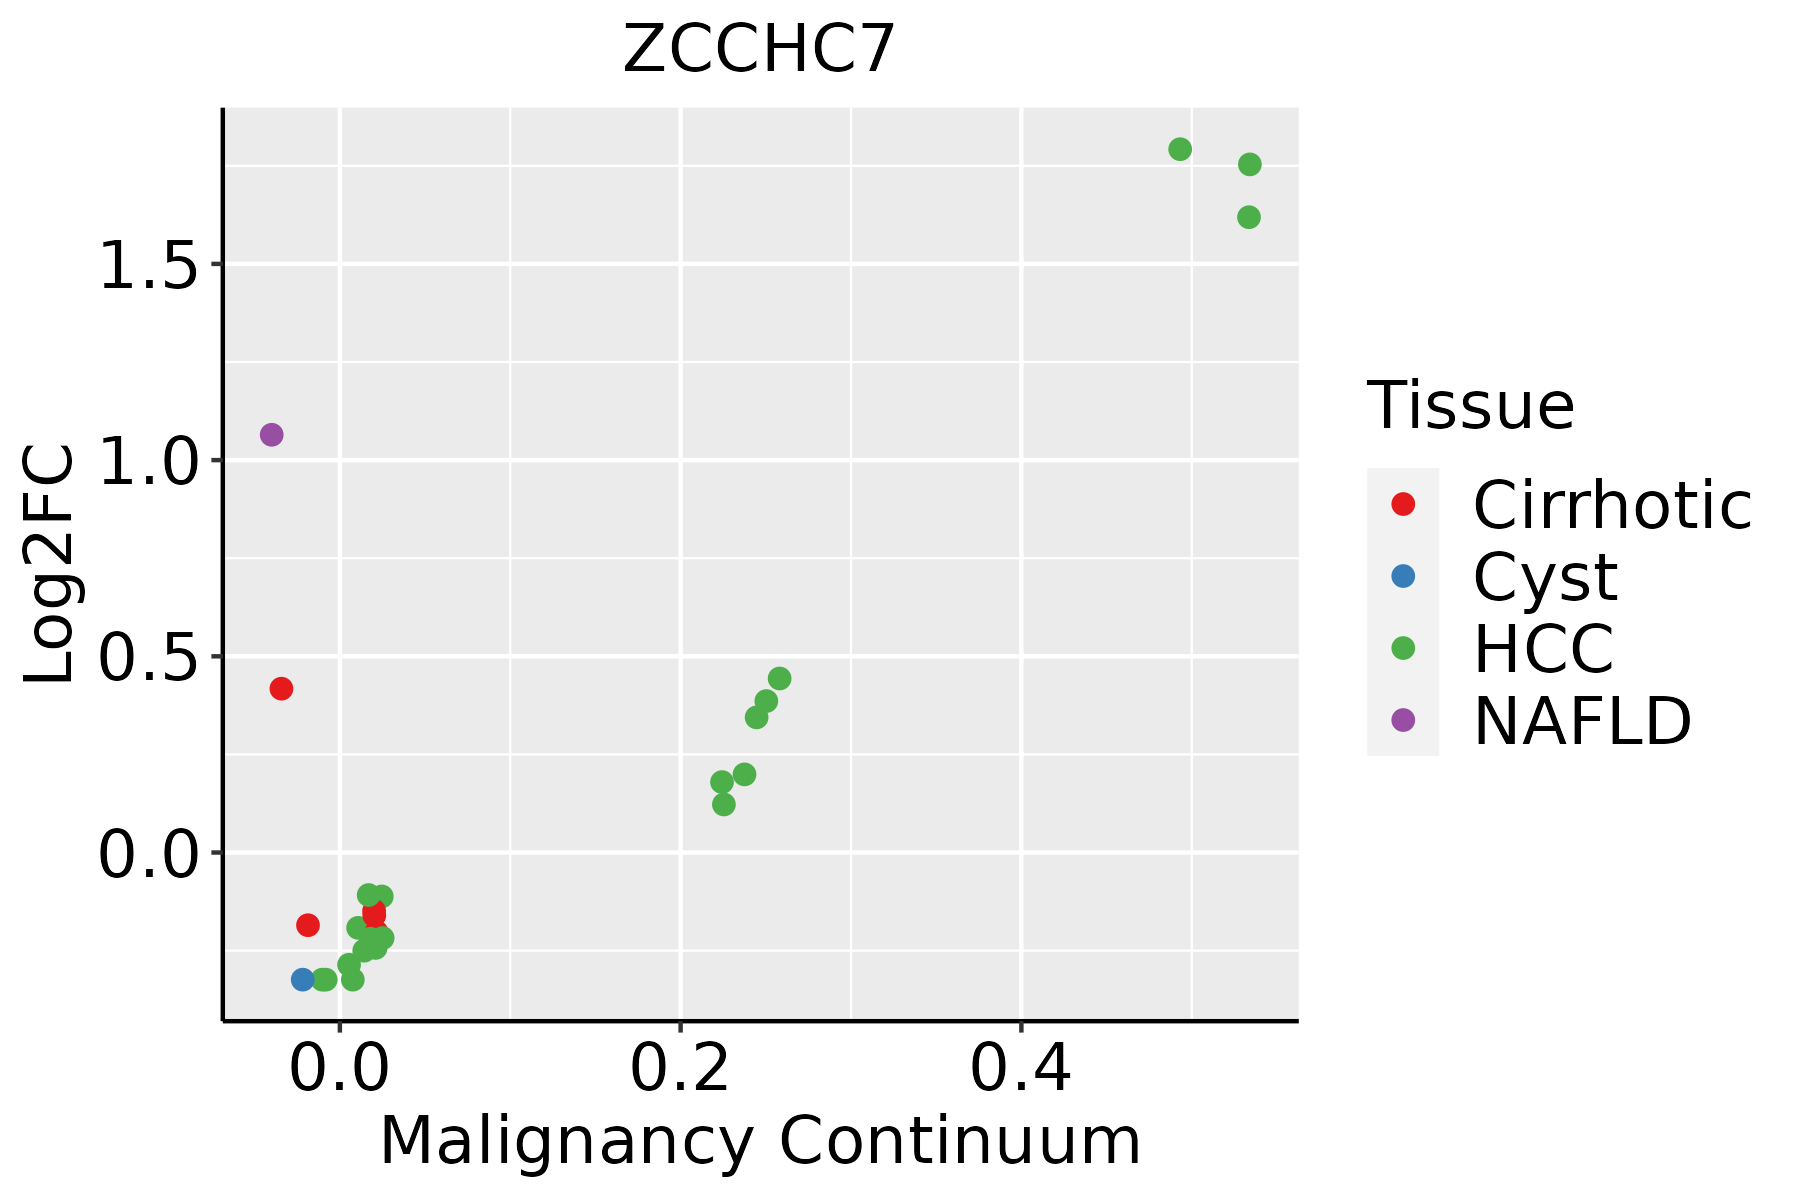 | HCC: Hepatocellular carcinoma |
| NAFLD: Non-alcoholic fatty liver disease | ||
| Lung |  | AAH: Atypical adenomatous hyperplasia |
| AIS: Adenocarcinoma in situ | ||
| IAC: Invasive lung adenocarcinoma | ||
| MIA: Minimally invasive adenocarcinoma | ||
| Oral Cavity | 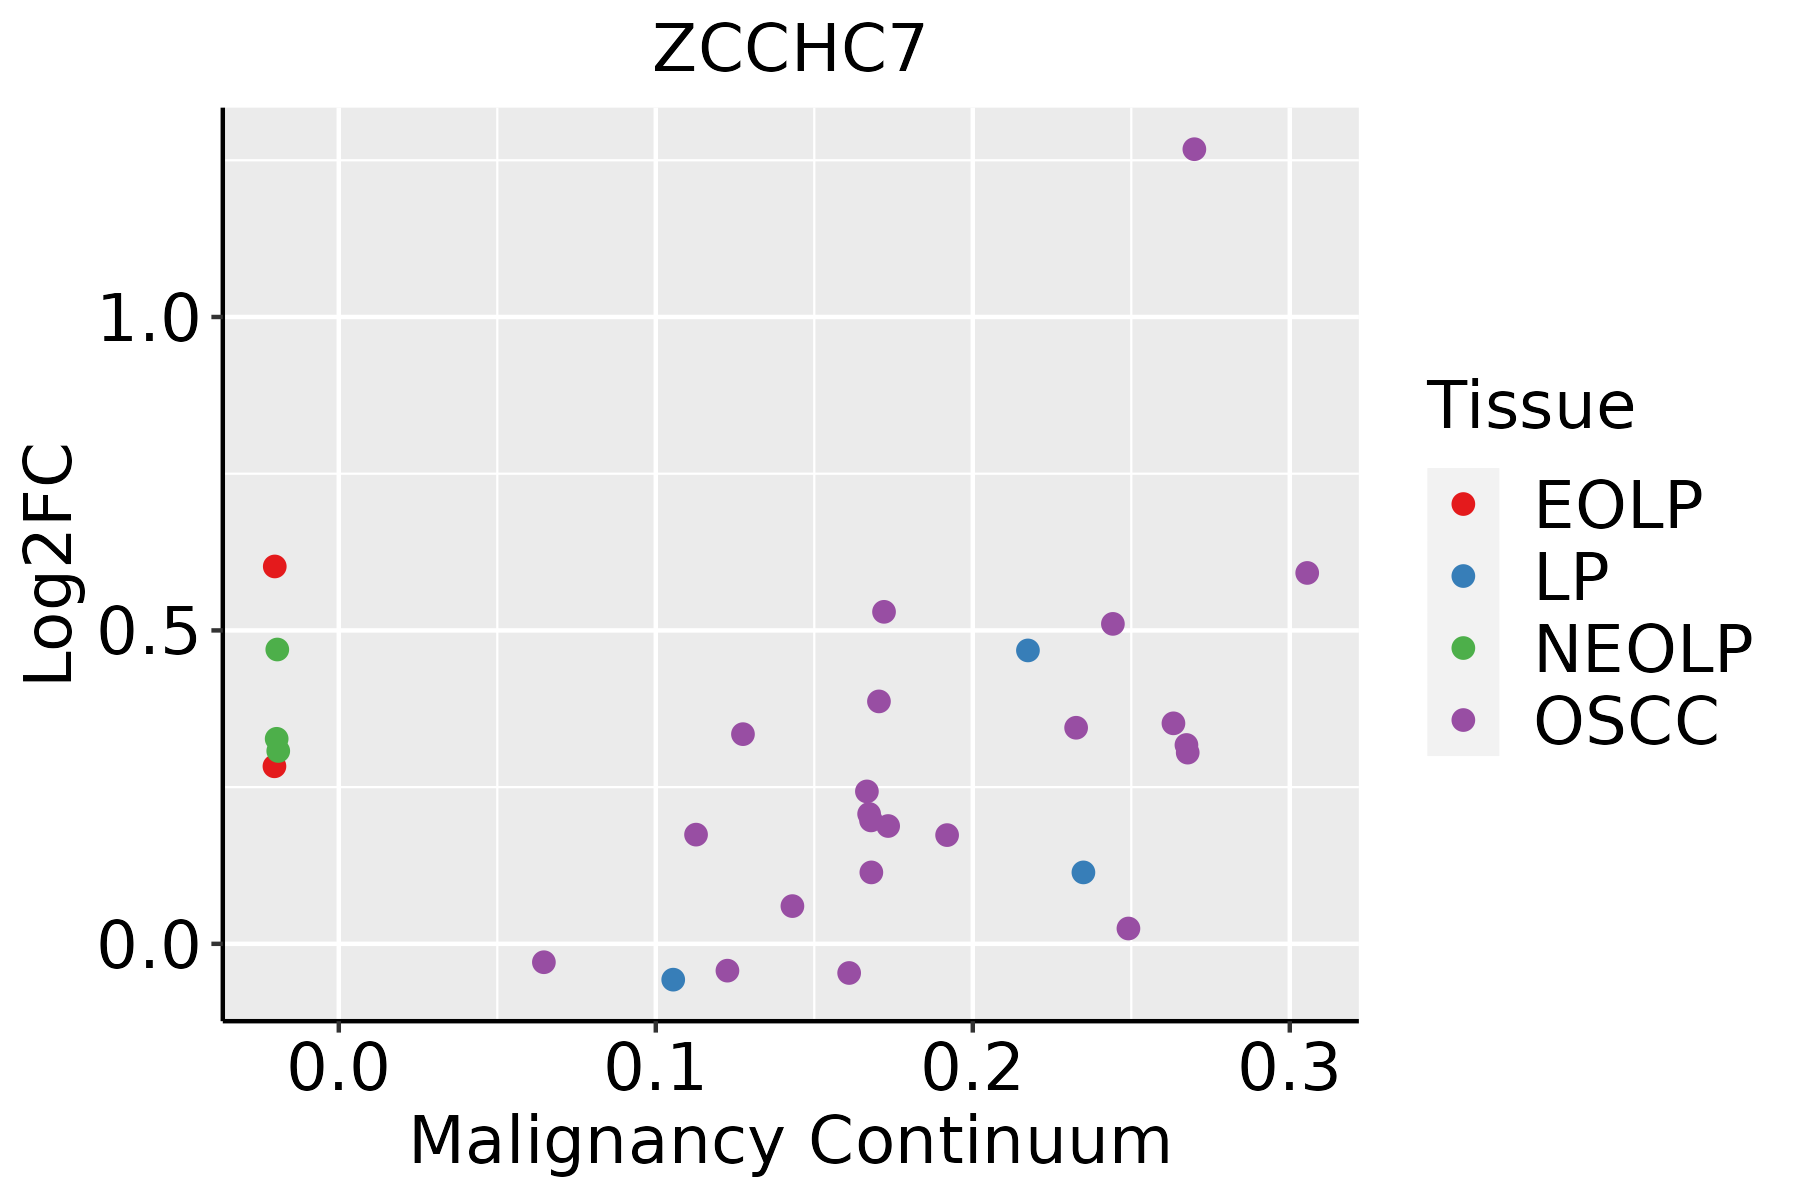 | EOLP: Erosive Oral lichen planus |
| LP: leukoplakia | ||
| NEOLP: Non-erosive oral lichen planus | ||
| OSCC: Oral squamous cell carcinoma | ||
| Prostate |  | BPH: Benign Prostatic Hyperplasia |
| Skin | 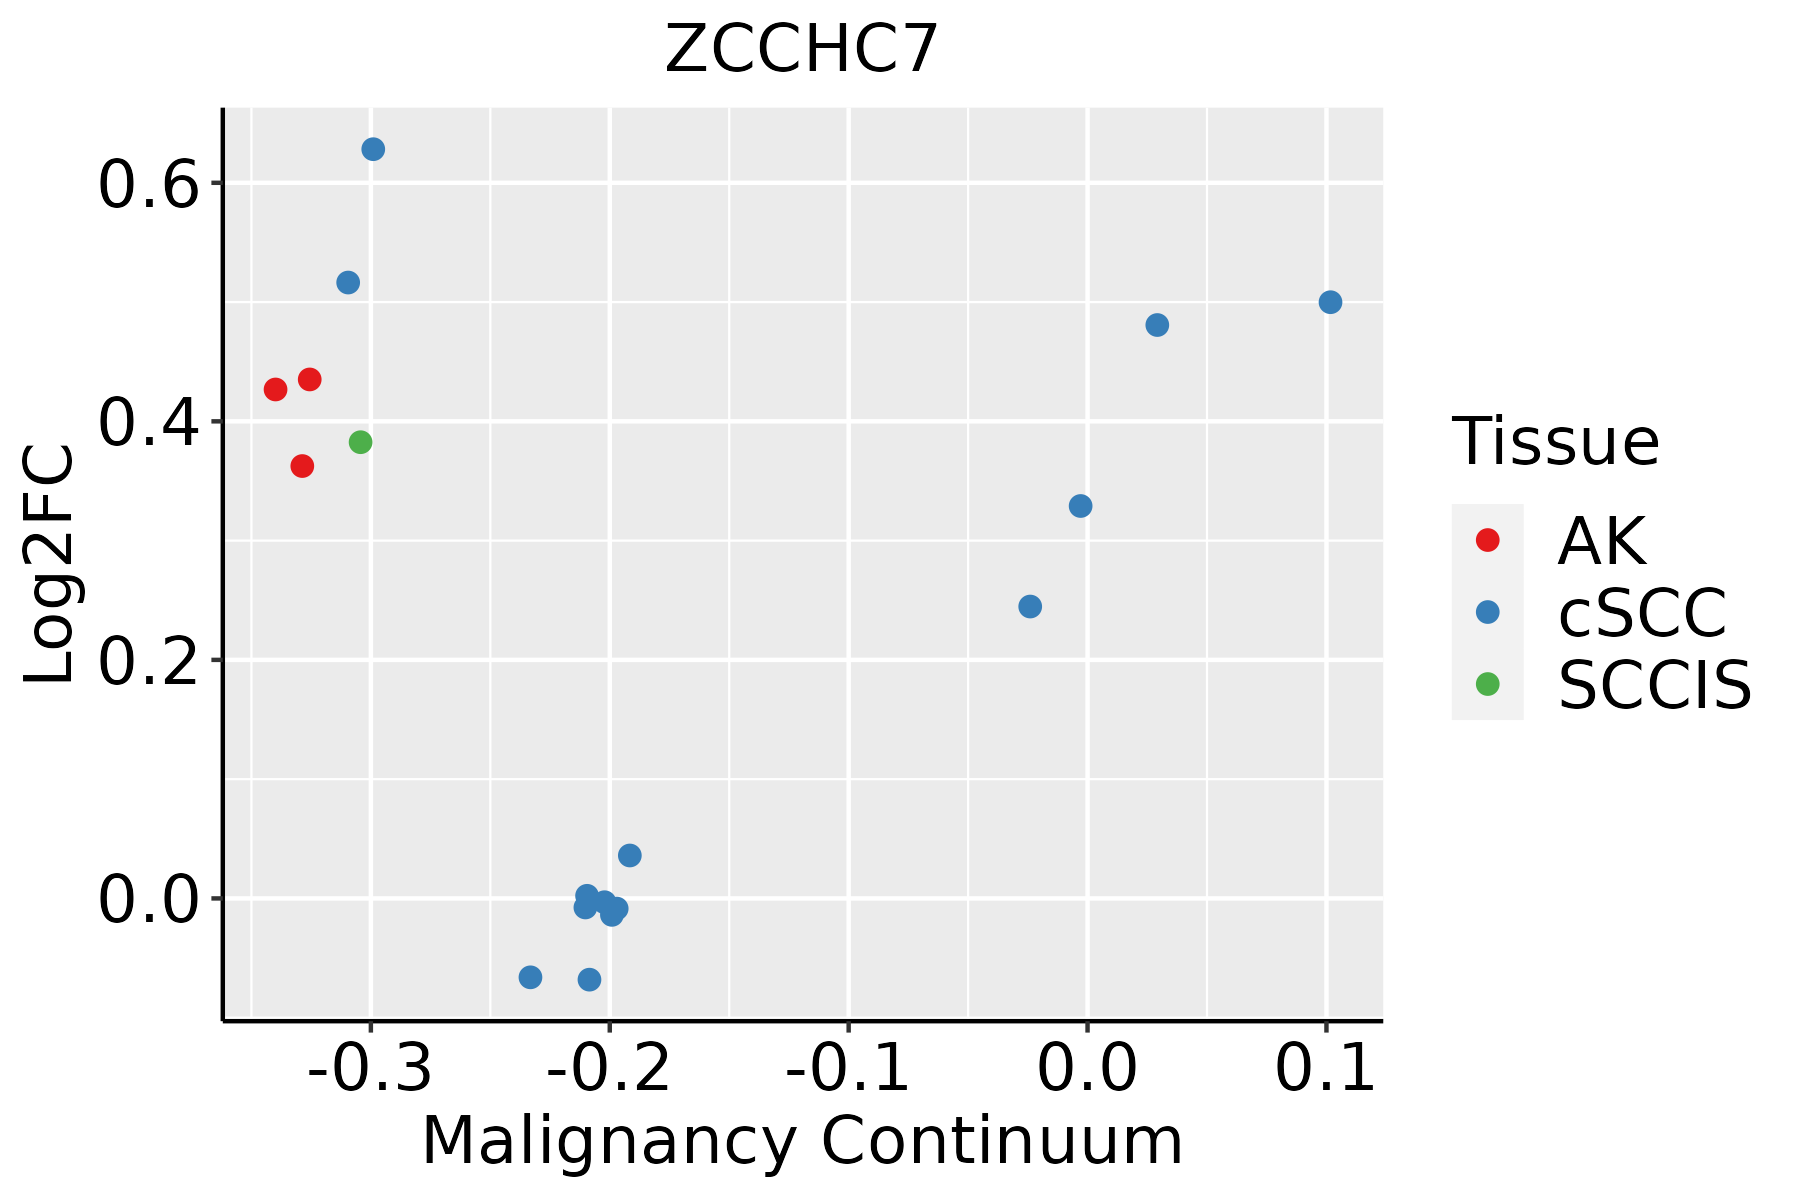 | AK: Actinic keratosis |
| cSCC: Cutaneous squamous cell carcinoma | ||
| SCCIS:squamous cell carcinoma in situ | ||
| Thyroid | 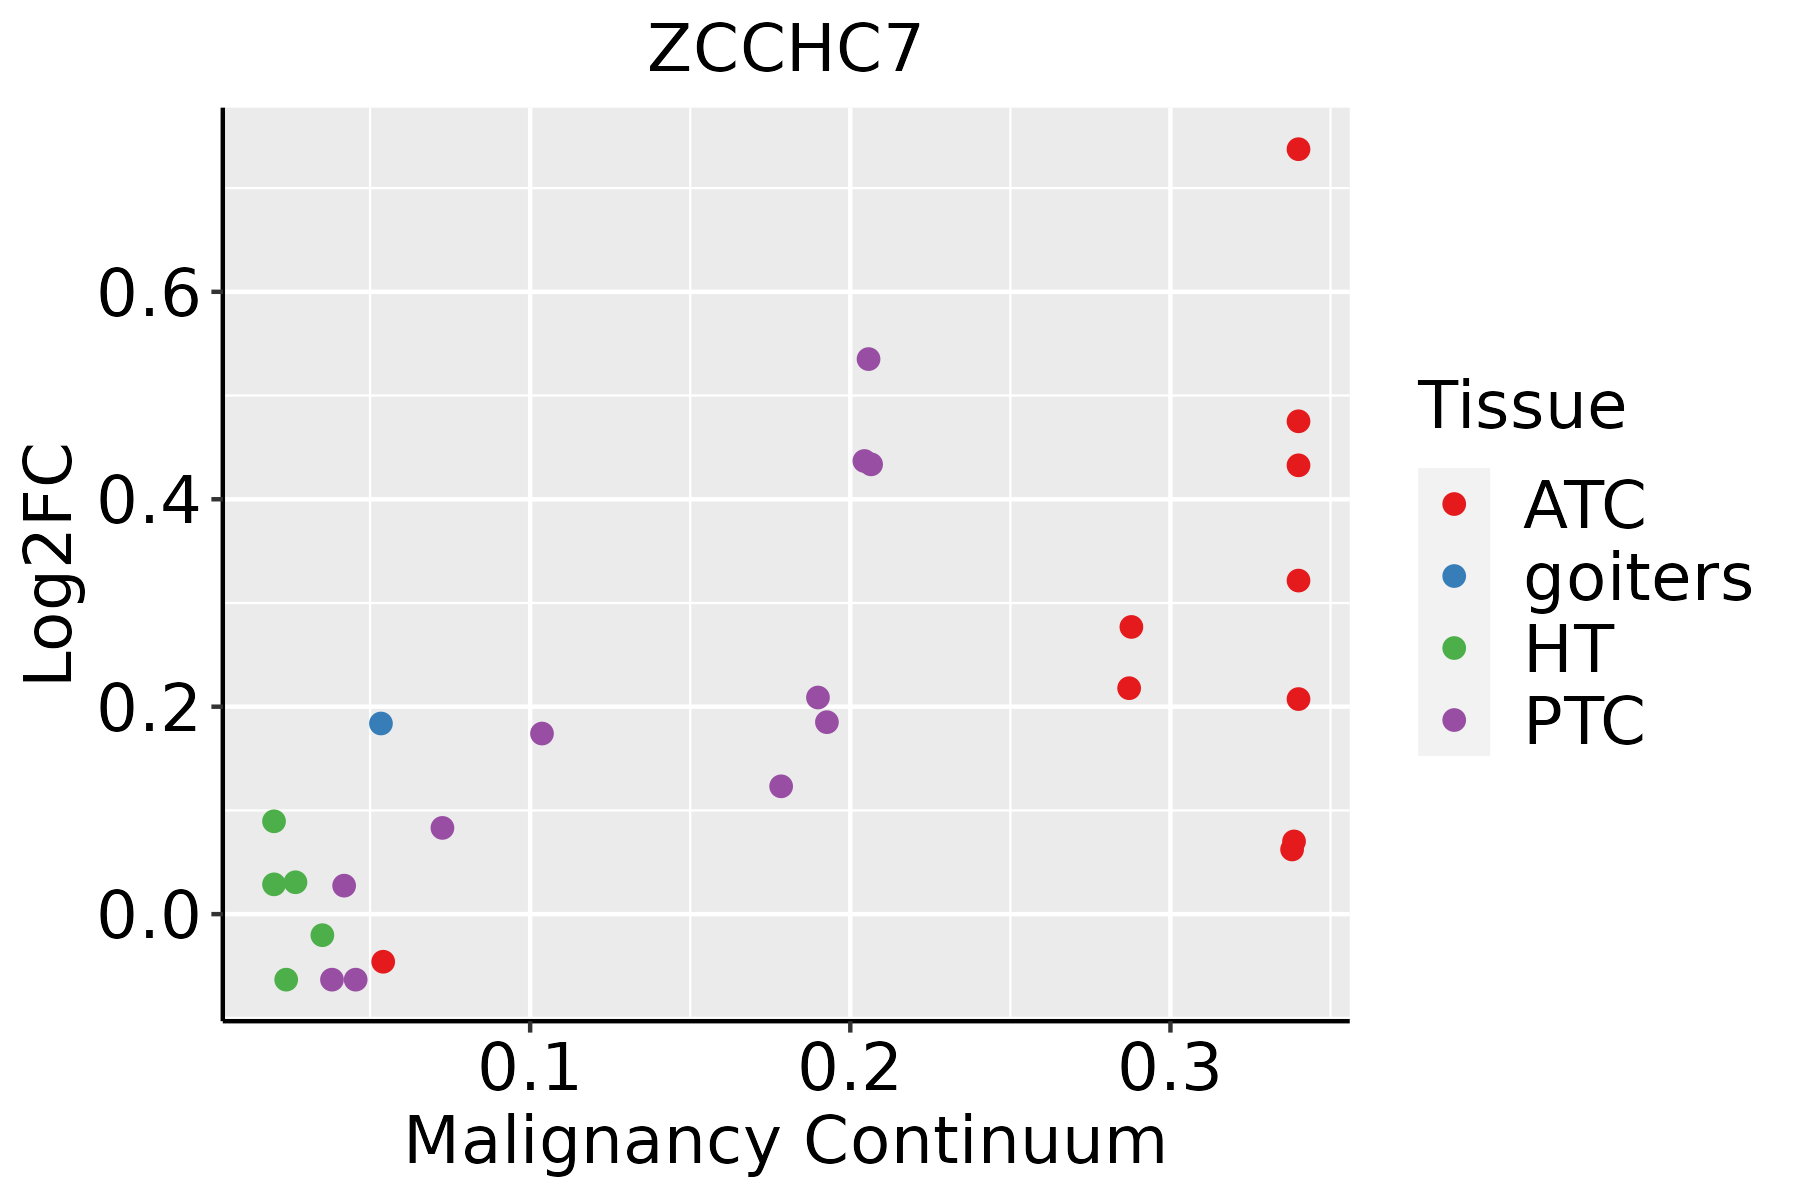 | ATC: Anaplastic thyroid cancer |
| HT: Hashimoto's thyroiditis | ||
| PTC: Papillary thyroid cancer |
| ∗log2FC in expression of this searched gene in stem-like cells from each diseased tissue sample relative to stem-like cells in normal samples in each tissue plotted against the malignancy continuum. Samples are colored based on if they are from different disease stage. |
Top |
Malignant transformation related pathway analysis |
| Find out the enriched GO biological processes and KEGG pathways involved in transition from healthy to precancer to cancer |
| Tissue | Disease Stage | Enriched GO biological Processes |
| Colorectum | AD |  |
| Colorectum | SER |  |
| Colorectum | MSS |  |
| Colorectum | MSI-H |  |
| Colorectum | FAP |  |
| ∗Top 15 enriched GO BP terms are showed in the bar plot of each disease state in each tissue. Each row represents a significant GO biological process which is colored according to the -log10(p.adjust). |
| Page: 1 2 3 4 5 6 7 8 9 |
| GO ID | Tissue | Disease Stage | Description | Gene Ratio | Bg Ratio | pvalue | p.adjust | Count |
| Page: 1 |
| Pathway ID | Tissue | Disease Stage | Description | Gene Ratio | Bg Ratio | pvalue | p.adjust | qvalue | Count |
| hsa030187 | Endometrium | EEC | RNA degradation | 20/1237 | 79/8465 | 8.36e-03 | 3.88e-02 | 2.89e-02 | 20 |
| hsa0301812 | Endometrium | EEC | RNA degradation | 20/1237 | 79/8465 | 8.36e-03 | 3.88e-02 | 2.89e-02 | 20 |
| hsa0301810 | Esophagus | HGIN | RNA degradation | 27/1383 | 79/8465 | 7.73e-05 | 9.00e-04 | 7.15e-04 | 27 |
| hsa0301815 | Esophagus | HGIN | RNA degradation | 27/1383 | 79/8465 | 7.73e-05 | 9.00e-04 | 7.15e-04 | 27 |
| hsa0301824 | Esophagus | ESCC | RNA degradation | 62/4205 | 79/8465 | 1.18e-07 | 9.39e-07 | 4.81e-07 | 62 |
| hsa0301834 | Esophagus | ESCC | RNA degradation | 62/4205 | 79/8465 | 1.18e-07 | 9.39e-07 | 4.81e-07 | 62 |
| hsa03018 | Liver | Cirrhotic | RNA degradation | 44/2530 | 79/8465 | 1.43e-06 | 1.65e-05 | 1.02e-05 | 44 |
| hsa030181 | Liver | Cirrhotic | RNA degradation | 44/2530 | 79/8465 | 1.43e-06 | 1.65e-05 | 1.02e-05 | 44 |
| hsa030182 | Liver | HCC | RNA degradation | 58/4020 | 79/8465 | 2.29e-06 | 2.19e-05 | 1.22e-05 | 58 |
| hsa030183 | Liver | HCC | RNA degradation | 58/4020 | 79/8465 | 2.29e-06 | 2.19e-05 | 1.22e-05 | 58 |
| hsa030189 | Oral cavity | OSCC | RNA degradation | 59/3704 | 79/8465 | 2.05e-08 | 1.91e-07 | 9.70e-08 | 59 |
| hsa0301814 | Oral cavity | OSCC | RNA degradation | 59/3704 | 79/8465 | 2.05e-08 | 1.91e-07 | 9.70e-08 | 59 |
| hsa0301841 | Oral cavity | EOLP | RNA degradation | 22/1218 | 79/8465 | 1.33e-03 | 4.80e-03 | 2.83e-03 | 22 |
| hsa0301851 | Oral cavity | EOLP | RNA degradation | 22/1218 | 79/8465 | 1.33e-03 | 4.80e-03 | 2.83e-03 | 22 |
| hsa0301861 | Oral cavity | NEOLP | RNA degradation | 18/1112 | 79/8465 | 1.25e-02 | 4.06e-02 | 2.56e-02 | 18 |
| hsa0301871 | Oral cavity | NEOLP | RNA degradation | 18/1112 | 79/8465 | 1.25e-02 | 4.06e-02 | 2.56e-02 | 18 |
| hsa030188 | Prostate | BPH | RNA degradation | 29/1718 | 79/8465 | 5.17e-04 | 2.67e-03 | 1.65e-03 | 29 |
| hsa0301813 | Prostate | BPH | RNA degradation | 29/1718 | 79/8465 | 5.17e-04 | 2.67e-03 | 1.65e-03 | 29 |
| Page: 1 |
Top |
Cell-cell communication analysis |
| Identification of potential cell-cell interactions between two cell types and their ligand-receptor pairs for different disease states |
| Ligand | Receptor | LRpair | Pathway | Tissue | Disease Stage |
| Page: 1 |
Top |
Single-cell gene regulatory network inference analysis |
| Find out the significant the regulons (TFs) and the target genes of each regulon across cell types for different disease states |
| TF | Cell Type | Tissue | Disease Stage | Target Gene | RSS | Regulon Activity |
| ∗The dot plots of a searched regulon are shown for all cell subpopulations in each disease state of each tissue based on the regulon specific score inferred using pySCENIC and by calculating the average expression. |
| Page: 1 |
Top |
Somatic mutation of malignant transformation related genes |
| Annotation of somatic variants for genes involved in malignant transformation |
| Hugo Symbol | Variant Class | Variant Classification | dbSNP RS | HGVSc | HGVSp | HGVSp Short | SWISSPROT | BIOTYPE | SIFT | PolyPhen | Tumor Sample Barcode | Tissue | Histology | Sex | Age | Stage | Therapy Types | Drugs | Outcome |
| ZCCHC7 | SNV | Missense_Mutation | novel | c.1082N>T | p.His361Leu | p.H361L | Q8N3Z6 | protein_coding | deleterious(0.03) | benign(0.115) | TCGA-A7-A3RF-01 | Breast | breast invasive carcinoma | Female | >=65 | I/II | Hormone Therapy | anastrozole | PD |
| ZCCHC7 | SNV | Missense_Mutation | rs542717674 | c.787N>T | p.Arg263Cys | p.R263C | Q8N3Z6 | protein_coding | deleterious(0.04) | probably_damaging(0.926) | TCGA-AN-A046-01 | Breast | breast invasive carcinoma | Female | >=65 | I/II | Unknown | Unknown | SD |
| ZCCHC7 | SNV | Missense_Mutation | rs749439929 | c.37N>A | p.Glu13Lys | p.E13K | Q8N3Z6 | protein_coding | deleterious(0.04) | probably_damaging(0.994) | TCGA-AN-A0FS-01 | Breast | breast invasive carcinoma | Female | <65 | I/II | Unknown | Unknown | SD |
| ZCCHC7 | SNV | Missense_Mutation | c.1175N>G | p.Lys392Arg | p.K392R | Q8N3Z6 | protein_coding | tolerated(0.47) | benign(0) | TCGA-E2-A15D-01 | Breast | breast invasive carcinoma | Female | <65 | I/II | Hormone Therapy | tamoxiphen | SD | |
| ZCCHC7 | SNV | Missense_Mutation | novel | c.952G>A | p.Ala318Thr | p.A318T | Q8N3Z6 | protein_coding | tolerated(0.06) | possibly_damaging(0.481) | TCGA-C5-A8XK-01 | Cervix | cervical & endocervical cancer | Female | <65 | I/II | Chemotherapy | cisplatin | SD |
| ZCCHC7 | SNV | Missense_Mutation | novel | c.608N>G | p.Glu203Gly | p.E203G | Q8N3Z6 | protein_coding | deleterious(0.02) | benign(0.009) | TCGA-A6-6649-01 | Colorectum | colon adenocarcinoma | Male | >=65 | III/IV | Chemotherapy | fluorouracil | SD |
| ZCCHC7 | SNV | Missense_Mutation | rs761303878 | c.674N>A | p.Arg225Gln | p.R225Q | Q8N3Z6 | protein_coding | tolerated(0.34) | possibly_damaging(0.743) | TCGA-AA-3710-01 | Colorectum | colon adenocarcinoma | Female | >=65 | I/II | Unknown | Unknown | SD |
| ZCCHC7 | SNV | Missense_Mutation | novel | c.19G>A | p.Glu7Lys | p.E7K | Q8N3Z6 | protein_coding | deleterious(0.01) | possibly_damaging(0.877) | TCGA-AA-3984-01 | Colorectum | colon adenocarcinoma | Female | <65 | I/II | Unknown | Unknown | SD |
| ZCCHC7 | SNV | Missense_Mutation | c.130G>T | p.Asp44Tyr | p.D44Y | Q8N3Z6 | protein_coding | deleterious(0.01) | possibly_damaging(0.817) | TCGA-AA-A010-01 | Colorectum | colon adenocarcinoma | Female | <65 | I/II | Chemotherapy | folinic | CR | |
| ZCCHC7 | SNV | Missense_Mutation | rs542717674 | c.787N>T | p.Arg263Cys | p.R263C | Q8N3Z6 | protein_coding | deleterious(0.04) | probably_damaging(0.926) | TCGA-AZ-4315-01 | Colorectum | colon adenocarcinoma | Male | <65 | I/II | Unknown | Unknown | SD |
| Page: 1 2 3 4 5 6 |
Top |
Related drugs of malignant transformation related genes |
| Identification of chemicals and drugs interact with genes involved in malignant transfromation |
| (DGIdb 4.0) |
| Entrez ID | Symbol | Category | Interaction Types | Drug Claim Name | Drug Name | PMIDs |
| Page: 1 |

Copyright 2023-Present -The University of Texas Health Science Center at Houston |