Schematic overview of the cellular and molecular mechanisms involved in the cancer progression, including the proposed cellular and molecular mechanisms in cancer cells trajectory. AT1: alveolar type 1 cells; AT2: alveolar type 2 cells; AAH: atypical adenomatous hyperplasia; AIS: adenocarcinoma in situ; MIA: minimally invasive adenocarcinoma; IA: invasive adenocarcinoma; EMT: epithelial-mesenchymal transition

Home

Download

Statistics

Help

Contact

Center for Computational Systems Medicine
leaf

Gene summary

leaf

Malignant transformation analysis

leaf

Malignant transformation related pathway analysis

leaf

Cell-cell communication analysis

leaf

Single-cell gene regulatory network inference analysis

leaf

Somatic mutation of malignant transformation related genes

leaf

Related drugs of malignant transformation related genes

Gene: ZCCHC17

Gene summary for ZCCHC17

check button Gene summary.

Gene informationSpeciesHuman
Gene symbol

ZCCHC17

Gene ID

51538

Gene namezinc finger CCHC-type containing 17
Gene AliasHSPC251
Cytomap1p35.2
Gene Typeprotein-coding
GO ID

GO:0006139

UniProtAcc

A0A087WXF8


Top

Malignant transformation analysis

check button Identification of the aberrant gene expression in precancerous and cancerous lesions by comparing the gene expression of stem-like cells in diseased tissues with normal stem cells
check button Malignant transformation involving gene list.
Entrez IDSymbolReplicatesSpeciesOrganTissueAdj P-valueLog2FCMalignancy
51538ZCCHC17LZE4THumanEsophagusESCC1.49e-132.20e-010.0811
51538ZCCHC17LZE7THumanEsophagusESCC1.54e-033.78e-010.0667
51538ZCCHC17LZE8THumanEsophagusESCC4.56e-061.01e-010.067
51538ZCCHC17LZE20THumanEsophagusESCC6.90e-062.75e-010.0662
51538ZCCHC17LZE24D1HumanEsophagusHGIN1.05e-025.35e-010.054
51538ZCCHC17LZE24THumanEsophagusESCC1.44e-145.01e-010.0596
51538ZCCHC17LZE6THumanEsophagusESCC1.08e-073.48e-010.0845
51538ZCCHC17P1T-EHumanEsophagusESCC1.38e-054.42e-010.0875
51538ZCCHC17P2T-EHumanEsophagusESCC1.77e-397.43e-010.1177
51538ZCCHC17P4T-EHumanEsophagusESCC3.23e-266.30e-010.1323
51538ZCCHC17P5T-EHumanEsophagusESCC5.71e-194.81e-010.1327
51538ZCCHC17P8T-EHumanEsophagusESCC1.09e-254.14e-010.0889
51538ZCCHC17P9T-EHumanEsophagusESCC6.48e-161.72e-010.1131
51538ZCCHC17P10T-EHumanEsophagusESCC7.36e-356.94e-010.116
51538ZCCHC17P11T-EHumanEsophagusESCC1.97e-136.05e-010.1426
51538ZCCHC17P12T-EHumanEsophagusESCC1.84e-183.26e-010.1122
51538ZCCHC17P15T-EHumanEsophagusESCC1.39e-144.23e-010.1149
51538ZCCHC17P16T-EHumanEsophagusESCC2.40e-233.81e-010.1153
51538ZCCHC17P17T-EHumanEsophagusESCC3.23e-094.42e-010.1278
51538ZCCHC17P19T-EHumanEsophagusESCC2.09e-047.56e-010.1662
Page: 1 2 3 4 5 6 7 

check button Transcriptomic changes along malignancy continuum.
TissueExpression DynamicsAbbreviation
EsophagusThe image shows the transcriptomic changes along malignancy continuum.log2FC in expression of this searched gene in stem-like cells from each diseased tissue sample relative to stem-like cells in normal samples in each tissue plotted against the malignancy continuum. Samples are colored based on if they are from different disease stage.ESCC: Esophageal squamous cell carcinoma
HGIN: High-grade intraepithelial neoplasias
LGIN: Low-grade intraepithelial neoplasias
LiverThe image shows the transcriptomic changes along malignancy continuum.log2FC in expression of this searched gene in stem-like cells from each diseased tissue sample relative to stem-like cells in normal samples in each tissue plotted against the malignancy continuum. Samples are colored based on if they are from different disease stage.HCC: Hepatocellular carcinoma
NAFLD: Non-alcoholic fatty liver disease
Oral CavityThe image shows the transcriptomic changes along malignancy continuum.log2FC in expression of this searched gene in stem-like cells from each diseased tissue sample relative to stem-like cells in normal samples in each tissue plotted against the malignancy continuum. Samples are colored based on if they are from different disease stage.
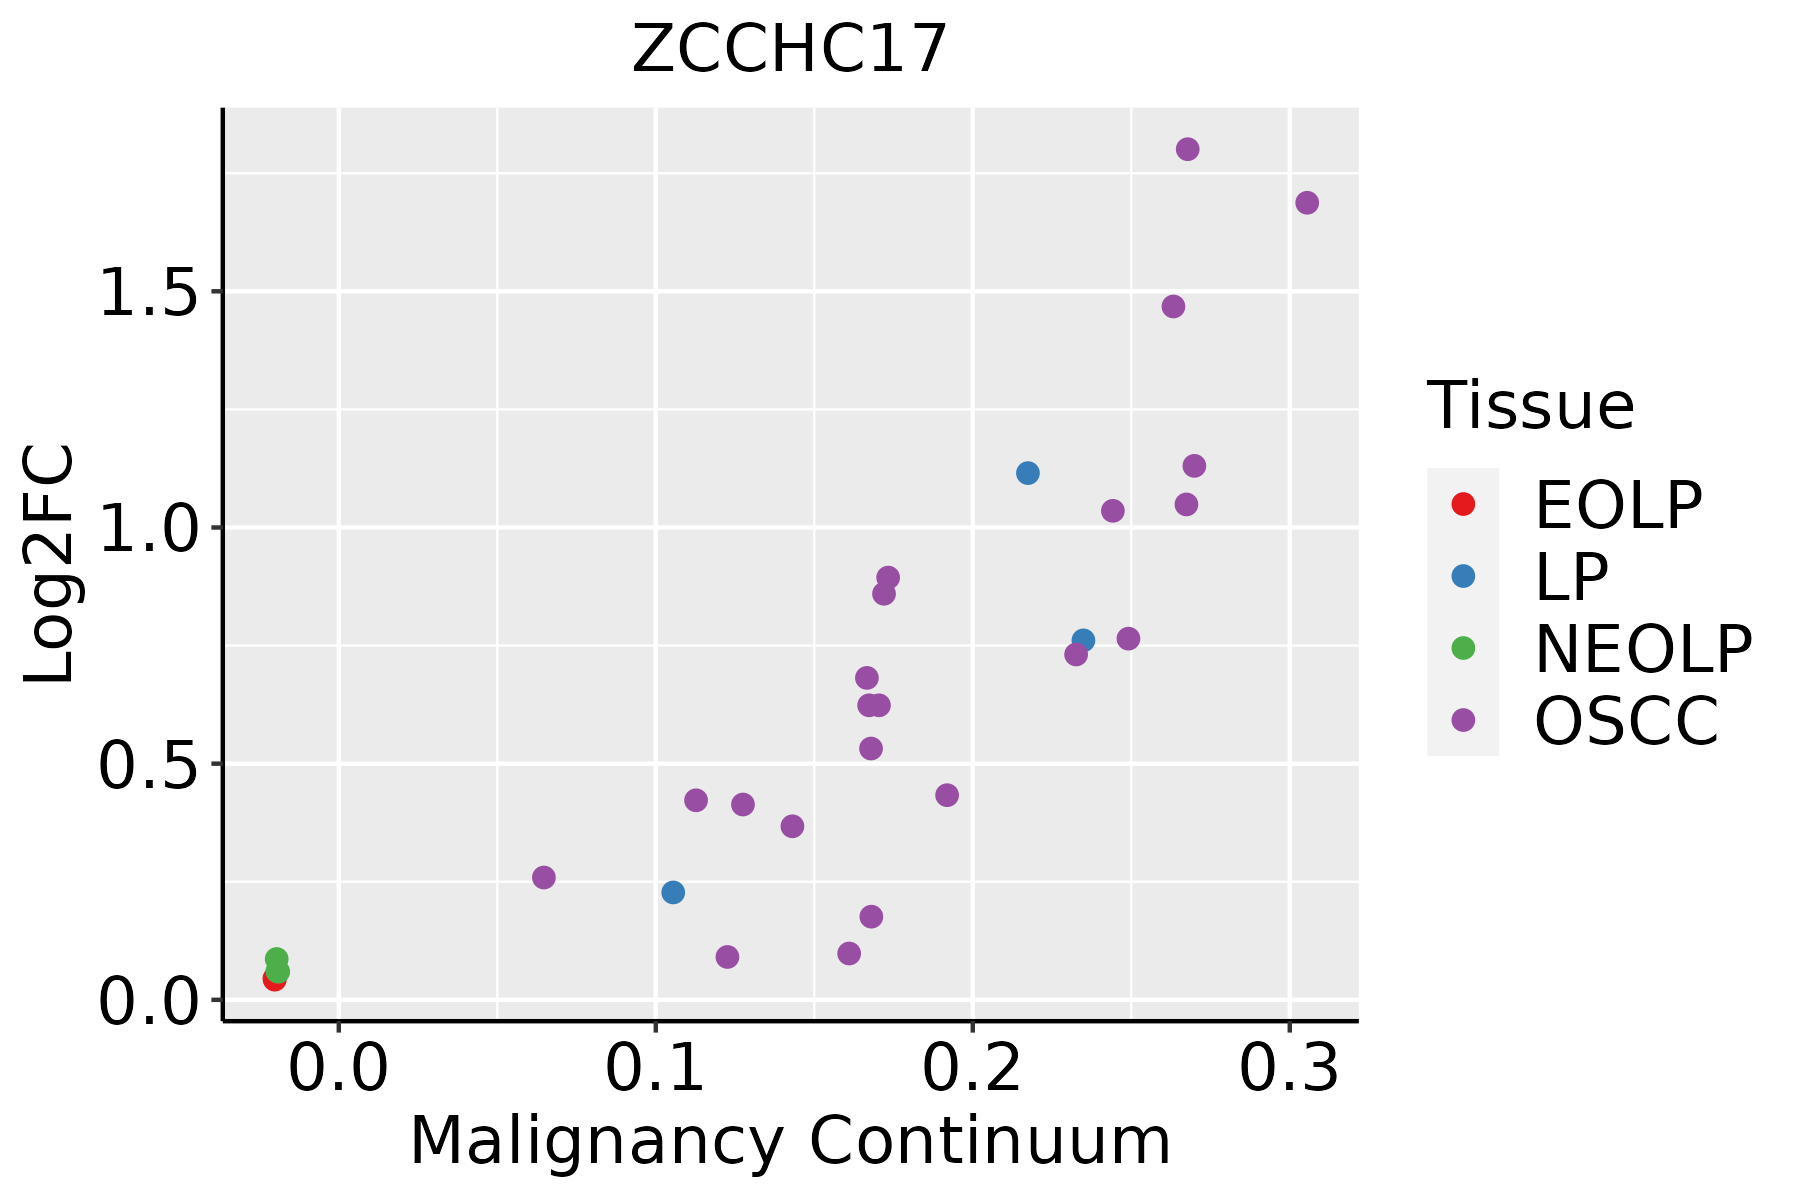
EOLP: Erosive Oral lichen planus
LP: leukoplakia
NEOLP: Non-erosive oral lichen planus
OSCC: Oral squamous cell carcinoma
SkinThe image shows the transcriptomic changes along malignancy continuum.log2FC in expression of this searched gene in stem-like cells from each diseased tissue sample relative to stem-like cells in normal samples in each tissue plotted against the malignancy continuum. Samples are colored based on if they are from different disease stage.
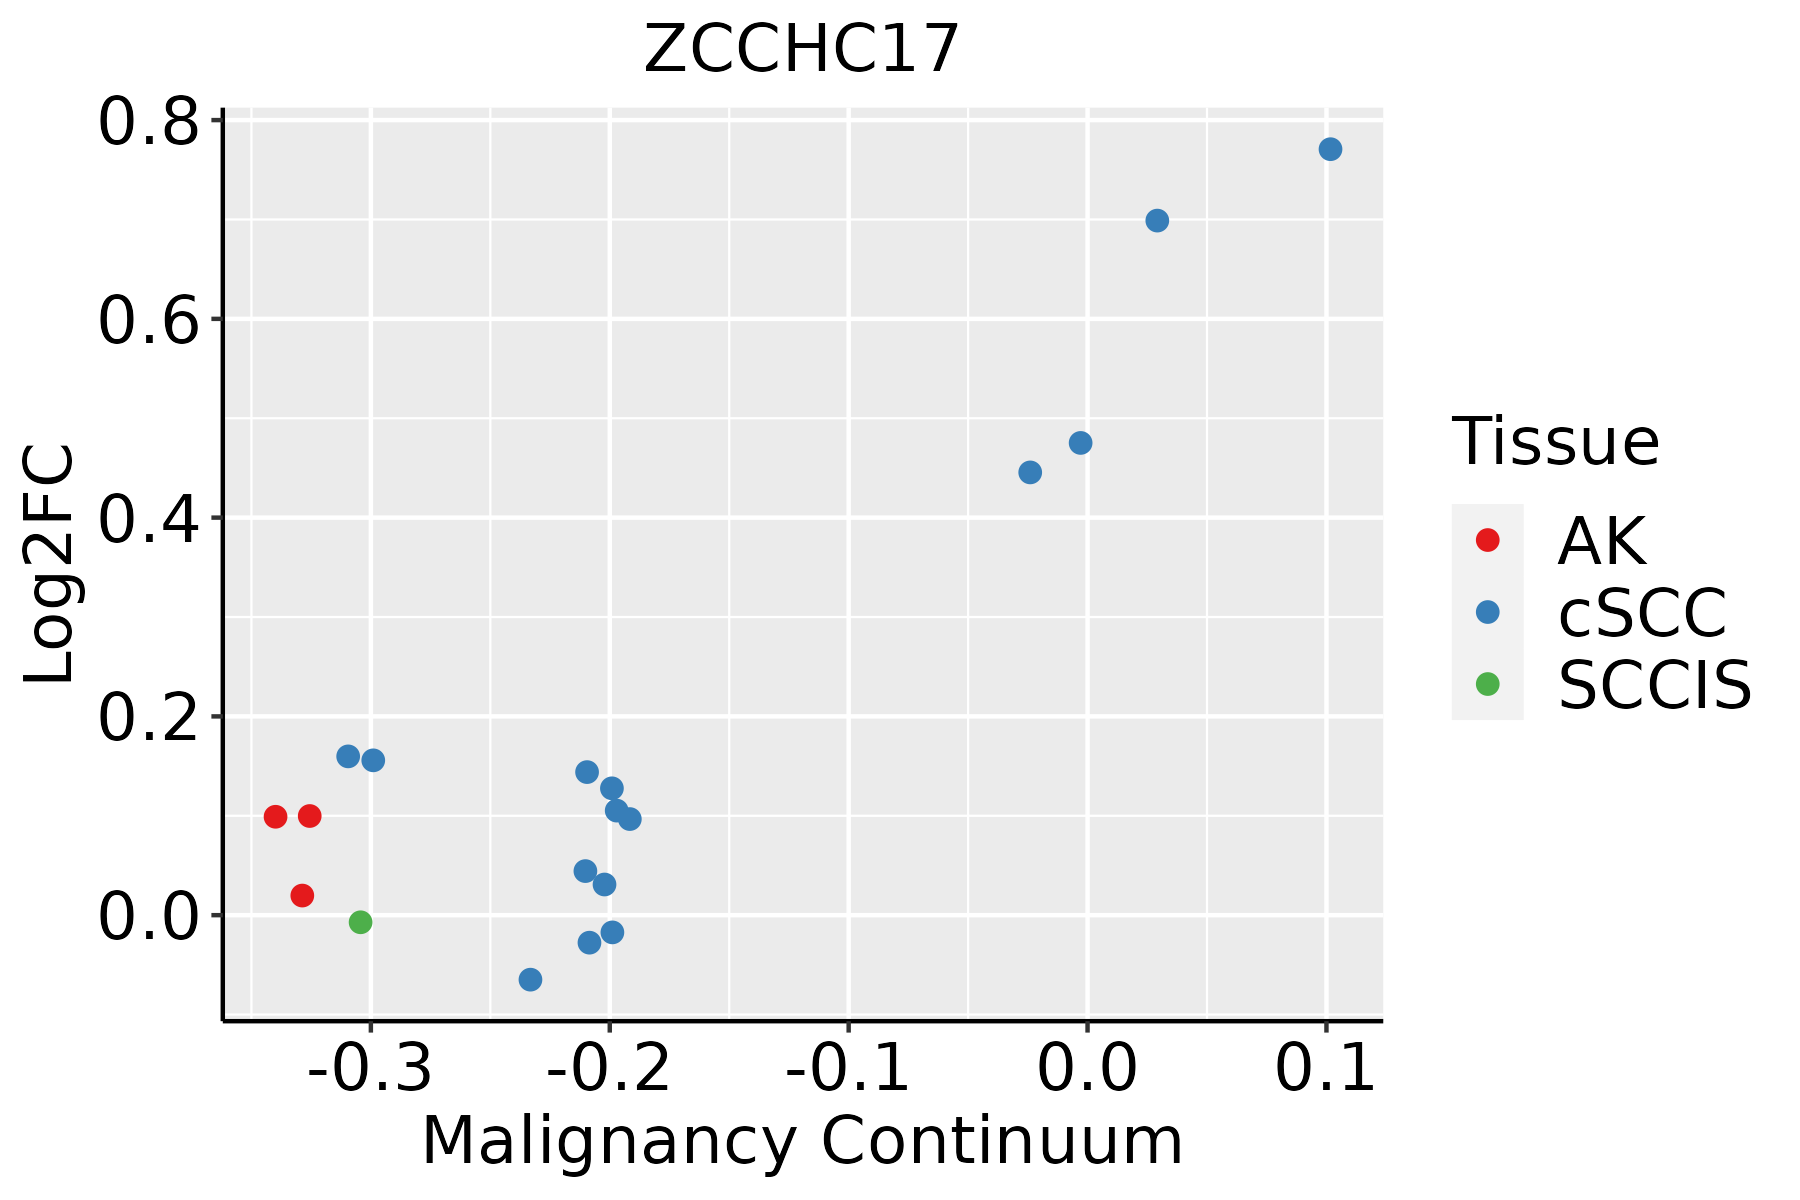
AK: Actinic keratosis
cSCC: Cutaneous squamous cell carcinoma
SCCIS:squamous cell carcinoma in situ
ThyroidThe image shows the transcriptomic changes along malignancy continuum.log2FC in expression of this searched gene in stem-like cells from each diseased tissue sample relative to stem-like cells in normal samples in each tissue plotted against the malignancy continuum. Samples are colored based on if they are from different disease stage.ATC: Anaplastic thyroid cancer
HT: Hashimoto's thyroiditis
PTC: Papillary thyroid cancer
∗log2FC in expression of this searched gene in stem-like cells from each diseased tissue sample relative to stem-like cells in normal samples in each tissue plotted against the malignancy continuum. Samples are colored based on if they are from different disease stage.

Top

Malignant transformation related pathway analysis

check buttonFind out the enriched GO biological processes and KEGG pathways involved in transition from healthy to precancer to cancer
check button Figure of enriched GO biological processes.
TissueDisease StageEnriched GO biological Processes
ColorectumADGO analysis - Figure of enriched GO biological processes: Top 15 enriched GO BP terms are showed in the bar plot of each disease state in each tissue. Each row represents a significant GO biological process which is colored according to the -log10(p.adjust).
ColorectumSERGO analysis - Figure of enriched GO biological processes: Top 15 enriched GO BP terms are showed in the bar plot of each disease state in each tissue. Each row represents a significant GO biological process which is colored according to the -log10(p.adjust).
ColorectumMSSGO analysis - Figure of enriched GO biological processes: Top 15 enriched GO BP terms are showed in the bar plot of each disease state in each tissue. Each row represents a significant GO biological process which is colored according to the -log10(p.adjust).
ColorectumMSI-HGO analysis - Figure of enriched GO biological processes: Top 15 enriched GO BP terms are showed in the bar plot of each disease state in each tissue. Each row represents a significant GO biological process which is colored according to the -log10(p.adjust).
ColorectumFAPGO analysis - Figure of enriched GO biological processes: Top 15 enriched GO BP terms are showed in the bar plot of each disease state in each tissue. Each row represents a significant GO biological process which is colored according to the -log10(p.adjust).
∗Top 15 enriched GO BP terms are showed in the bar plot of each disease state in each tissue. Each row represents a significant GO biological process which is colored according to the -log10(p.adjust).
Page: 1 2 3 4 5 6 7 8 9 

check button Enriched GO biological processes.
GO IDTissueDisease StageDescriptionGene RatioBg Ratiopvaluep.adjustCount
GO:0006401110EsophagusESCCRNA catabolic process204/8552278/187233.39e-215.66e-19204
GO:0034655110EsophagusESCCnucleobase-containing compound catabolic process272/8552407/187232.92e-182.90e-16272
GO:004670018EsophagusESCCheterocycle catabolic process286/8552445/187231.12e-157.47e-14286
GO:004427019EsophagusESCCcellular nitrogen compound catabolic process288/8552451/187233.03e-151.79e-13288
GO:001943918EsophagusESCCaromatic compound catabolic process295/8552467/187231.09e-145.98e-13295
GO:190136118EsophagusESCCorganic cyclic compound catabolic process307/8552495/187239.99e-144.80e-12307
GO:0009895111EsophagusESCCnegative regulation of catabolic process201/8552320/187233.88e-101.05e-08201
GO:004348719EsophagusESCCregulation of RNA stability117/8552170/187237.91e-101.94e-08117
GO:0031330111EsophagusESCCnegative regulation of cellular catabolic process166/8552262/187235.17e-091.08e-07166
GO:190236916EsophagusESCCnegative regulation of RNA catabolic process46/855275/187234.54e-031.78e-0246
GO:190136111LiverCirrhoticorganic cyclic compound catabolic process213/4634495/187231.58e-193.67e-17213
GO:001943911LiverCirrhoticaromatic compound catabolic process202/4634467/187236.93e-191.28e-16202
GO:004427011LiverCirrhoticcellular nitrogen compound catabolic process195/4634451/187232.99e-184.94e-16195
GO:004670011LiverCirrhoticheterocycle catabolic process192/4634445/187237.17e-181.12e-15192
GO:003465511LiverCirrhoticnucleobase-containing compound catabolic process171/4634407/187239.07e-159.33e-13171
GO:000640111LiverCirrhoticRNA catabolic process126/4634278/187234.64e-144.10e-12126
GO:000989512LiverCirrhoticnegative regulation of catabolic process121/4634320/187231.21e-073.39e-06121
GO:004348711LiverCirrhoticregulation of RNA stability73/4634170/187231.44e-073.87e-0673
GO:003133012LiverCirrhoticnegative regulation of cellular catabolic process101/4634262/187234.57e-071.05e-05101
GO:190236911LiverCirrhoticnegative regulation of RNA catabolic process29/463475/187235.24e-032.69e-0229
Page: 1 2 3 4 5 

check button Enriched KEGG pathways.
Pathway IDTissueDisease StageDescriptionGene RatioBg Ratiopvaluep.adjustqvalueCount
Page: 1 

Top

Cell-cell communication analysis

check buttonIdentification of potential cell-cell interactions between two cell types and their ligand-receptor pairs for different disease states
LigandReceptorLRpairPathwayTissueDisease Stage
Page: 1 

Top

Single-cell gene regulatory network inference analysis

check buttonFind out the significant the regulons (TFs) and the target genes of each regulon across cell types for different disease states
TFCell TypeTissueDisease StageTarget GeneRSSRegulon Activity
∗The dot plots of a searched regulon are shown for all cell subpopulations in each disease state of each tissue based on the regulon specific score inferred using pySCENIC and by calculating the average expression.
Page: 1 

Top

Somatic mutation of malignant transformation related genes

check buttonAnnotation of somatic variants for genes involved in malignant transformation
Hugo SymbolVariant ClassVariant ClassificationdbSNP RSHGVScHGVSpHGVSp ShortSWISSPROTBIOTYPESIFTPolyPhenTumor Sample BarcodeTissueHistologySexAgeStageTherapy TypesDrugsOutcome
ZCCHC17SNVMissense_Mutationc.617N>Cp.Arg206Thrp.R206Tprotein_codingdeleterious_low_confidence(0.01)possibly_damaging(0.634)TCGA-IR-A3LA-01Cervixcervical & endocervical cancerFemale<65I/IIChemotherapycisplatinCR
ZCCHC17SNVMissense_Mutationnovelc.323N>Gp.Ser108Cysp.S108Cprotein_codingdeleterious(0)probably_damaging(0.994)TCGA-VS-A9UH-01Cervixcervical & endocervical cancerFemale<65I/IIChemotherapycisplatinCR
ZCCHC17SNVMissense_Mutationnovelc.214T>Cp.Ser72Prop.S72Pprotein_codingdeleterious(0)probably_damaging(0.956)TCGA-AZ-4315-01Colorectumcolon adenocarcinomaMale<65I/IIUnknownUnknownSD
ZCCHC17SNVMissense_Mutationrs762726112c.203N>Ap.Arg68Glnp.R68Qprotein_codingtolerated(0.33)benign(0.024)TCGA-EI-6917-01Colorectumrectum adenocarcinomaMale<65III/IVChemotherapy5fluorouracil+oxaciplatina+l-folinianSD
ZCCHC17SNVMissense_Mutationnovelc.782N>Gp.His261Argp.H261Rprotein_codingdeleterious_low_confidence(0)benign(0)TCGA-A5-A0G2-01Endometriumuterine corpus endometrioid carcinomaFemale<65III/IVUnknownUnknownSD
ZCCHC17SNVMissense_Mutationc.226N>Cp.Val76Leup.V76Lprotein_codingtolerated(0.08)possibly_damaging(0.749)TCGA-A5-A0GI-01Endometriumuterine corpus endometrioid carcinomaFemale<65I/IIUnknownUnknownSD
ZCCHC17SNVMissense_Mutationrs762726112c.203N>Ap.Arg68Glnp.R68Qprotein_codingtolerated(0.33)benign(0.024)TCGA-AX-A05Z-01Endometriumuterine corpus endometrioid carcinomaFemale<65III/IVChemotherapyadriamycinSD
ZCCHC17SNVMissense_Mutationrs762726112c.203N>Ap.Arg68Glnp.R68Qprotein_codingtolerated(0.33)benign(0.024)TCGA-BS-A0UV-01Endometriumuterine corpus endometrioid carcinomaFemale<65III/IVUnknownUnknownSD
ZCCHC17SNVMissense_Mutationnovelc.329N>Cp.Lys110Thrp.K110Tprotein_codingdeleterious(0)probably_damaging(0.987)TCGA-EO-A22R-01Endometriumuterine corpus endometrioid carcinomaFemale<65I/IIUnknownUnknownSD
ZCCHC17SNVMissense_Mutationrs776735412c.194N>Cp.Leu65Prop.L65Pprotein_codingdeleterious(0)probably_damaging(1)TCGA-EY-A215-01Endometriumuterine corpus endometrioid carcinomaFemale<65I/IIUnknownUnknownSD
Page: 1 2 

Top

Related drugs of malignant transformation related genes

check buttonIdentification of chemicals and drugs interact with genes involved in malignant transfromation
(DGIdb 4.0)
Entrez IDSymbolCategoryInteraction TypesDrug Claim NameDrug NamePMIDs
Page: 1