Schematic overview of the cellular and molecular mechanisms involved in the cancer progression, including the proposed cellular and molecular mechanisms in cancer cells trajectory. AT1: alveolar type 1 cells; AT2: alveolar type 2 cells; AAH: atypical adenomatous hyperplasia; AIS: adenocarcinoma in situ; MIA: minimally invasive adenocarcinoma; IA: invasive adenocarcinoma; EMT: epithelial-mesenchymal transition

Home

Download

Statistics

Help

Contact

Center for Computational Systems Medicine
leaf

Gene summary

leaf

Malignant transformation analysis

leaf

Malignant transformation related pathway analysis

leaf

Cell-cell communication analysis

leaf

Single-cell gene regulatory network inference analysis

leaf

Somatic mutation of malignant transformation related genes

leaf

Related drugs of malignant transformation related genes

Gene: ZC3H7B

Gene summary for ZC3H7B

check button Gene summary.

Gene informationSpeciesHuman
Gene symbol

ZC3H7B

Gene ID

23264

Gene namezinc finger CCCH-type containing 7B
Gene AliasROXAN1
Cytomap22q13.2
Gene Typeprotein-coding
GO ID

GO:0006139

UniProtAcc

Q9UGR2


Top

Malignant transformation analysis

check button Identification of the aberrant gene expression in precancerous and cancerous lesions by comparing the gene expression of stem-like cells in diseased tissues with normal stem cells
check button Malignant transformation involving gene list.
Entrez IDSymbolReplicatesSpeciesOrganTissueAdj P-valueLog2FCMalignancy
23264ZC3H7BHTA11_1938_2000001011HumanColorectumAD2.41e-043.75e-01-0.0811
23264ZC3H7BHTA11_347_2000001011HumanColorectumAD2.36e-083.93e-01-0.1954
23264ZC3H7BHTA11_696_2000001011HumanColorectumAD7.55e-103.83e-01-0.1464
23264ZC3H7BHTA11_866_2000001011HumanColorectumAD4.02e-031.98e-01-0.1001
23264ZC3H7BHTA11_1391_2000001011HumanColorectumAD1.99e-075.88e-01-0.059
23264ZC3H7BHTA11_866_3004761011HumanColorectumAD8.83e-084.33e-010.096
23264ZC3H7BHTA11_7696_3000711011HumanColorectumAD1.77e-135.12e-010.0674
23264ZC3H7BHTA11_99999970781_79442HumanColorectumMSS1.43e-043.46e-010.294
23264ZC3H7BHTA11_99999971662_82457HumanColorectumMSS3.36e-217.20e-010.3859
23264ZC3H7BHTA11_99999973899_84307HumanColorectumMSS1.76e-066.83e-010.2585
23264ZC3H7BHTA11_99999974143_84620HumanColorectumMSS8.31e-053.41e-010.3005
23264ZC3H7BA015-C-203HumanColorectumFAP1.31e-02-1.88e-01-0.1294
23264ZC3H7BA001-C-108HumanColorectumFAP4.22e-02-1.98e-01-0.0272
23264ZC3H7BA002-C-205HumanColorectumFAP5.78e-04-1.51e-01-0.1236
23264ZC3H7BA002-C-114HumanColorectumFAP1.79e-03-2.18e-01-0.1561
23264ZC3H7BA015-C-104HumanColorectumFAP5.65e-06-2.32e-01-0.1899
23264ZC3H7BA002-C-016HumanColorectumFAP1.51e-05-2.08e-010.0521
23264ZC3H7BA002-C-116HumanColorectumFAP1.50e-05-1.97e-01-0.0452
23264ZC3H7BA018-E-020HumanColorectumFAP5.52e-03-1.65e-01-0.2034
23264ZC3H7BF034HumanColorectumFAP4.02e-03-1.70e-01-0.0665
Page: 1 2 3 4 5 

check button Transcriptomic changes along malignancy continuum.
TissueExpression DynamicsAbbreviation
Colorectum (GSE201348)The image shows the transcriptomic changes along malignancy continuum.log2FC in expression of this searched gene in stem-like cells from each diseased tissue sample relative to stem-like cells in normal samples in each tissue plotted against the malignancy continuum. Samples are colored based on if they are from different disease stage.FAP: Familial adenomatous polyposis
CRC: Colorectal cancer
Colorectum (HTA11)The image shows the transcriptomic changes along malignancy continuum.log2FC in expression of this searched gene in stem-like cells from each diseased tissue sample relative to stem-like cells in normal samples in each tissue plotted against the malignancy continuum. Samples are colored based on if they are from different disease stage.AD: Adenomas
SER: Sessile serrated lesions
MSI-H: Microsatellite-high colorectal cancer
MSS: Microsatellite stable colorectal cancer
EsophagusThe image shows the transcriptomic changes along malignancy continuum.log2FC in expression of this searched gene in stem-like cells from each diseased tissue sample relative to stem-like cells in normal samples in each tissue plotted against the malignancy continuum. Samples are colored based on if they are from different disease stage.
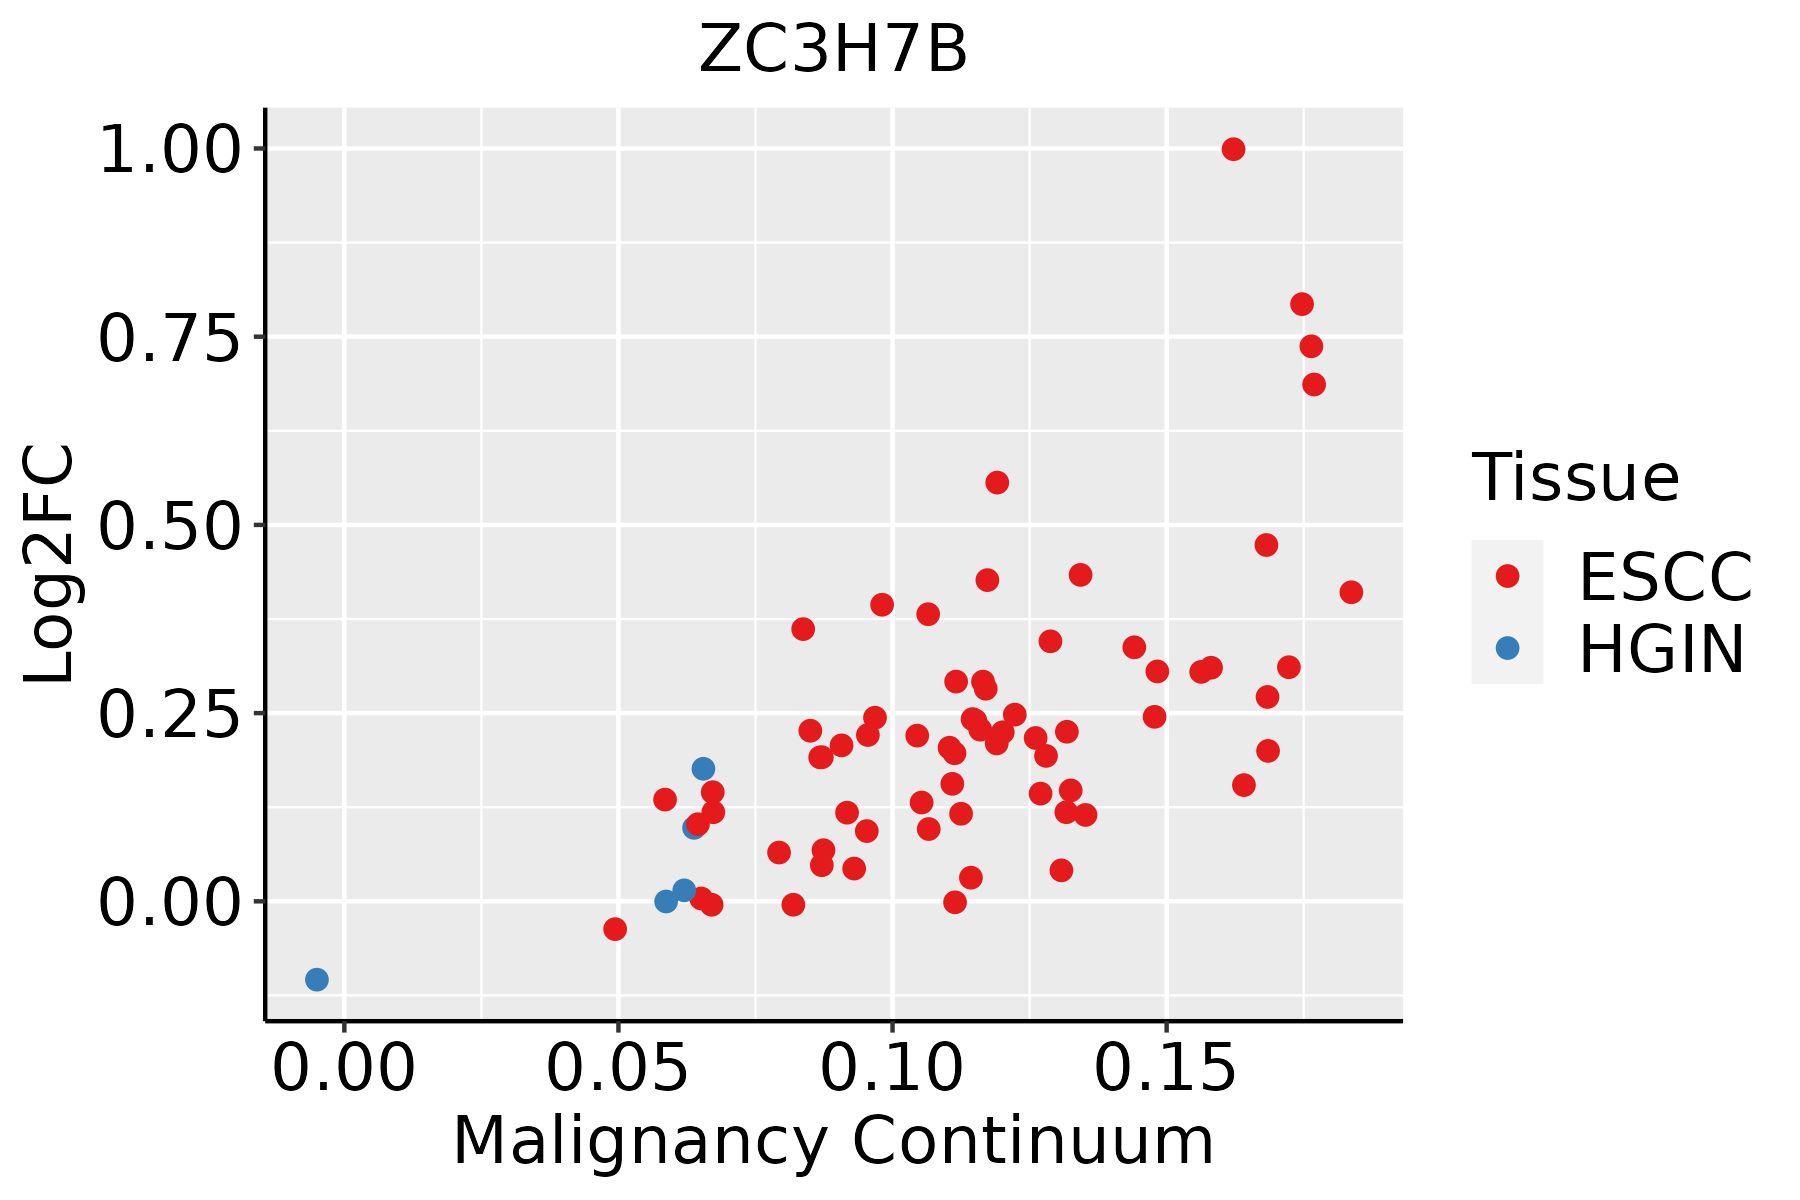
ESCC: Esophageal squamous cell carcinoma
HGIN: High-grade intraepithelial neoplasias
LGIN: Low-grade intraepithelial neoplasias
Oral CavityThe image shows the transcriptomic changes along malignancy continuum.log2FC in expression of this searched gene in stem-like cells from each diseased tissue sample relative to stem-like cells in normal samples in each tissue plotted against the malignancy continuum. Samples are colored based on if they are from different disease stage.
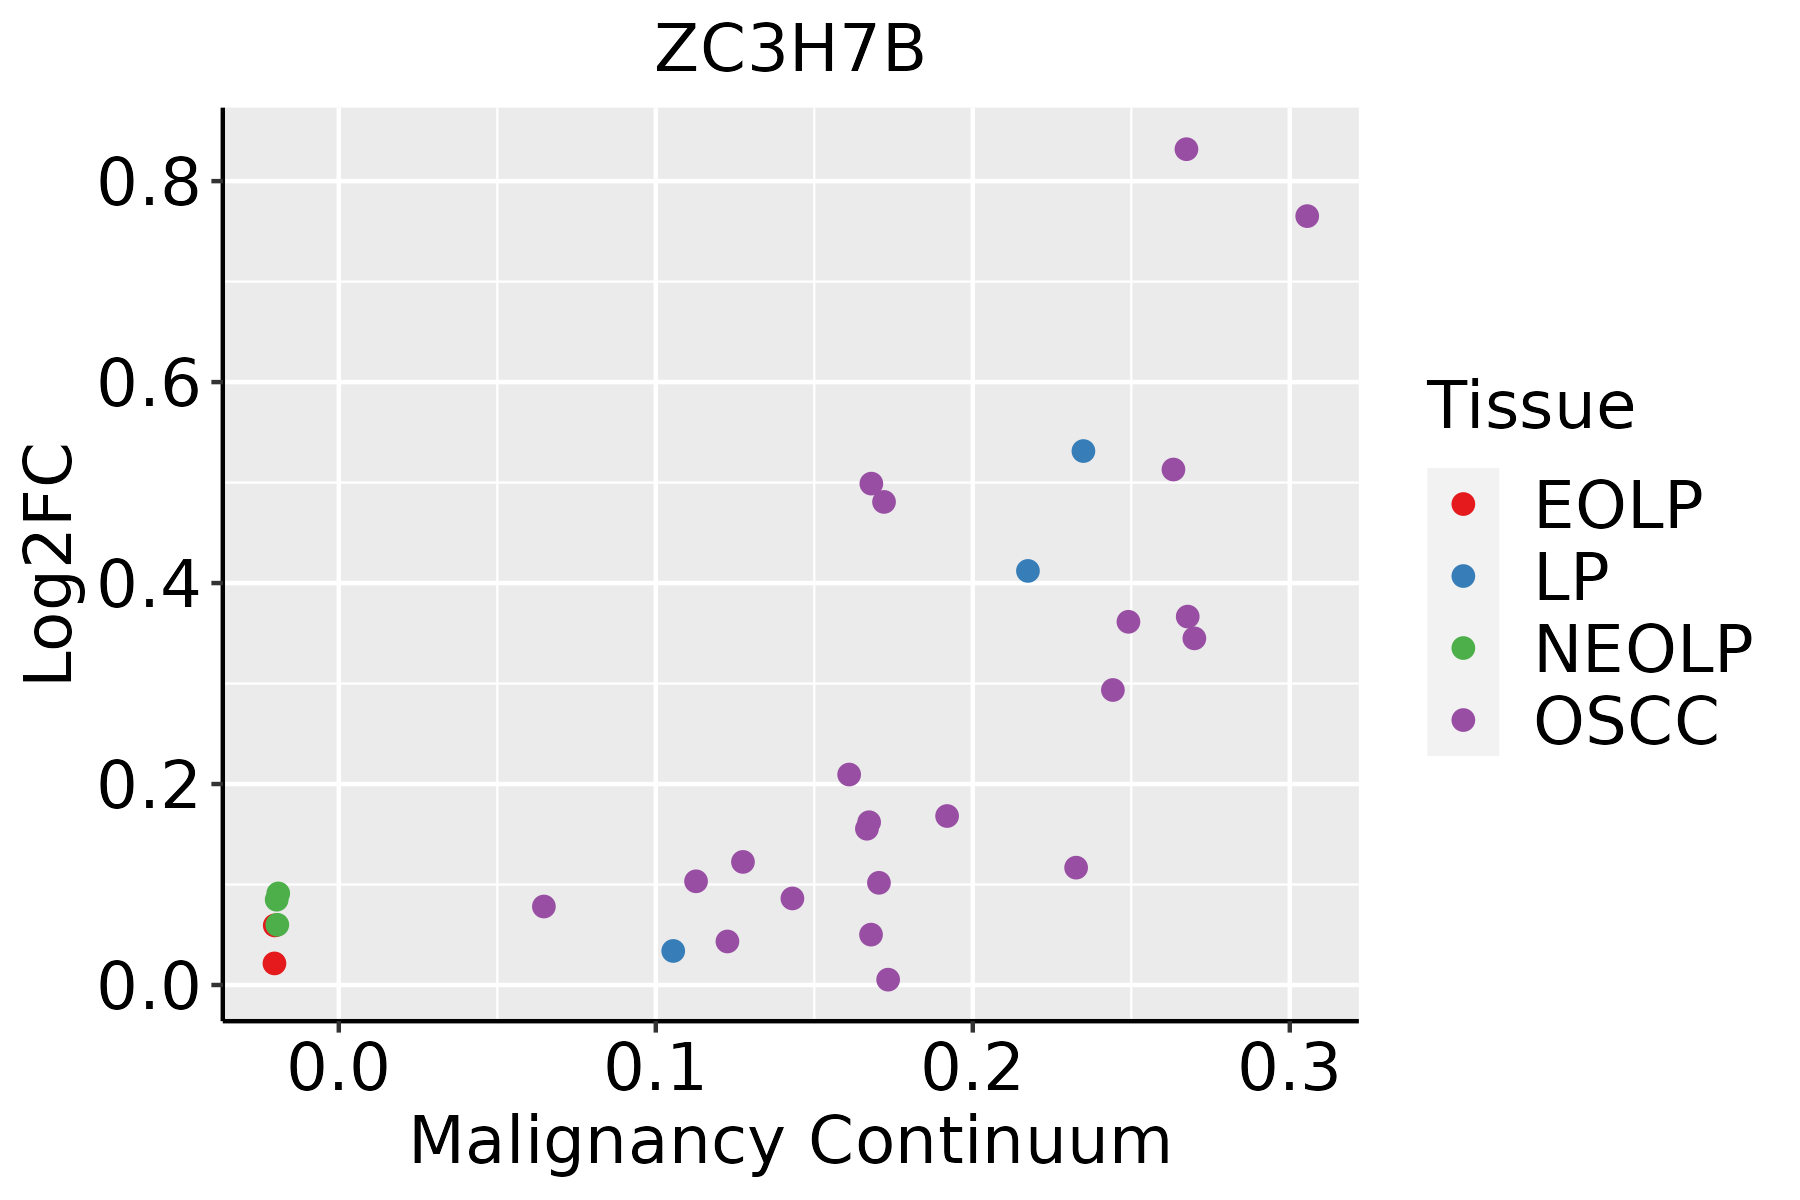
EOLP: Erosive Oral lichen planus
LP: leukoplakia
NEOLP: Non-erosive oral lichen planus
OSCC: Oral squamous cell carcinoma
ThyroidThe image shows the transcriptomic changes along malignancy continuum.log2FC in expression of this searched gene in stem-like cells from each diseased tissue sample relative to stem-like cells in normal samples in each tissue plotted against the malignancy continuum. Samples are colored based on if they are from different disease stage.
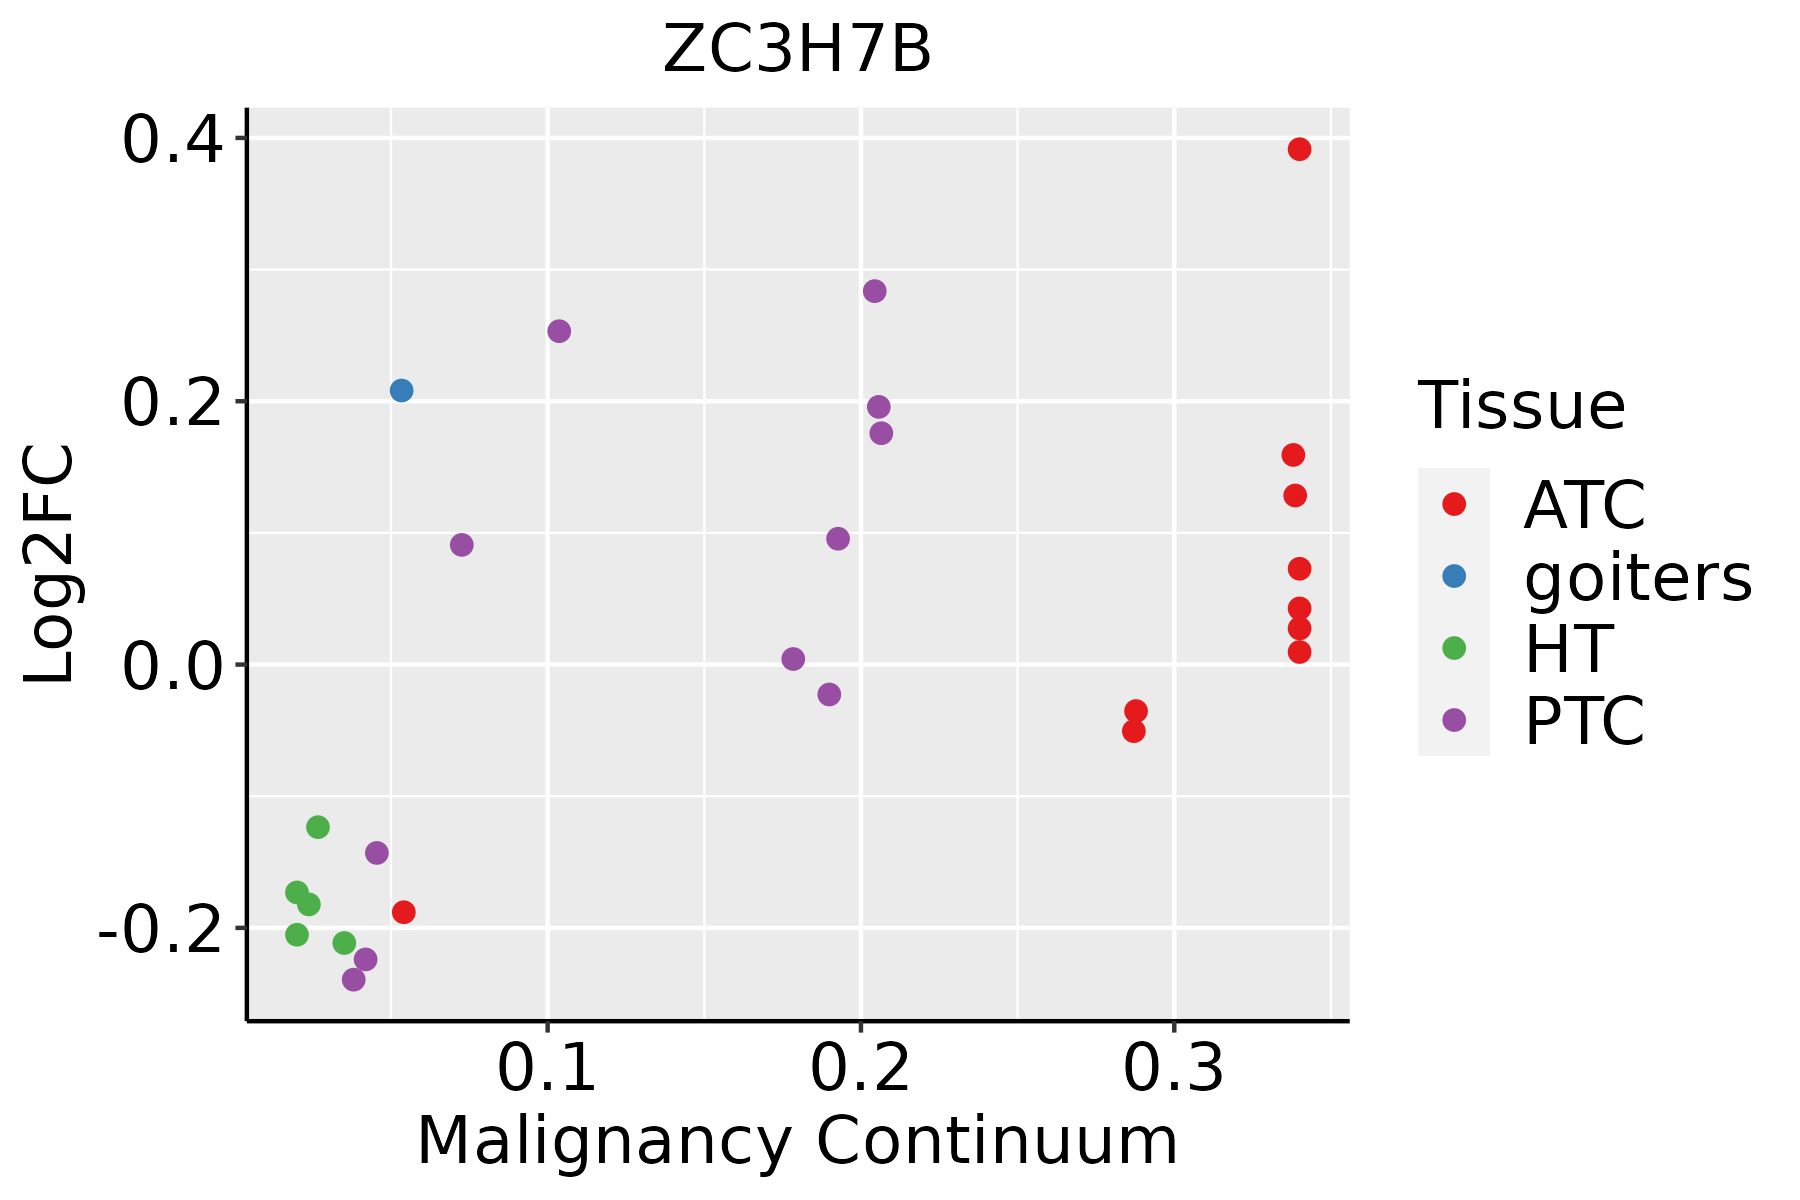
ATC: Anaplastic thyroid cancer
HT: Hashimoto's thyroiditis
PTC: Papillary thyroid cancer
∗log2FC in expression of this searched gene in stem-like cells from each diseased tissue sample relative to stem-like cells in normal samples in each tissue plotted against the malignancy continuum. Samples are colored based on if they are from different disease stage.

Top

Malignant transformation related pathway analysis

check buttonFind out the enriched GO biological processes and KEGG pathways involved in transition from healthy to precancer to cancer
check button Figure of enriched GO biological processes.
TissueDisease StageEnriched GO biological Processes
ColorectumADGO analysis - Figure of enriched GO biological processes: Top 15 enriched GO BP terms are showed in the bar plot of each disease state in each tissue. Each row represents a significant GO biological process which is colored according to the -log10(p.adjust).
ColorectumSERGO analysis - Figure of enriched GO biological processes: Top 15 enriched GO BP terms are showed in the bar plot of each disease state in each tissue. Each row represents a significant GO biological process which is colored according to the -log10(p.adjust).
ColorectumMSSGO analysis - Figure of enriched GO biological processes: Top 15 enriched GO BP terms are showed in the bar plot of each disease state in each tissue. Each row represents a significant GO biological process which is colored according to the -log10(p.adjust).
ColorectumMSI-HGO analysis - Figure of enriched GO biological processes: Top 15 enriched GO BP terms are showed in the bar plot of each disease state in each tissue. Each row represents a significant GO biological process which is colored according to the -log10(p.adjust).
ColorectumFAPGO analysis - Figure of enriched GO biological processes: Top 15 enriched GO BP terms are showed in the bar plot of each disease state in each tissue. Each row represents a significant GO biological process which is colored according to the -log10(p.adjust).
∗Top 15 enriched GO BP terms are showed in the bar plot of each disease state in each tissue. Each row represents a significant GO biological process which is colored according to the -log10(p.adjust).
Page: 1 2 3 4 5 6 7 8 9 

check button Enriched GO biological processes.
GO IDTissueDisease StageDescriptionGene RatioBg Ratiopvaluep.adjustCount
GO:0035196ColorectumADproduction of miRNAs involved in gene silencing by miRNA20/391852/187232.87e-032.14e-0220
GO:0031050ColorectumADdsRNA processing20/391854/187234.76e-033.22e-0220
GO:0070918ColorectumADproduction of small RNA involved in gene silencing by RNA20/391854/187234.76e-033.22e-0220
GO:00351961ColorectumMSSproduction of miRNAs involved in gene silencing by miRNA19/346752/187231.66e-031.49e-0219
GO:00310501ColorectumMSSdsRNA processing19/346754/187232.74e-032.15e-0219
GO:00709181ColorectumMSSproduction of small RNA involved in gene silencing by RNA19/346754/187232.74e-032.15e-0219
GO:00351962ColorectumFAPproduction of miRNAs involved in gene silencing by miRNA19/262252/187234.16e-058.78e-0419
GO:00310502ColorectumFAPdsRNA processing19/262254/187237.56e-051.37e-0319
GO:00709182ColorectumFAPproduction of small RNA involved in gene silencing by RNA19/262254/187237.56e-051.37e-0319
GO:00351969EsophagusESCCproduction of miRNAs involved in gene silencing by miRNA37/855252/187231.75e-041.14e-0337
GO:00310508EsophagusESCCdsRNA processing38/855254/187232.08e-041.31e-0338
GO:00709188EsophagusESCCproduction of small RNA involved in gene silencing by RNA38/855254/187232.08e-041.31e-0338
GO:00310507Oral cavityOSCCdsRNA processing31/730554/187234.66e-031.87e-0231
GO:00709187Oral cavityOSCCproduction of small RNA involved in gene silencing by RNA31/730554/187234.66e-031.87e-0231
GO:00351968Oral cavityOSCCproduction of miRNAs involved in gene silencing by miRNA30/730552/187234.84e-031.92e-0230
GO:003519616ThyroidPTCproduction of miRNAs involved in gene silencing by miRNA28/596852/187238.33e-045.13e-0328
GO:003105010ThyroidPTCdsRNA processing28/596854/187231.79e-039.68e-0328
GO:007091810ThyroidPTCproduction of small RNA involved in gene silencing by RNA28/596854/187231.79e-039.68e-0328
GO:003519617ThyroidATCproduction of miRNAs involved in gene silencing by miRNA29/629352/187238.30e-044.57e-0329
GO:003105016ThyroidATCdsRNA processing29/629354/187231.84e-039.03e-0329
Page: 1 2 

check button Enriched KEGG pathways.
Pathway IDTissueDisease StageDescriptionGene RatioBg Ratiopvaluep.adjustqvalueCount
Page: 1 

Top

Cell-cell communication analysis

check buttonIdentification of potential cell-cell interactions between two cell types and their ligand-receptor pairs for different disease states
LigandReceptorLRpairPathwayTissueDisease Stage
Page: 1 

Top

Single-cell gene regulatory network inference analysis

check buttonFind out the significant the regulons (TFs) and the target genes of each regulon across cell types for different disease states
TFCell TypeTissueDisease StageTarget GeneRSSRegulon Activity
∗The dot plots of a searched regulon are shown for all cell subpopulations in each disease state of each tissue based on the regulon specific score inferred using pySCENIC and by calculating the average expression.
Page: 1 

Top

Somatic mutation of malignant transformation related genes

check buttonAnnotation of somatic variants for genes involved in malignant transformation
Hugo SymbolVariant ClassVariant ClassificationdbSNP RSHGVScHGVSpHGVSp ShortSWISSPROTBIOTYPESIFTPolyPhenTumor Sample BarcodeTissueHistologySexAgeStageTherapy TypesDrugsOutcome
ZC3H7BSNVMissense_Mutationrs367879359c.371N>Ap.Arg124Hisp.R124HQ9UGR2protein_codingdeleterious(0.05)possibly_damaging(0.725)TCGA-A8-A09Z-01Breastbreast invasive carcinomaFemale>=65I/IIUnknownUnknownSD
ZC3H7BSNVMissense_Mutationc.2446N>Ap.Glu816Lysp.E816KQ9UGR2protein_codingdeleterious(0.03)benign(0.125)TCGA-AC-A23H-01Breastbreast invasive carcinomaFemale>=65I/IIUnknownUnknownPD
ZC3H7BSNVMissense_Mutationc.2414G>Cp.Trp805Serp.W805SQ9UGR2protein_codingdeleterious(0)probably_damaging(0.962)TCGA-BH-A18V-01Breastbreast invasive carcinomaFemale<65I/IIUnknownUnknownSD
ZC3H7BSNVMissense_Mutationnovelc.2874N>Gp.Asp958Glup.D958EQ9UGR2protein_codingdeleterious_low_confidence(0.03)benign(0.038)TCGA-C8-A3M7-01Breastbreast invasive carcinomaFemale<65III/IVUnknownUnknownPD
ZC3H7BSNVMissense_Mutationc.2500G>Ap.Asp834Asnp.D834NQ9UGR2protein_codingdeleterious(0)probably_damaging(0.999)TCGA-EW-A1PD-01Breastbreast invasive carcinomaMale<65I/IIChemotherapydocetaxelSD
ZC3H7BSNVMissense_Mutationnovelc.49N>Tp.Ile17Phep.I17FQ9UGR2protein_codingdeleterious(0)probably_damaging(0.995)TCGA-OL-A66J-01Breastbreast invasive carcinomaFemale>=65I/IIUnknownUnknownSD
ZC3H7BSNVMissense_Mutationnovelc.1058C>Tp.Pro353Leup.P353LQ9UGR2protein_codingtolerated(0.13)benign(0.021)TCGA-EA-A410-01Cervixcervical & endocervical cancerFemale<65I/IIUnknownUnknownSD
ZC3H7BSNVMissense_Mutationc.2435N>Ap.Gly812Glup.G812EQ9UGR2protein_codingtolerated(0.58)benign(0.06)TCGA-EK-A2RB-01Cervixcervical & endocervical cancerFemale<65I/IIUnknownUnknownSD
ZC3H7BSNVMissense_Mutationnovelc.1384N>Ap.Glu462Lysp.E462KQ9UGR2protein_codingdeleterious(0.03)possibly_damaging(0.79)TCGA-FU-A3NI-01Cervixcervical & endocervical cancerFemale<65I/IIUnknownUnknownSD
ZC3H7BSNVMissense_Mutationc.1900N>Tp.Ala634Serp.A634SQ9UGR2protein_codingdeleterious(0.02)benign(0.33)TCGA-JW-A5VL-01Cervixcervical & endocervical cancerFemale<65I/IIUnknownUnknownSD
Page: 1 2 3 4 5 6 7 8 9 10 

Top

Related drugs of malignant transformation related genes

check buttonIdentification of chemicals and drugs interact with genes involved in malignant transfromation
(DGIdb 4.0)
Entrez IDSymbolCategoryInteraction TypesDrug Claim NameDrug NamePMIDs
Page: 1