
|
|||||
|
 | |
| |
| |
| |
| |
| |
|
Gene: ZC3H6 |
Gene summary for ZC3H6 |
| Gene information | Species | Human | Gene symbol | ZC3H6 | Gene ID | 376940 |
| Gene name | zinc finger CCCH-type containing 6 | |
| Gene Alias | ZC3HDC6 | |
| Cytomap | 2q14.1 | |
| Gene Type | protein-coding | GO ID | GO:0006139 | UniProtAcc | P61129 |
Top |
Malignant transformation analysis |
| Identification of the aberrant gene expression in precancerous and cancerous lesions by comparing the gene expression of stem-like cells in diseased tissues with normal stem cells |
| Entrez ID | Symbol | Replicates | Species | Organ | Tissue | Adj P-value | Log2FC | Malignancy |
| 376940 | ZC3H6 | LZE20T | Human | Esophagus | ESCC | 1.51e-05 | 1.63e-01 | 0.0662 |
| 376940 | ZC3H6 | LZE22T | Human | Esophagus | ESCC | 3.36e-02 | 2.35e-01 | 0.068 |
| 376940 | ZC3H6 | LZE24T | Human | Esophagus | ESCC | 1.62e-03 | 2.01e-01 | 0.0596 |
| 376940 | ZC3H6 | P1T-E | Human | Esophagus | ESCC | 7.94e-07 | 3.20e-01 | 0.0875 |
| 376940 | ZC3H6 | P2T-E | Human | Esophagus | ESCC | 4.54e-23 | 3.77e-01 | 0.1177 |
| 376940 | ZC3H6 | P4T-E | Human | Esophagus | ESCC | 1.27e-09 | 3.12e-01 | 0.1323 |
| 376940 | ZC3H6 | P8T-E | Human | Esophagus | ESCC | 2.22e-07 | 1.10e-01 | 0.0889 |
| 376940 | ZC3H6 | P9T-E | Human | Esophagus | ESCC | 1.92e-05 | 1.76e-01 | 0.1131 |
| 376940 | ZC3H6 | P10T-E | Human | Esophagus | ESCC | 2.56e-22 | 4.56e-01 | 0.116 |
| 376940 | ZC3H6 | P12T-E | Human | Esophagus | ESCC | 4.64e-11 | 2.69e-01 | 0.1122 |
| 376940 | ZC3H6 | P15T-E | Human | Esophagus | ESCC | 8.58e-16 | 3.41e-01 | 0.1149 |
| 376940 | ZC3H6 | P16T-E | Human | Esophagus | ESCC | 1.24e-22 | 3.91e-01 | 0.1153 |
| 376940 | ZC3H6 | P17T-E | Human | Esophagus | ESCC | 1.03e-02 | 2.39e-01 | 0.1278 |
| 376940 | ZC3H6 | P20T-E | Human | Esophagus | ESCC | 2.49e-05 | 1.75e-01 | 0.1124 |
| 376940 | ZC3H6 | P21T-E | Human | Esophagus | ESCC | 3.60e-12 | 3.32e-01 | 0.1617 |
| 376940 | ZC3H6 | P22T-E | Human | Esophagus | ESCC | 2.86e-06 | 1.24e-01 | 0.1236 |
| 376940 | ZC3H6 | P23T-E | Human | Esophagus | ESCC | 2.85e-12 | 3.74e-01 | 0.108 |
| 376940 | ZC3H6 | P24T-E | Human | Esophagus | ESCC | 2.13e-11 | 2.64e-01 | 0.1287 |
| 376940 | ZC3H6 | P26T-E | Human | Esophagus | ESCC | 9.15e-20 | 5.03e-01 | 0.1276 |
| 376940 | ZC3H6 | P27T-E | Human | Esophagus | ESCC | 1.19e-10 | 2.21e-01 | 0.1055 |
| Page: 1 2 3 4 |
| Tissue | Expression Dynamics | Abbreviation |
| Esophagus | 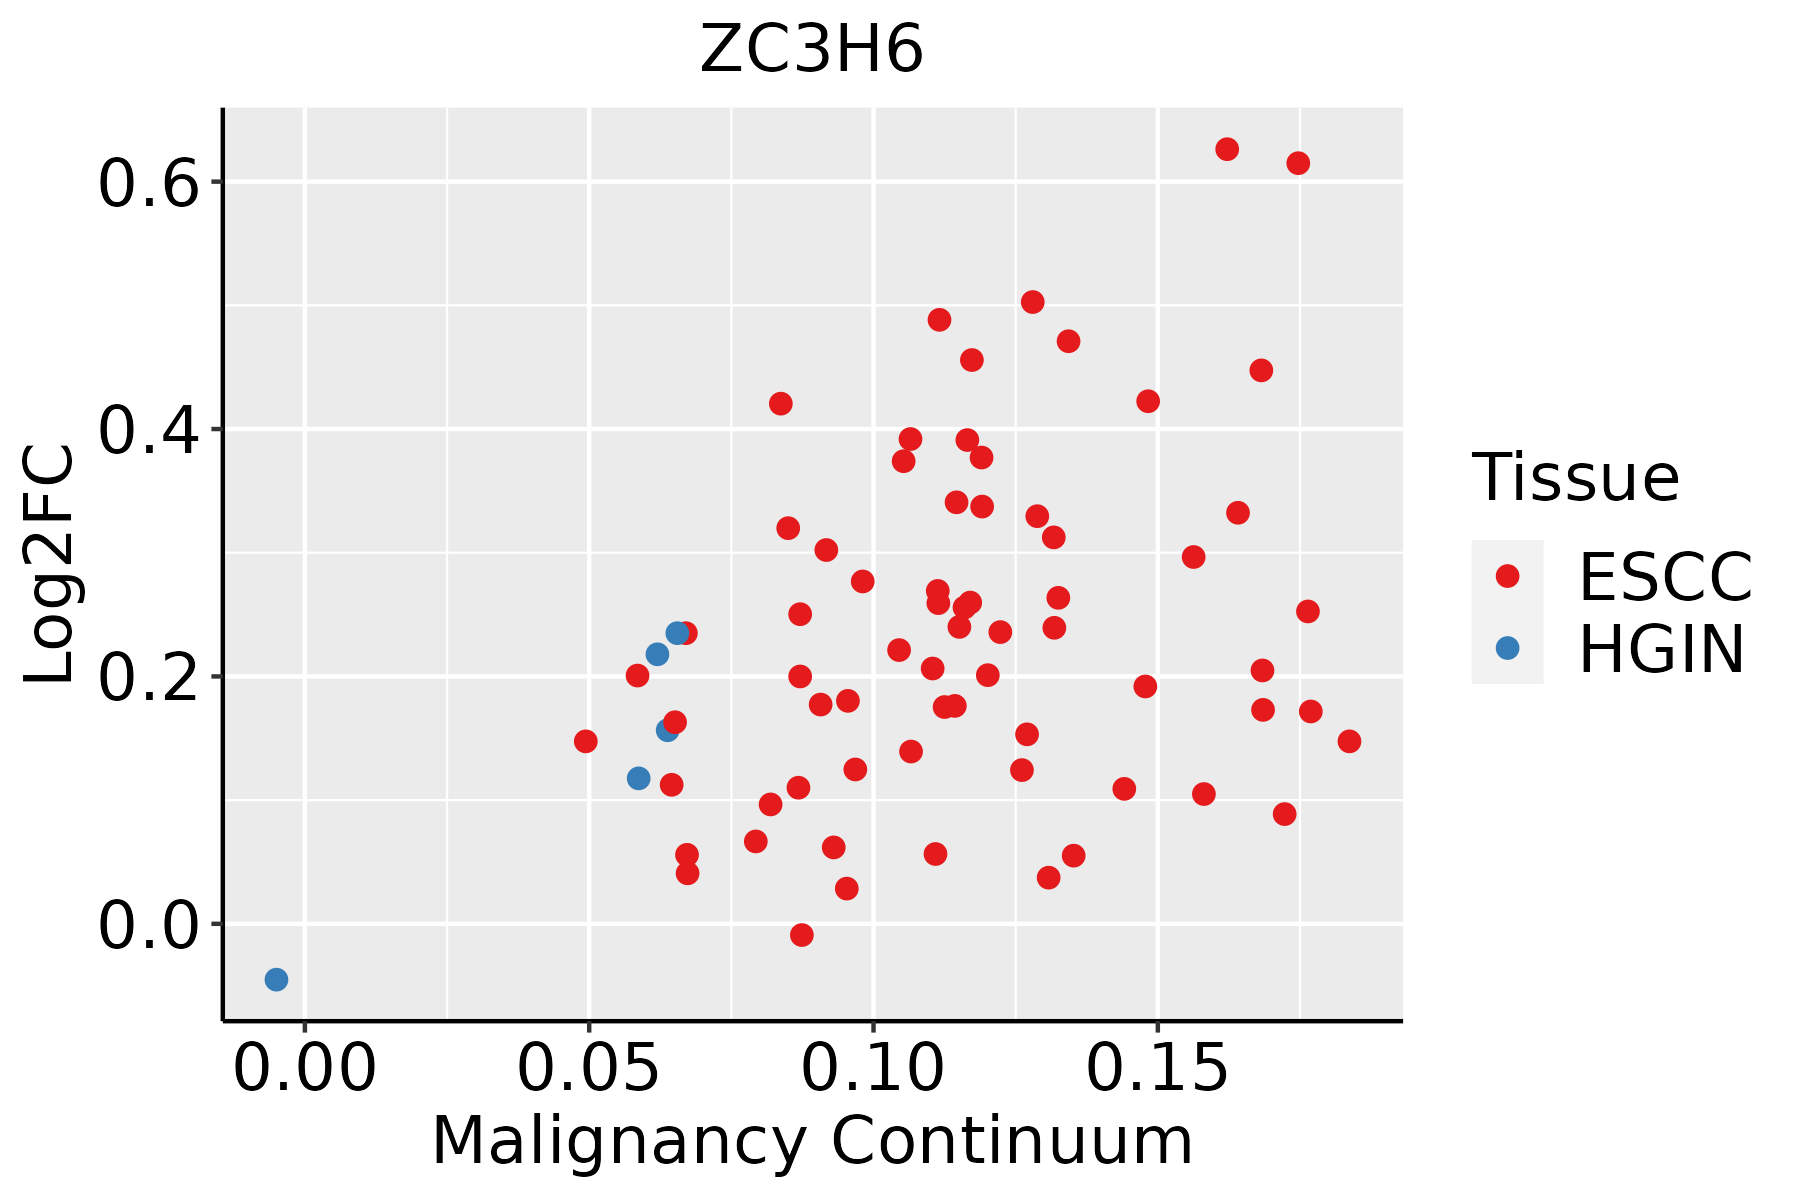 | ESCC: Esophageal squamous cell carcinoma |
| HGIN: High-grade intraepithelial neoplasias | ||
| LGIN: Low-grade intraepithelial neoplasias | ||
| Liver |  | HCC: Hepatocellular carcinoma |
| NAFLD: Non-alcoholic fatty liver disease | ||
| Thyroid | 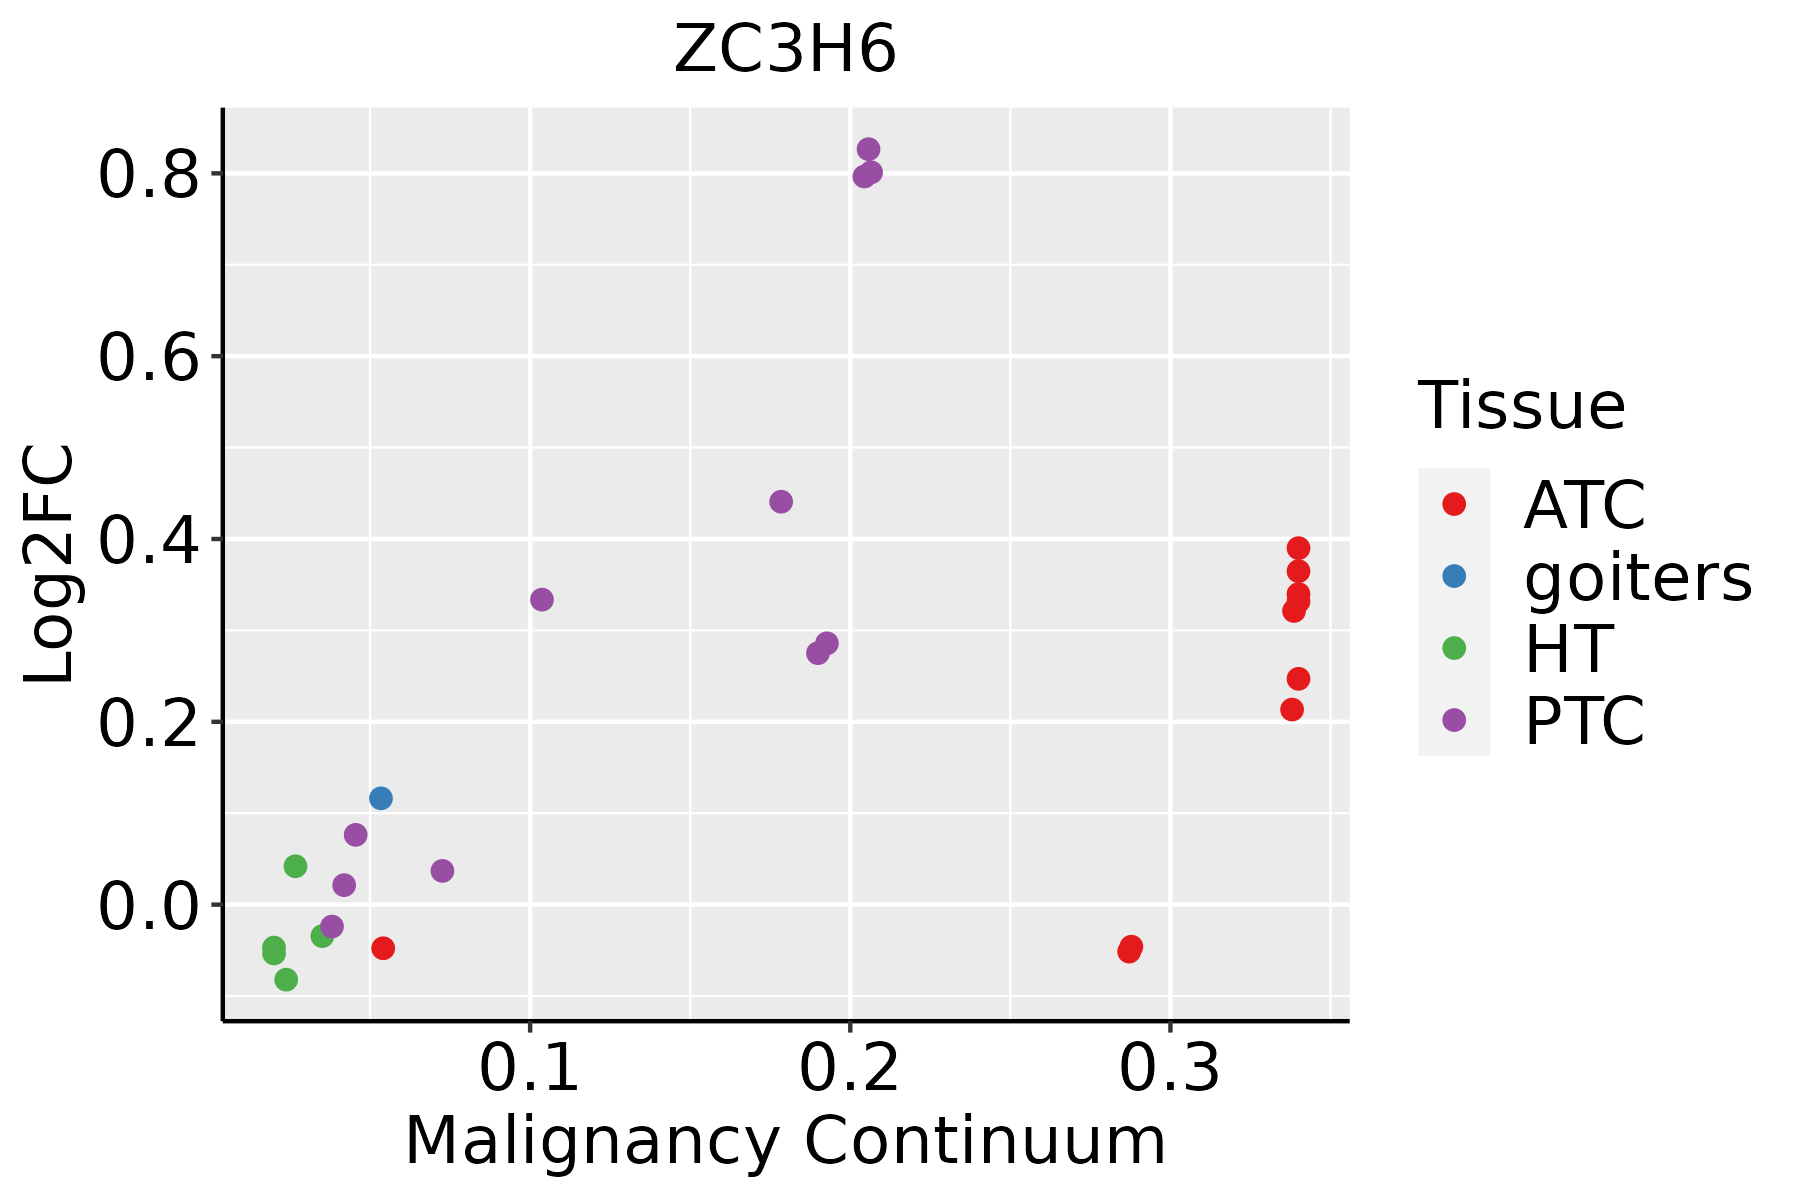 | ATC: Anaplastic thyroid cancer |
| HT: Hashimoto's thyroiditis | ||
| PTC: Papillary thyroid cancer |
| ∗log2FC in expression of this searched gene in stem-like cells from each diseased tissue sample relative to stem-like cells in normal samples in each tissue plotted against the malignancy continuum. Samples are colored based on if they are from different disease stage. |
Top |
Malignant transformation related pathway analysis |
| Find out the enriched GO biological processes and KEGG pathways involved in transition from healthy to precancer to cancer |
| Tissue | Disease Stage | Enriched GO biological Processes |
| Colorectum | AD |  |
| Colorectum | SER |  |
| Colorectum | MSS |  |
| Colorectum | MSI-H |  |
| Colorectum | FAP |  |
| ∗Top 15 enriched GO BP terms are showed in the bar plot of each disease state in each tissue. Each row represents a significant GO biological process which is colored according to the -log10(p.adjust). |
| Page: 1 2 3 4 5 6 7 8 9 |
| GO ID | Tissue | Disease Stage | Description | Gene Ratio | Bg Ratio | pvalue | p.adjust | Count |
| Page: 1 |
| Pathway ID | Tissue | Disease Stage | Description | Gene Ratio | Bg Ratio | pvalue | p.adjust | qvalue | Count |
| Page: 1 |
Top |
Cell-cell communication analysis |
| Identification of potential cell-cell interactions between two cell types and their ligand-receptor pairs for different disease states |
| Ligand | Receptor | LRpair | Pathway | Tissue | Disease Stage |
| Page: 1 |
Top |
Single-cell gene regulatory network inference analysis |
| Find out the significant the regulons (TFs) and the target genes of each regulon across cell types for different disease states |
| TF | Cell Type | Tissue | Disease Stage | Target Gene | RSS | Regulon Activity |
| ∗The dot plots of a searched regulon are shown for all cell subpopulations in each disease state of each tissue based on the regulon specific score inferred using pySCENIC and by calculating the average expression. |
| Page: 1 |
Top |
Somatic mutation of malignant transformation related genes |
| Annotation of somatic variants for genes involved in malignant transformation |
| Hugo Symbol | Variant Class | Variant Classification | dbSNP RS | HGVSc | HGVSp | HGVSp Short | SWISSPROT | BIOTYPE | SIFT | PolyPhen | Tumor Sample Barcode | Tissue | Histology | Sex | Age | Stage | Therapy Types | Drugs | Outcome |
| ZC3H6 | SNV | Missense_Mutation | c.496N>C | p.Asp166His | p.D166H | P61129 | protein_coding | deleterious(0.04) | probably_damaging(0.995) | TCGA-AC-A23H-01 | Breast | breast invasive carcinoma | Female | >=65 | I/II | Unknown | Unknown | PD | |
| ZC3H6 | SNV | Missense_Mutation | novel | c.996N>A | p.Phe332Leu | p.F332L | P61129 | protein_coding | tolerated(0.26) | benign(0.068) | TCGA-AN-A046-01 | Breast | breast invasive carcinoma | Female | >=65 | I/II | Unknown | Unknown | SD |
| ZC3H6 | SNV | Missense_Mutation | c.3439G>A | p.Asp1147Asn | p.D1147N | P61129 | protein_coding | deleterious(0) | probably_damaging(0.965) | TCGA-AR-A0TX-01 | Breast | breast invasive carcinoma | Female | <65 | I/II | Unknown | Unknown | SD | |
| ZC3H6 | SNV | Missense_Mutation | c.3092N>T | p.Ser1031Leu | p.S1031L | P61129 | protein_coding | deleterious(0) | benign(0.058) | TCGA-C8-A1HM-01 | Breast | breast invasive carcinoma | Female | >=65 | I/II | Chemotherapy | doxorubicin | CR | |
| ZC3H6 | SNV | Missense_Mutation | c.2511N>G | p.Phe837Leu | p.F837L | P61129 | protein_coding | tolerated(0.1) | benign(0.034) | TCGA-D8-A1JN-01 | Breast | breast invasive carcinoma | Female | >=65 | III/IV | Hormone Therapy | anastrozolum | SD | |
| ZC3H6 | SNV | Missense_Mutation | c.79G>A | p.Glu27Lys | p.E27K | P61129 | protein_coding | deleterious(0.03) | benign(0.355) | TCGA-D8-A27G-01 | Breast | breast invasive carcinoma | Female | >=65 | I/II | Unknown | Unknown | SD | |
| ZC3H6 | SNV | Missense_Mutation | novel | c.3364G>A | p.Gly1122Ser | p.G1122S | P61129 | protein_coding | tolerated(0.7) | benign(0) | TCGA-D8-A27V-01 | Breast | breast invasive carcinoma | Female | <65 | I/II | Hormone Therapy | tamoxiphen | SD |
| ZC3H6 | SNV | Missense_Mutation | c.2378N>A | p.Ser793Asn | p.S793N | P61129 | protein_coding | tolerated(0.1) | benign(0.15) | TCGA-E9-A1NH-01 | Breast | breast invasive carcinoma | Female | >=65 | I/II | Hormone Therapy | tamoxiphen | SD | |
| ZC3H6 | insertion | Frame_Shift_Ins | novel | c.2173_2174insA | p.Thr726AsnfsTer17 | p.T726Nfs*17 | P61129 | protein_coding | TCGA-A2-A0SW-01 | Breast | breast invasive carcinoma | Female | >=65 | III/IV | Hormone Therapy | arimidex | PD | ||
| ZC3H6 | insertion | Frame_Shift_Ins | novel | c.2519_2520insAGTTTTGTTATTTTTAAAGTTAATG | p.Leu841ValfsTer31 | p.L841Vfs*31 | P61129 | protein_coding | TCGA-A8-A09E-01 | Breast | breast invasive carcinoma | Female | >=65 | III/IV | Hormone Therapy | anastrozole | SD |
| Page: 1 2 3 4 5 6 7 8 9 10 11 12 13 14 |
Top |
Related drugs of malignant transformation related genes |
| Identification of chemicals and drugs interact with genes involved in malignant transfromation |
| (DGIdb 4.0) |
| Entrez ID | Symbol | Category | Interaction Types | Drug Claim Name | Drug Name | PMIDs |
| Page: 1 |

Copyright 2023-Present -The University of Texas Health Science Center at Houston |