
|
|||||
|
 | |
| |
| |
| |
| |
| |
|
Gene: ZC3H3 |
Gene summary for ZC3H3 |
| Gene information | Species | Human | Gene symbol | ZC3H3 | Gene ID | 23144 |
| Gene name | zinc finger CCCH-type containing 3 | |
| Gene Alias | SMICL | |
| Cytomap | 8q24.3 | |
| Gene Type | protein-coding | GO ID | GO:0006139 | UniProtAcc | Q8IXZ2 |
Top |
Malignant transformation analysis |
| Identification of the aberrant gene expression in precancerous and cancerous lesions by comparing the gene expression of stem-like cells in diseased tissues with normal stem cells |
| Entrez ID | Symbol | Replicates | Species | Organ | Tissue | Adj P-value | Log2FC | Malignancy |
| 23144 | ZC3H3 | LZE7T | Human | Esophagus | ESCC | 5.12e-03 | 1.67e-01 | 0.0667 |
| 23144 | ZC3H3 | LZE20T | Human | Esophagus | ESCC | 1.49e-06 | 2.22e-01 | 0.0662 |
| 23144 | ZC3H3 | LZE24T | Human | Esophagus | ESCC | 3.58e-18 | 2.76e-01 | 0.0596 |
| 23144 | ZC3H3 | P1T-E | Human | Esophagus | ESCC | 1.05e-05 | 3.20e-01 | 0.0875 |
| 23144 | ZC3H3 | P2T-E | Human | Esophagus | ESCC | 3.40e-20 | 3.21e-01 | 0.1177 |
| 23144 | ZC3H3 | P4T-E | Human | Esophagus | ESCC | 1.26e-05 | 1.49e-01 | 0.1323 |
| 23144 | ZC3H3 | P5T-E | Human | Esophagus | ESCC | 5.26e-10 | 2.24e-01 | 0.1327 |
| 23144 | ZC3H3 | P8T-E | Human | Esophagus | ESCC | 4.08e-10 | 2.23e-01 | 0.0889 |
| 23144 | ZC3H3 | P9T-E | Human | Esophagus | ESCC | 1.73e-11 | 3.04e-01 | 0.1131 |
| 23144 | ZC3H3 | P10T-E | Human | Esophagus | ESCC | 5.09e-07 | 1.14e-01 | 0.116 |
| 23144 | ZC3H3 | P11T-E | Human | Esophagus | ESCC | 2.37e-13 | 4.87e-01 | 0.1426 |
| 23144 | ZC3H3 | P12T-E | Human | Esophagus | ESCC | 1.27e-19 | 4.48e-01 | 0.1122 |
| 23144 | ZC3H3 | P15T-E | Human | Esophagus | ESCC | 4.65e-14 | 3.08e-01 | 0.1149 |
| 23144 | ZC3H3 | P16T-E | Human | Esophagus | ESCC | 1.33e-25 | 4.21e-01 | 0.1153 |
| 23144 | ZC3H3 | P17T-E | Human | Esophagus | ESCC | 4.59e-11 | 3.87e-01 | 0.1278 |
| 23144 | ZC3H3 | P20T-E | Human | Esophagus | ESCC | 1.65e-13 | 2.85e-01 | 0.1124 |
| 23144 | ZC3H3 | P21T-E | Human | Esophagus | ESCC | 2.42e-20 | 3.17e-01 | 0.1617 |
| 23144 | ZC3H3 | P22T-E | Human | Esophagus | ESCC | 4.57e-07 | 1.29e-01 | 0.1236 |
| 23144 | ZC3H3 | P23T-E | Human | Esophagus | ESCC | 6.42e-21 | 5.15e-01 | 0.108 |
| 23144 | ZC3H3 | P24T-E | Human | Esophagus | ESCC | 1.12e-10 | 2.57e-01 | 0.1287 |
| Page: 1 2 3 4 5 |
| Tissue | Expression Dynamics | Abbreviation |
| Esophagus | 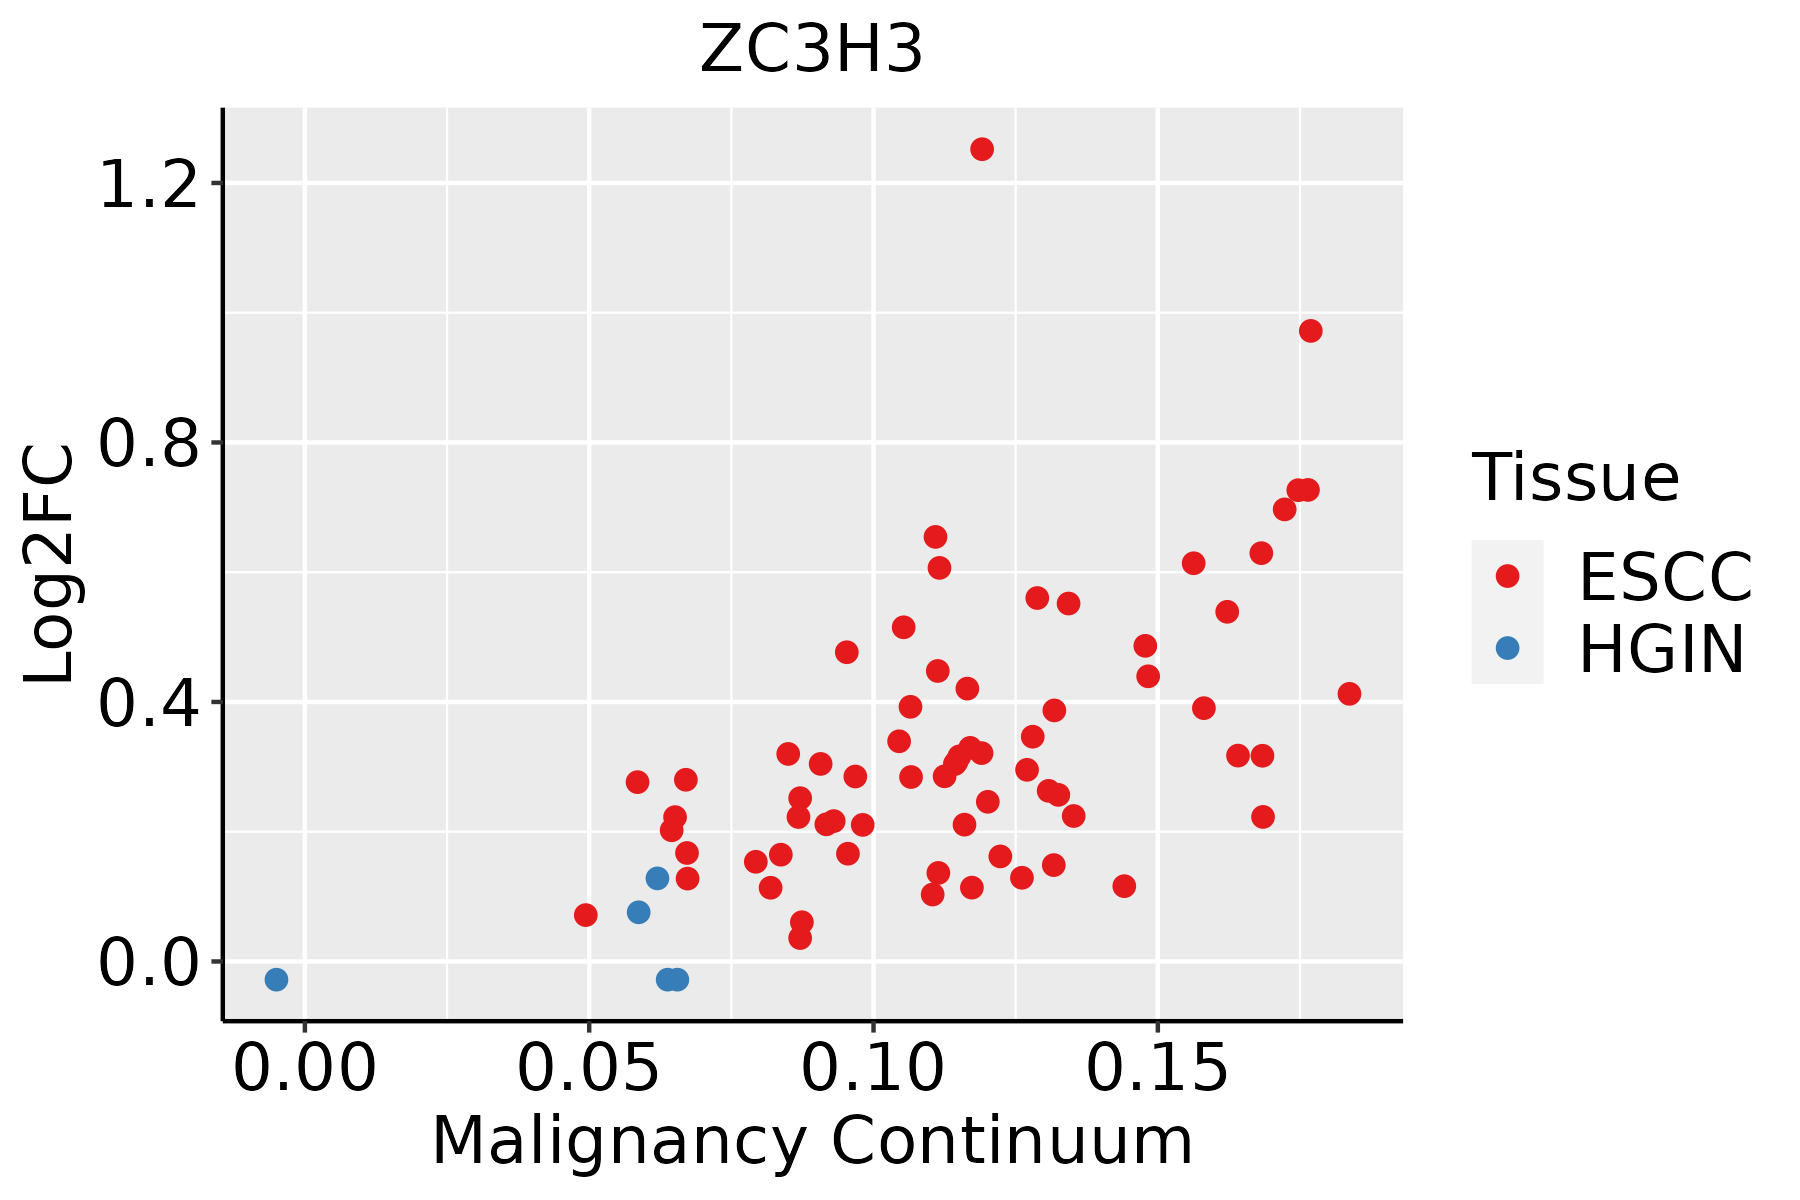 | ESCC: Esophageal squamous cell carcinoma |
| HGIN: High-grade intraepithelial neoplasias | ||
| LGIN: Low-grade intraepithelial neoplasias | ||
| Liver | 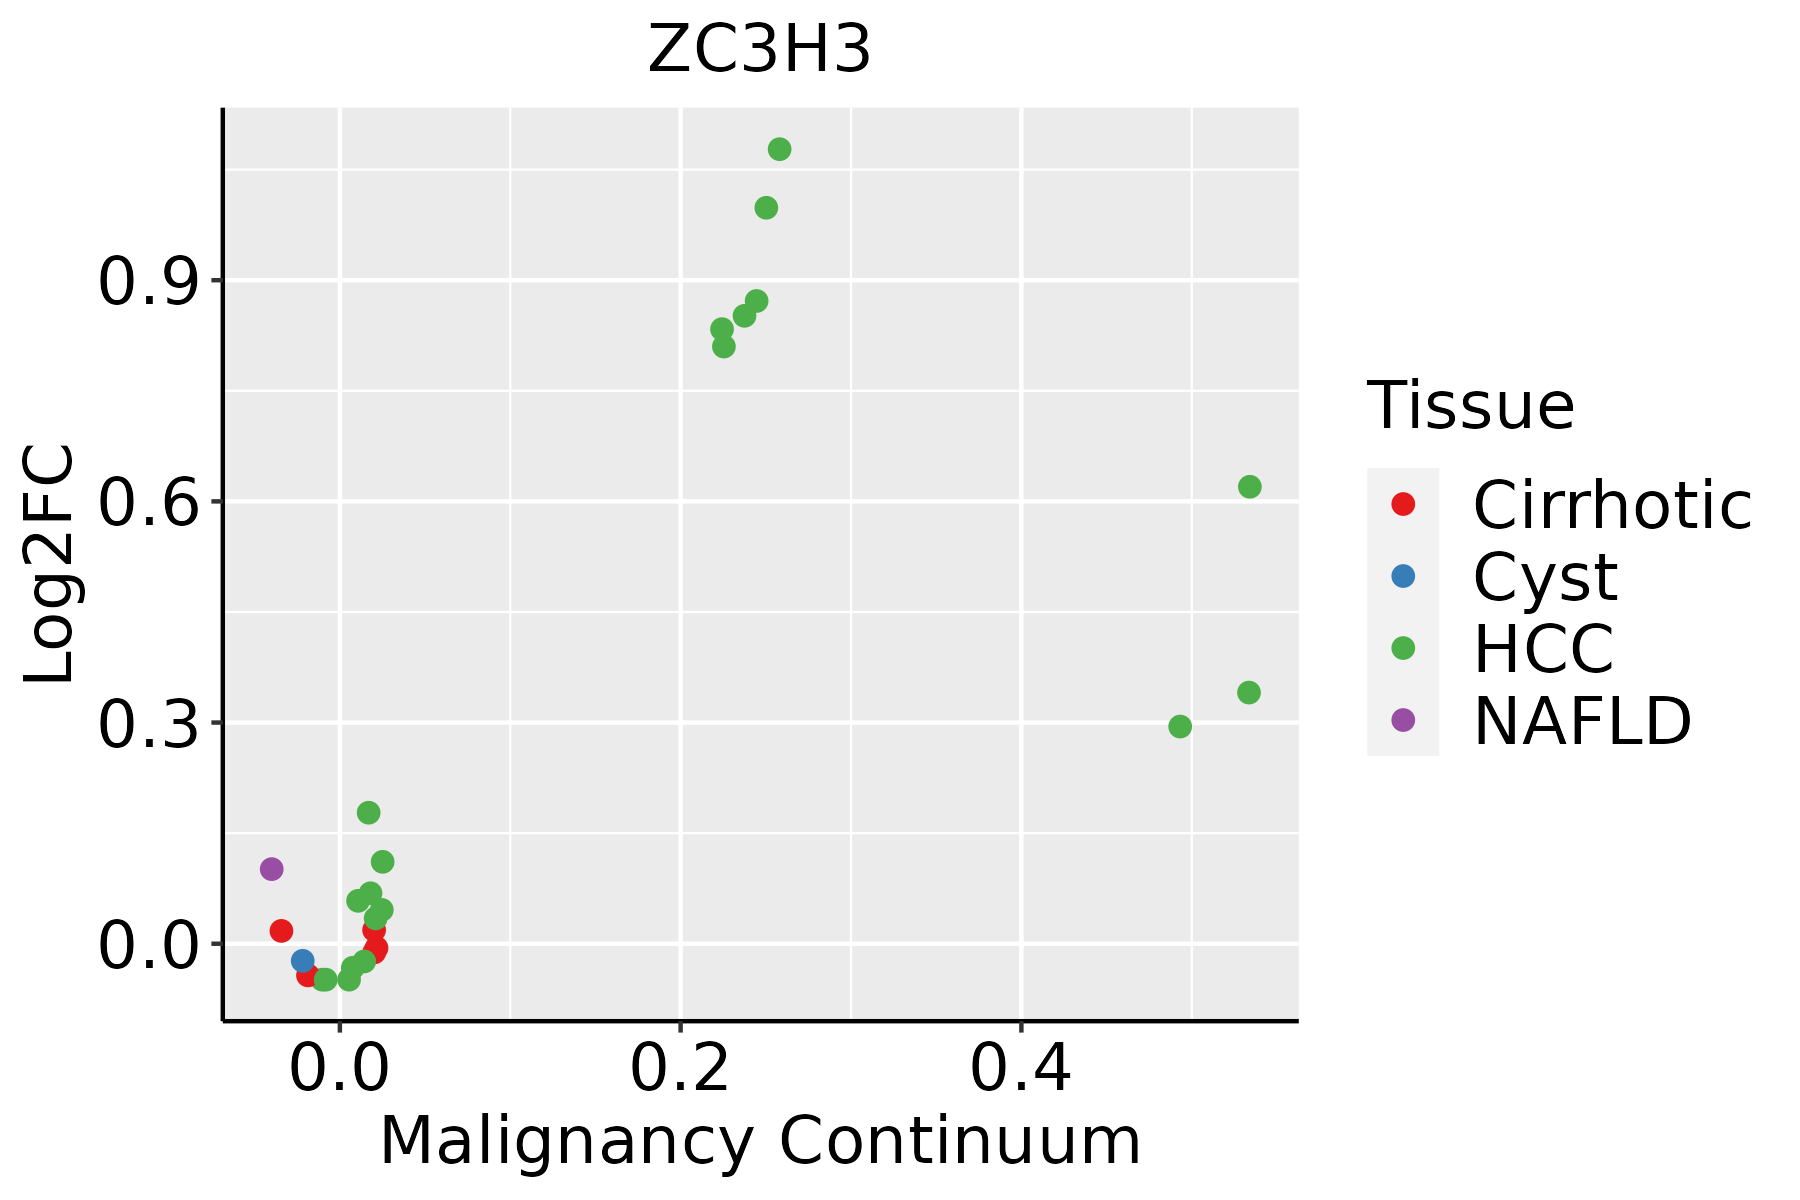 | HCC: Hepatocellular carcinoma |
| NAFLD: Non-alcoholic fatty liver disease | ||
| Lung | 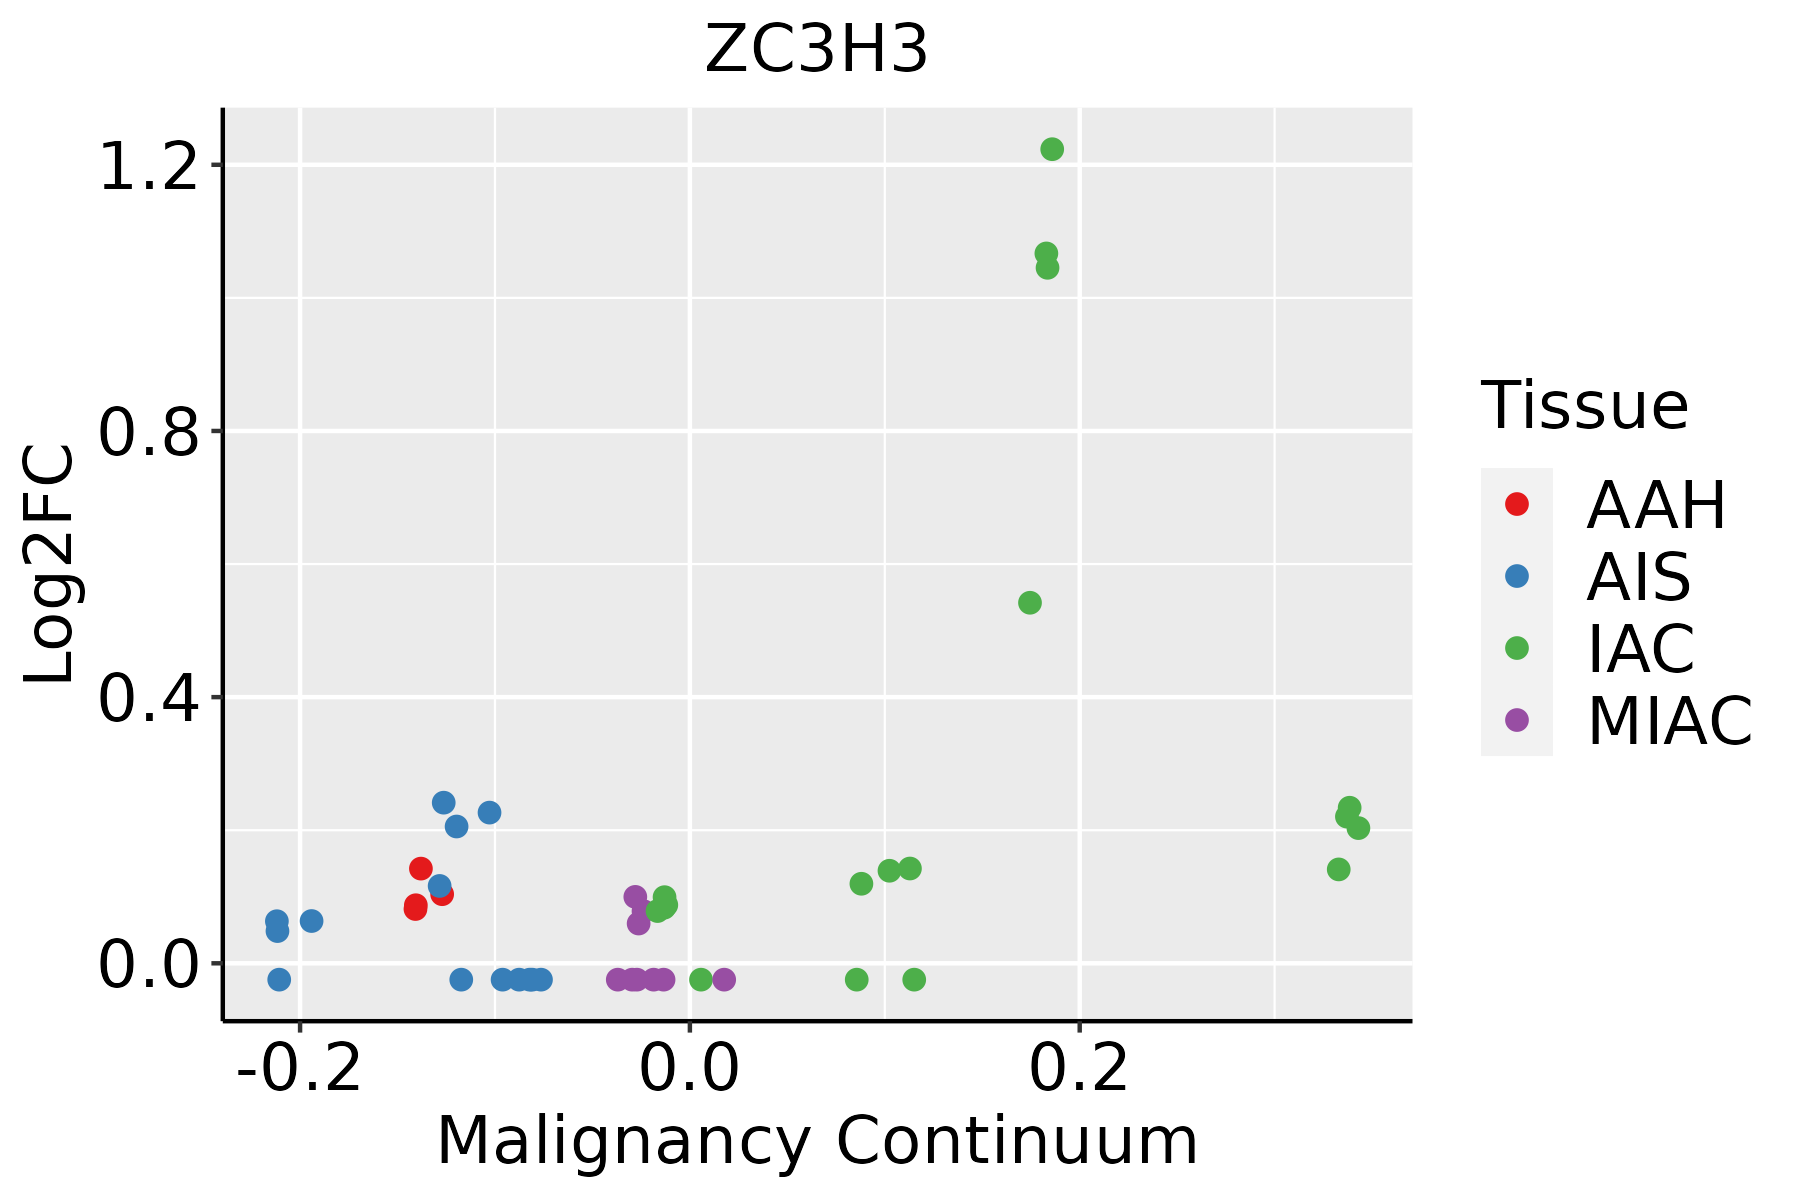 | AAH: Atypical adenomatous hyperplasia |
| AIS: Adenocarcinoma in situ | ||
| IAC: Invasive lung adenocarcinoma | ||
| MIA: Minimally invasive adenocarcinoma | ||
| Oral Cavity |  | EOLP: Erosive Oral lichen planus |
| LP: leukoplakia | ||
| NEOLP: Non-erosive oral lichen planus | ||
| OSCC: Oral squamous cell carcinoma |
| ∗log2FC in expression of this searched gene in stem-like cells from each diseased tissue sample relative to stem-like cells in normal samples in each tissue plotted against the malignancy continuum. Samples are colored based on if they are from different disease stage. |
Top |
Malignant transformation related pathway analysis |
| Find out the enriched GO biological processes and KEGG pathways involved in transition from healthy to precancer to cancer |
| Tissue | Disease Stage | Enriched GO biological Processes |
| Colorectum | AD |  |
| Colorectum | SER |  |
| Colorectum | MSS |  |
| Colorectum | MSI-H |  |
| Colorectum | FAP |  |
| ∗Top 15 enriched GO BP terms are showed in the bar plot of each disease state in each tissue. Each row represents a significant GO biological process which is colored according to the -log10(p.adjust). |
| Page: 1 2 3 4 5 6 7 8 9 |
| GO ID | Tissue | Disease Stage | Description | Gene Ratio | Bg Ratio | pvalue | p.adjust | Count |
| GO:0006403110 | Esophagus | ESCC | RNA localization | 166/8552 | 201/18723 | 1.95e-27 | 6.18e-25 | 166 |
| GO:1903311110 | Esophagus | ESCC | regulation of mRNA metabolic process | 210/8552 | 288/18723 | 3.25e-21 | 5.56e-19 | 210 |
| GO:005123617 | Esophagus | ESCC | establishment of RNA localization | 134/8552 | 166/18723 | 1.23e-20 | 1.81e-18 | 134 |
| GO:005102815 | Esophagus | ESCC | mRNA transport | 110/8552 | 130/18723 | 2.76e-20 | 3.80e-18 | 110 |
| GO:005065717 | Esophagus | ESCC | nucleic acid transport | 131/8552 | 163/18723 | 6.94e-20 | 8.46e-18 | 131 |
| GO:005065817 | Esophagus | ESCC | RNA transport | 131/8552 | 163/18723 | 6.94e-20 | 8.46e-18 | 131 |
| GO:001593117 | Esophagus | ESCC | nucleobase-containing compound transport | 162/8552 | 222/18723 | 9.87e-17 | 7.93e-15 | 162 |
| GO:0050684110 | Esophagus | ESCC | regulation of mRNA processing | 109/8552 | 137/18723 | 3.51e-16 | 2.59e-14 | 109 |
| GO:003112412 | Esophagus | ESCC | mRNA 3'-end processing | 47/8552 | 62/18723 | 1.29e-06 | 1.58e-05 | 47 |
| GO:003144013 | Esophagus | ESCC | regulation of mRNA 3'-end processing | 25/8552 | 28/18723 | 1.77e-06 | 2.10e-05 | 25 |
| GO:00311233 | Esophagus | ESCC | RNA 3'-end processing | 76/8552 | 116/18723 | 1.25e-05 | 1.15e-04 | 76 |
| GO:00063783 | Esophagus | ESCC | mRNA polyadenylation | 33/8552 | 44/18723 | 7.30e-05 | 5.49e-04 | 33 |
| GO:00436313 | Esophagus | ESCC | RNA polyadenylation | 33/8552 | 45/18723 | 1.54e-04 | 1.02e-03 | 33 |
| GO:000717810 | Esophagus | ESCC | transmembrane receptor protein serine/threonine kinase signaling pathway | 195/8552 | 355/18723 | 2.58e-04 | 1.58e-03 | 195 |
| GO:19003632 | Esophagus | ESCC | regulation of mRNA polyadenylation | 14/8552 | 17/18723 | 2.22e-03 | 9.78e-03 | 14 |
| GO:190331121 | Liver | HCC | regulation of mRNA metabolic process | 205/7958 | 288/18723 | 3.38e-23 | 6.90e-21 | 205 |
| GO:000640321 | Liver | HCC | RNA localization | 151/7958 | 201/18723 | 3.72e-21 | 5.89e-19 | 151 |
| GO:005068421 | Liver | HCC | regulation of mRNA processing | 106/7958 | 137/18723 | 7.64e-17 | 7.12e-15 | 106 |
| GO:005123621 | Liver | HCC | establishment of RNA localization | 121/7958 | 166/18723 | 1.61e-15 | 1.19e-13 | 121 |
| GO:005065711 | Liver | HCC | nucleic acid transport | 118/7958 | 163/18723 | 8.30e-15 | 5.60e-13 | 118 |
| Page: 1 2 3 |
| Pathway ID | Tissue | Disease Stage | Description | Gene Ratio | Bg Ratio | pvalue | p.adjust | qvalue | Count |
| Page: 1 |
Top |
Cell-cell communication analysis |
| Identification of potential cell-cell interactions between two cell types and their ligand-receptor pairs for different disease states |
| Ligand | Receptor | LRpair | Pathway | Tissue | Disease Stage |
| Page: 1 |
Top |
Single-cell gene regulatory network inference analysis |
| Find out the significant the regulons (TFs) and the target genes of each regulon across cell types for different disease states |
| TF | Cell Type | Tissue | Disease Stage | Target Gene | RSS | Regulon Activity |
| ∗The dot plots of a searched regulon are shown for all cell subpopulations in each disease state of each tissue based on the regulon specific score inferred using pySCENIC and by calculating the average expression. |
| Page: 1 |
Top |
Somatic mutation of malignant transformation related genes |
| Annotation of somatic variants for genes involved in malignant transformation |
| Hugo Symbol | Variant Class | Variant Classification | dbSNP RS | HGVSc | HGVSp | HGVSp Short | SWISSPROT | BIOTYPE | SIFT | PolyPhen | Tumor Sample Barcode | Tissue | Histology | Sex | Age | Stage | Therapy Types | Drugs | Outcome |
| ZC3H3 | SNV | Missense_Mutation | rs112624965 | c.2804N>G | p.Thr935Ser | p.T935S | Q8IXZ2 | protein_coding | tolerated(0.72) | benign(0.003) | TCGA-BH-A1ES-06 | Breast | breast invasive carcinoma | Female | <65 | I/II | Unknown | Unknown | PD |
| ZC3H3 | SNV | Missense_Mutation | rs112624965 | c.2804N>G | p.Thr935Ser | p.T935S | Q8IXZ2 | protein_coding | tolerated(0.72) | benign(0.003) | TCGA-EW-A1IY-01 | Breast | breast invasive carcinoma | Female | <65 | I/II | Chemotherapy | taxotere | SD |
| ZC3H3 | SNV | Missense_Mutation | novel | c.1999N>C | p.Glu667Gln | p.E667Q | Q8IXZ2 | protein_coding | tolerated(0.38) | benign(0.024) | TCGA-GM-A3XL-01 | Breast | breast invasive carcinoma | Female | <65 | I/II | Chemotherapy | fluorouracil | CR |
| ZC3H3 | insertion | Frame_Shift_Ins | novel | c.132_133insAGCAGTAGGA | p.His45SerfsTer10 | p.H45Sfs*10 | Q8IXZ2 | protein_coding | TCGA-BH-A0B1-01 | Breast | breast invasive carcinoma | Female | >=65 | I/II | Chemotherapy | adriamycin | SD | ||
| ZC3H3 | SNV | Missense_Mutation | rs769828841 | c.1897N>T | p.Arg633Cys | p.R633C | Q8IXZ2 | protein_coding | deleterious(0) | probably_damaging(0.967) | TCGA-HM-A3JK-01 | Cervix | cervical & endocervical cancer | Female | <65 | I/II | Chemotherapy | cisplatin | SD |
| ZC3H3 | SNV | Missense_Mutation | c.5N>T | p.Glu2Val | p.E2V | Q8IXZ2 | protein_coding | deleterious(0) | possibly_damaging(0.804) | TCGA-IR-A3LI-01 | Cervix | cervical & endocervical cancer | Female | <65 | I/II | Chemotherapy | cisplatin | CR | |
| ZC3H3 | SNV | Missense_Mutation | rs774760836 | c.86N>T | p.Pro29Leu | p.P29L | Q8IXZ2 | protein_coding | deleterious(0.03) | possibly_damaging(0.459) | TCGA-VS-A94W-01 | Cervix | cervical & endocervical cancer | Female | <65 | I/II | Chemotherapy | cisplatin | CR |
| ZC3H3 | SNV | Missense_Mutation | rs17857164 | c.1906N>T | p.Arg636Trp | p.R636W | Q8IXZ2 | protein_coding | deleterious(0) | possibly_damaging(0.895) | TCGA-A6-4105-01 | Colorectum | colon adenocarcinoma | Male | >=65 | I/II | Unknown | Unknown | PD |
| ZC3H3 | SNV | Missense_Mutation | c.905N>A | p.Arg302Gln | p.R302Q | Q8IXZ2 | protein_coding | tolerated(0.06) | benign(0.046) | TCGA-AA-3510-01 | Colorectum | colon adenocarcinoma | Male | >=65 | I/II | Unknown | Unknown | SD | |
| ZC3H3 | SNV | Missense_Mutation | c.905G>A | p.Arg302Gln | p.R302Q | Q8IXZ2 | protein_coding | tolerated(0.06) | benign(0.046) | TCGA-AA-A00N-01 | Colorectum | colon adenocarcinoma | Male | >=65 | I/II | Unknown | Unknown | PD |
| Page: 1 2 3 4 5 6 7 8 9 10 11 |
Top |
Related drugs of malignant transformation related genes |
| Identification of chemicals and drugs interact with genes involved in malignant transfromation |
| (DGIdb 4.0) |
| Entrez ID | Symbol | Category | Interaction Types | Drug Claim Name | Drug Name | PMIDs |
| Page: 1 |

Copyright 2023-Present -The University of Texas Health Science Center at Houston |