
|
|||||
|
 | |
| |
| |
| |
| |
| |
|
Gene: ZC3H15 |
Gene summary for ZC3H15 |
| Gene information | Species | Human | Gene symbol | ZC3H15 | Gene ID | 55854 |
| Gene name | zinc finger CCCH-type containing 15 | |
| Gene Alias | HT010 | |
| Cytomap | 2q32.1 | |
| Gene Type | protein-coding | GO ID | GO:0002181 | UniProtAcc | Q8WU90 |
Top |
Malignant transformation analysis |
| Identification of the aberrant gene expression in precancerous and cancerous lesions by comparing the gene expression of stem-like cells in diseased tissues with normal stem cells |
| Entrez ID | Symbol | Replicates | Species | Organ | Tissue | Adj P-value | Log2FC | Malignancy |
| 55854 | ZC3H15 | AEH-subject1 | Human | Endometrium | AEH | 1.49e-05 | -2.40e-01 | -0.3059 |
| 55854 | ZC3H15 | AEH-subject2 | Human | Endometrium | AEH | 6.59e-11 | -3.12e-01 | -0.2525 |
| 55854 | ZC3H15 | AEH-subject3 | Human | Endometrium | AEH | 8.04e-08 | -1.90e-01 | -0.2576 |
| 55854 | ZC3H15 | AEH-subject4 | Human | Endometrium | AEH | 6.42e-07 | -2.72e-01 | -0.2657 |
| 55854 | ZC3H15 | EEC-subject1 | Human | Endometrium | EEC | 1.46e-10 | -2.24e-01 | -0.2682 |
| 55854 | ZC3H15 | EEC-subject2 | Human | Endometrium | EEC | 1.56e-07 | -3.27e-01 | -0.2607 |
| 55854 | ZC3H15 | EEC-subject3 | Human | Endometrium | EEC | 1.41e-33 | -3.20e-01 | -0.2525 |
| 55854 | ZC3H15 | EEC-subject4 | Human | Endometrium | EEC | 2.48e-10 | -2.63e-01 | -0.2571 |
| 55854 | ZC3H15 | EEC-subject5 | Human | Endometrium | EEC | 2.58e-02 | -1.10e-01 | -0.249 |
| 55854 | ZC3H15 | GSM5276934 | Human | Endometrium | EEC | 3.62e-04 | 1.52e-01 | -0.0913 |
| 55854 | ZC3H15 | GSM5276937 | Human | Endometrium | EEC | 4.22e-03 | 1.85e-01 | -0.0897 |
| 55854 | ZC3H15 | GSM6177620_NYU_UCEC1_lib1_lib1 | Human | Endometrium | EEC | 6.65e-36 | -2.35e-01 | -0.1869 |
| 55854 | ZC3H15 | GSM6177620_NYU_UCEC1_lib2_lib2 | Human | Endometrium | EEC | 1.43e-37 | -1.71e-01 | -0.1875 |
| 55854 | ZC3H15 | GSM6177620_NYU_UCEC1_lib3_lib3 | Human | Endometrium | EEC | 1.51e-42 | -1.35e-01 | -0.1883 |
| 55854 | ZC3H15 | GSM6177621_NYU_UCEC2_lib1_lib1 | Human | Endometrium | EEC | 5.73e-37 | -1.18e-01 | -0.1934 |
| 55854 | ZC3H15 | GSM6177622_NYU_UCEC3_lib1_lib1 | Human | Endometrium | EEC | 5.71e-63 | -2.36e-01 | -0.1917 |
| 55854 | ZC3H15 | GSM6177622_NYU_UCEC3_lib2_lib2 | Human | Endometrium | EEC | 4.70e-53 | -2.49e-01 | -0.1916 |
| 55854 | ZC3H15 | GSM6177623_NYU_UCEC3_Vis | Human | Endometrium | EEC | 2.27e-14 | -2.82e-01 | -0.1269 |
| 55854 | ZC3H15 | LZE2T | Human | Esophagus | ESCC | 3.68e-02 | 8.75e-01 | 0.082 |
| 55854 | ZC3H15 | LZE4T | Human | Esophagus | ESCC | 5.73e-15 | 7.69e-01 | 0.0811 |
| Page: 1 2 3 4 5 6 7 8 9 |
| Tissue | Expression Dynamics | Abbreviation |
| Endometrium | 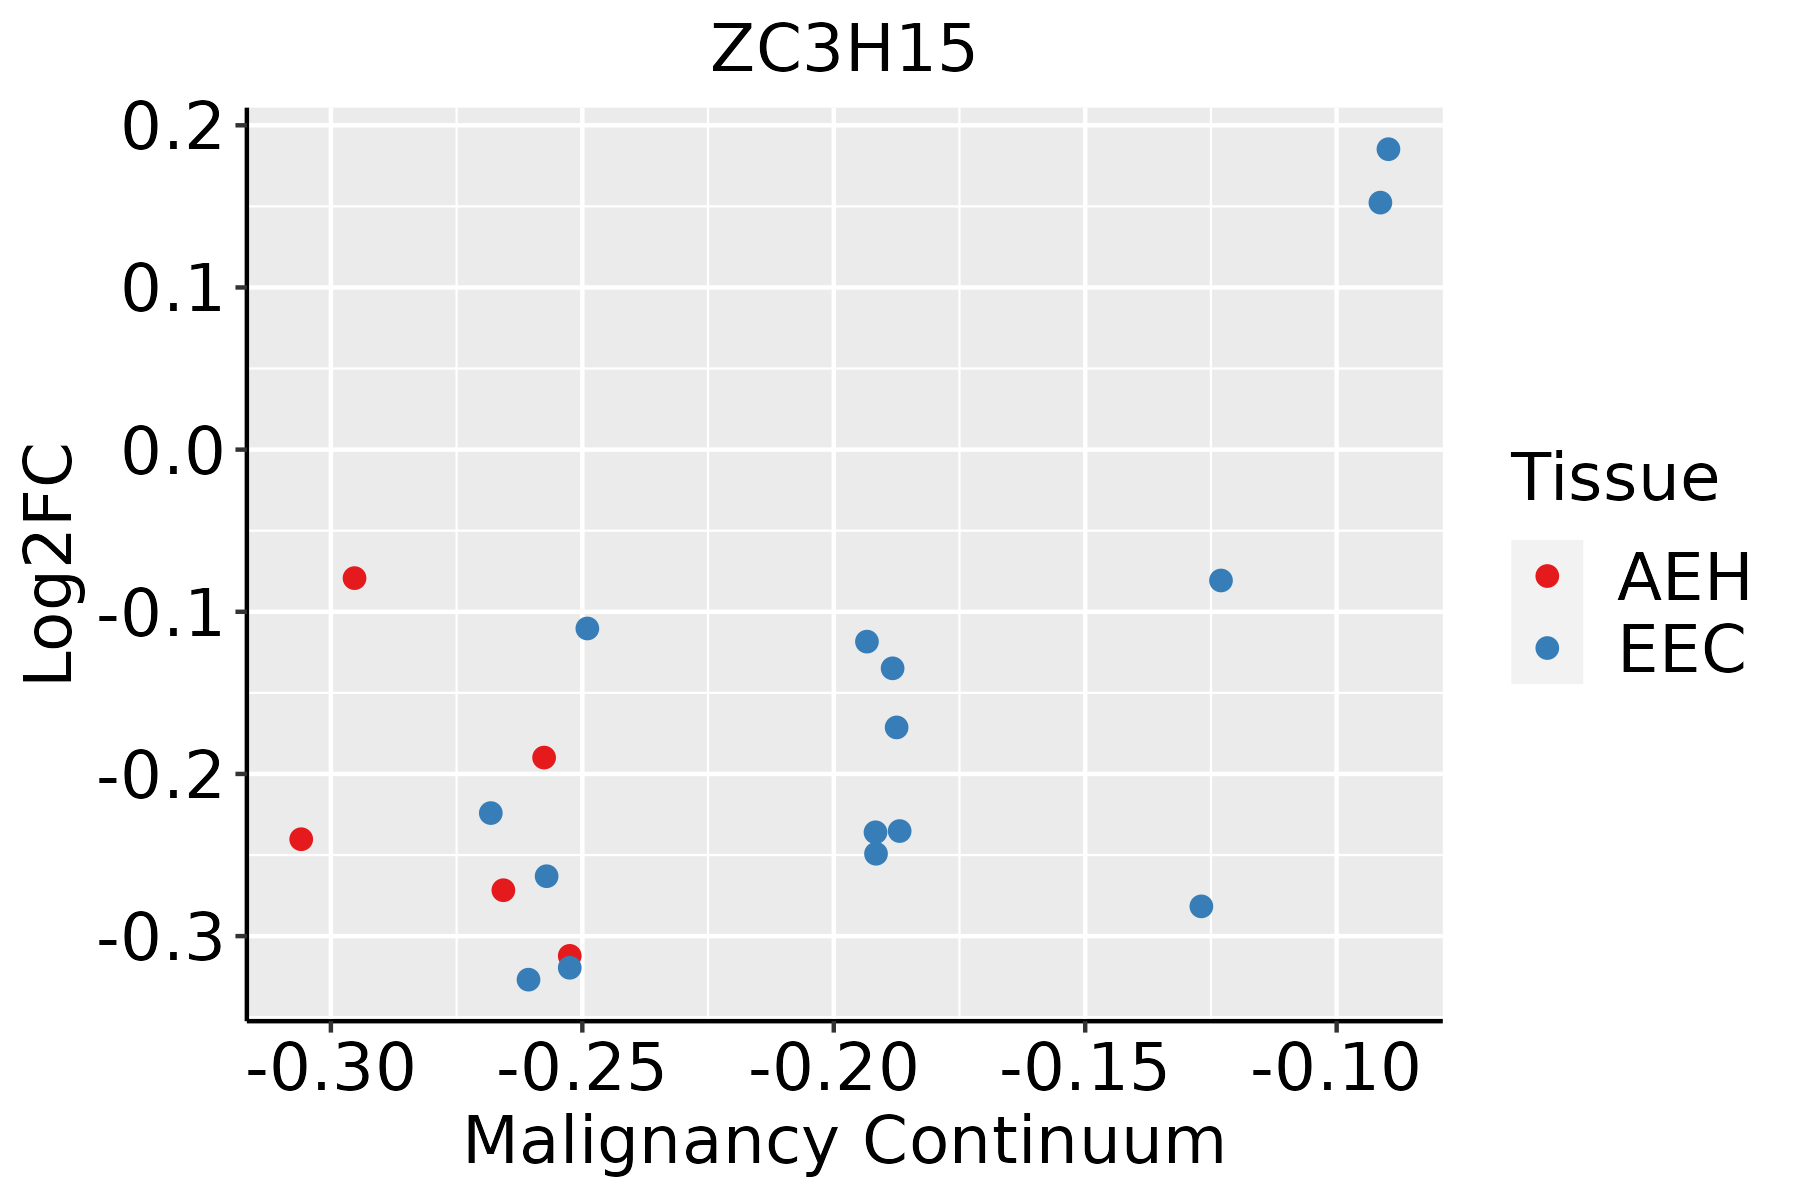 | AEH: Atypical endometrial hyperplasia |
| EEC: Endometrioid Cancer | ||
| Esophagus | 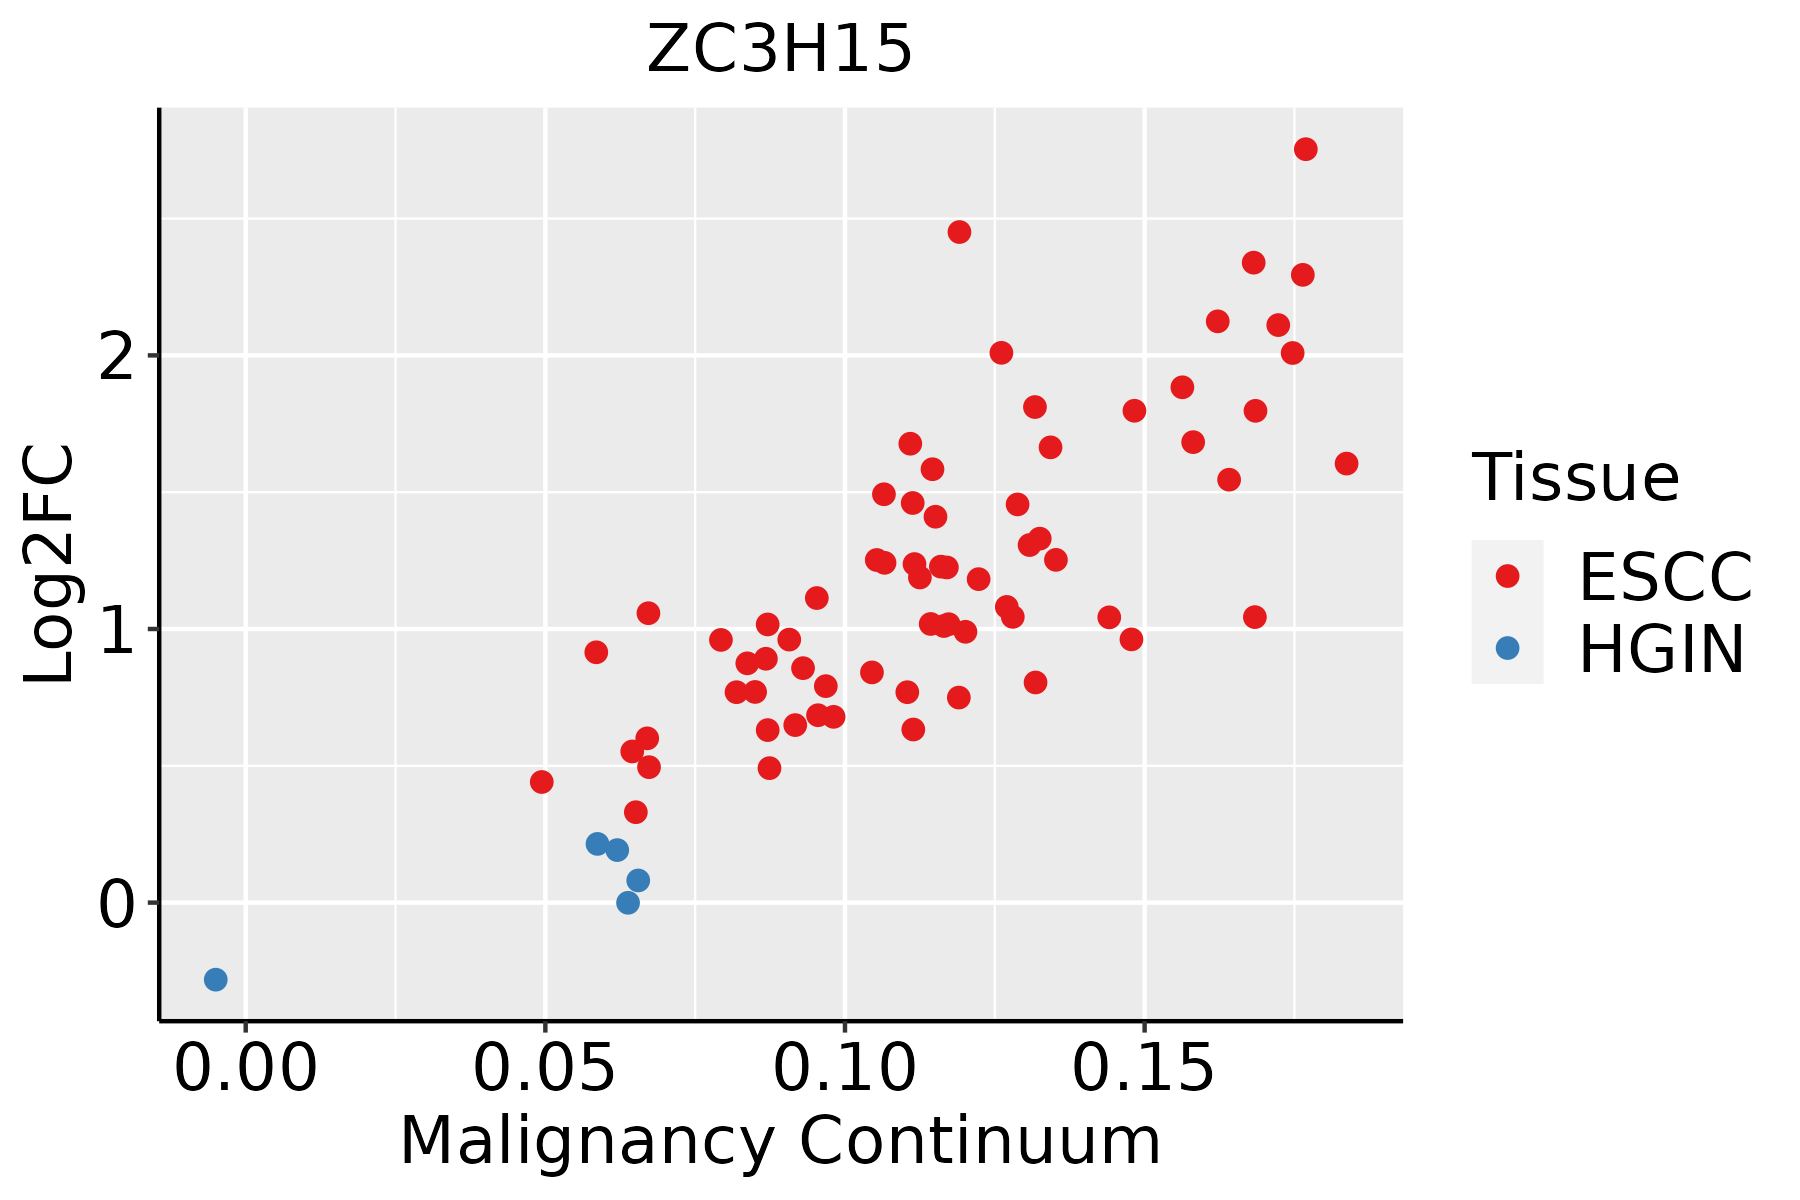 | ESCC: Esophageal squamous cell carcinoma |
| HGIN: High-grade intraepithelial neoplasias | ||
| LGIN: Low-grade intraepithelial neoplasias | ||
| Liver | 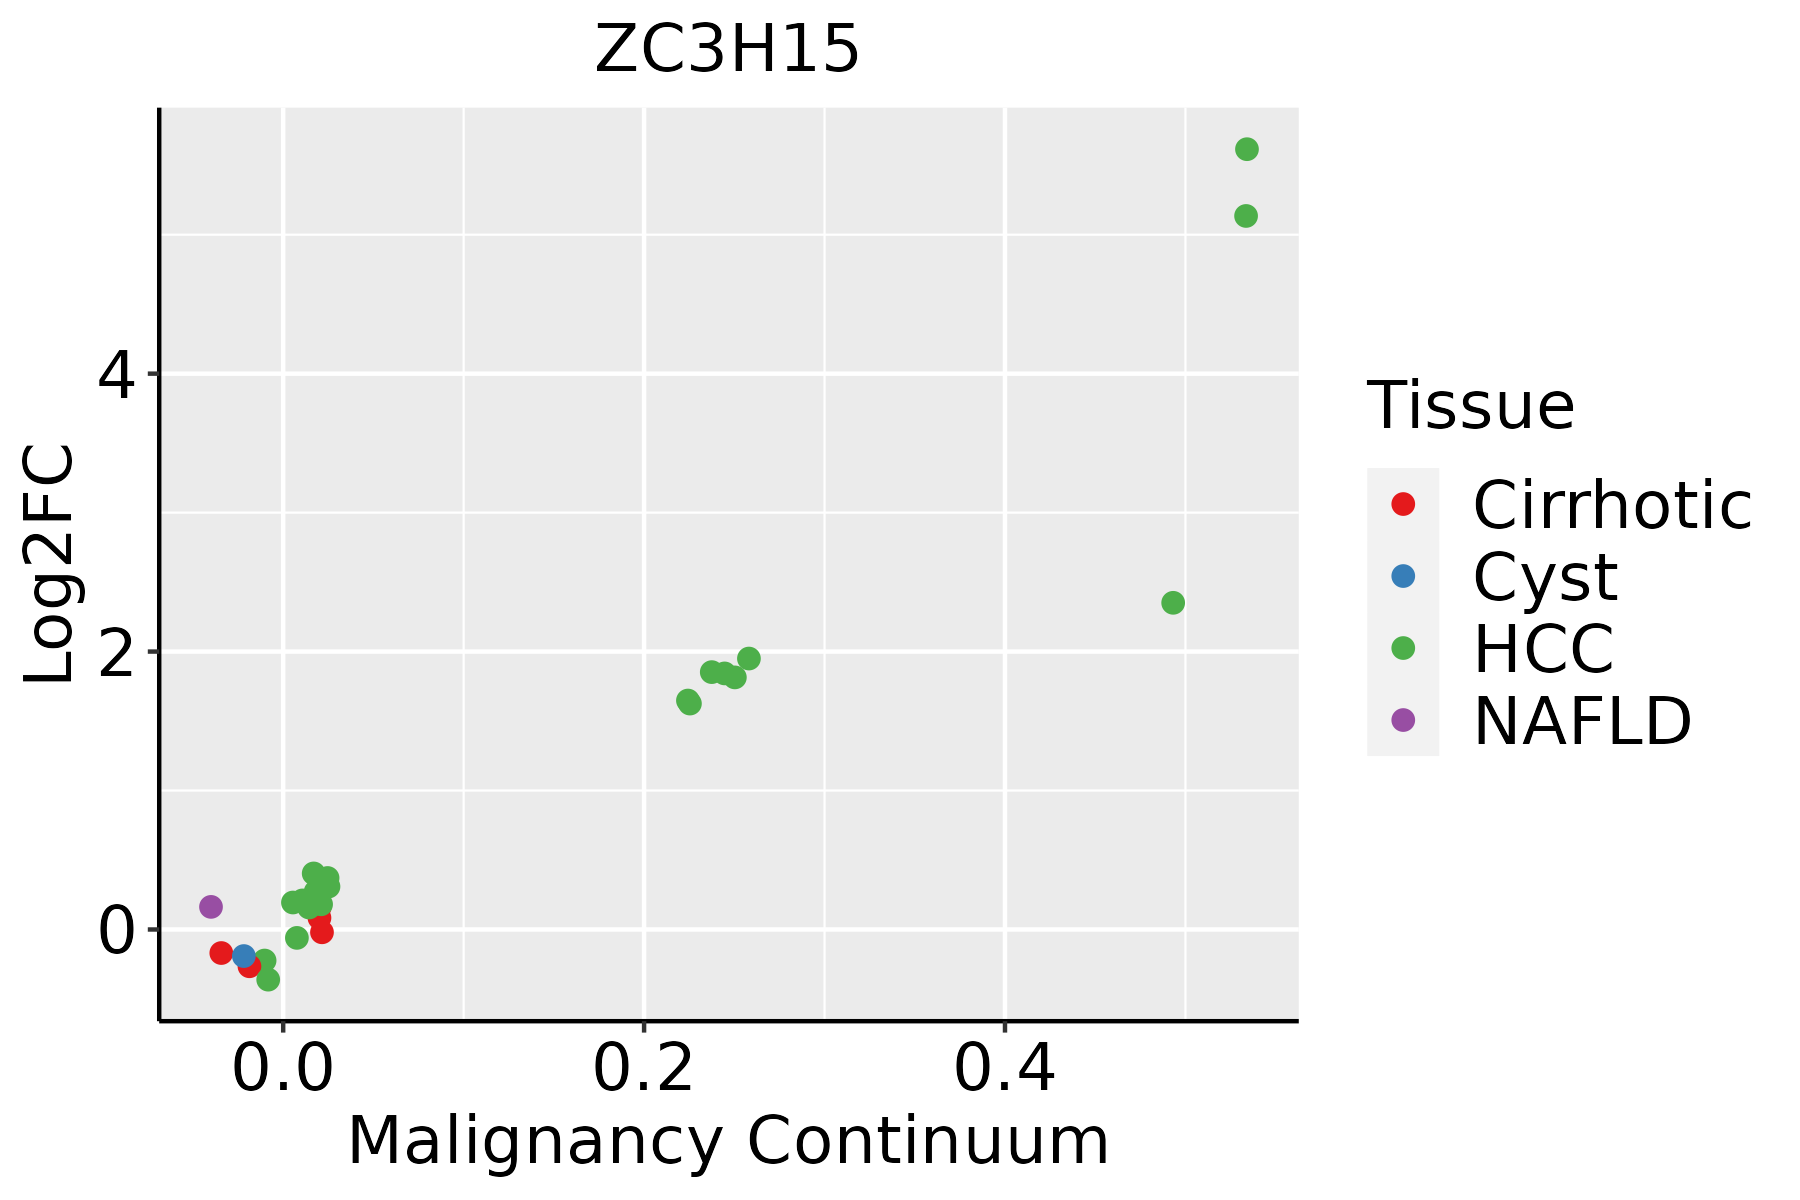 | HCC: Hepatocellular carcinoma |
| NAFLD: Non-alcoholic fatty liver disease | ||
| Oral Cavity | 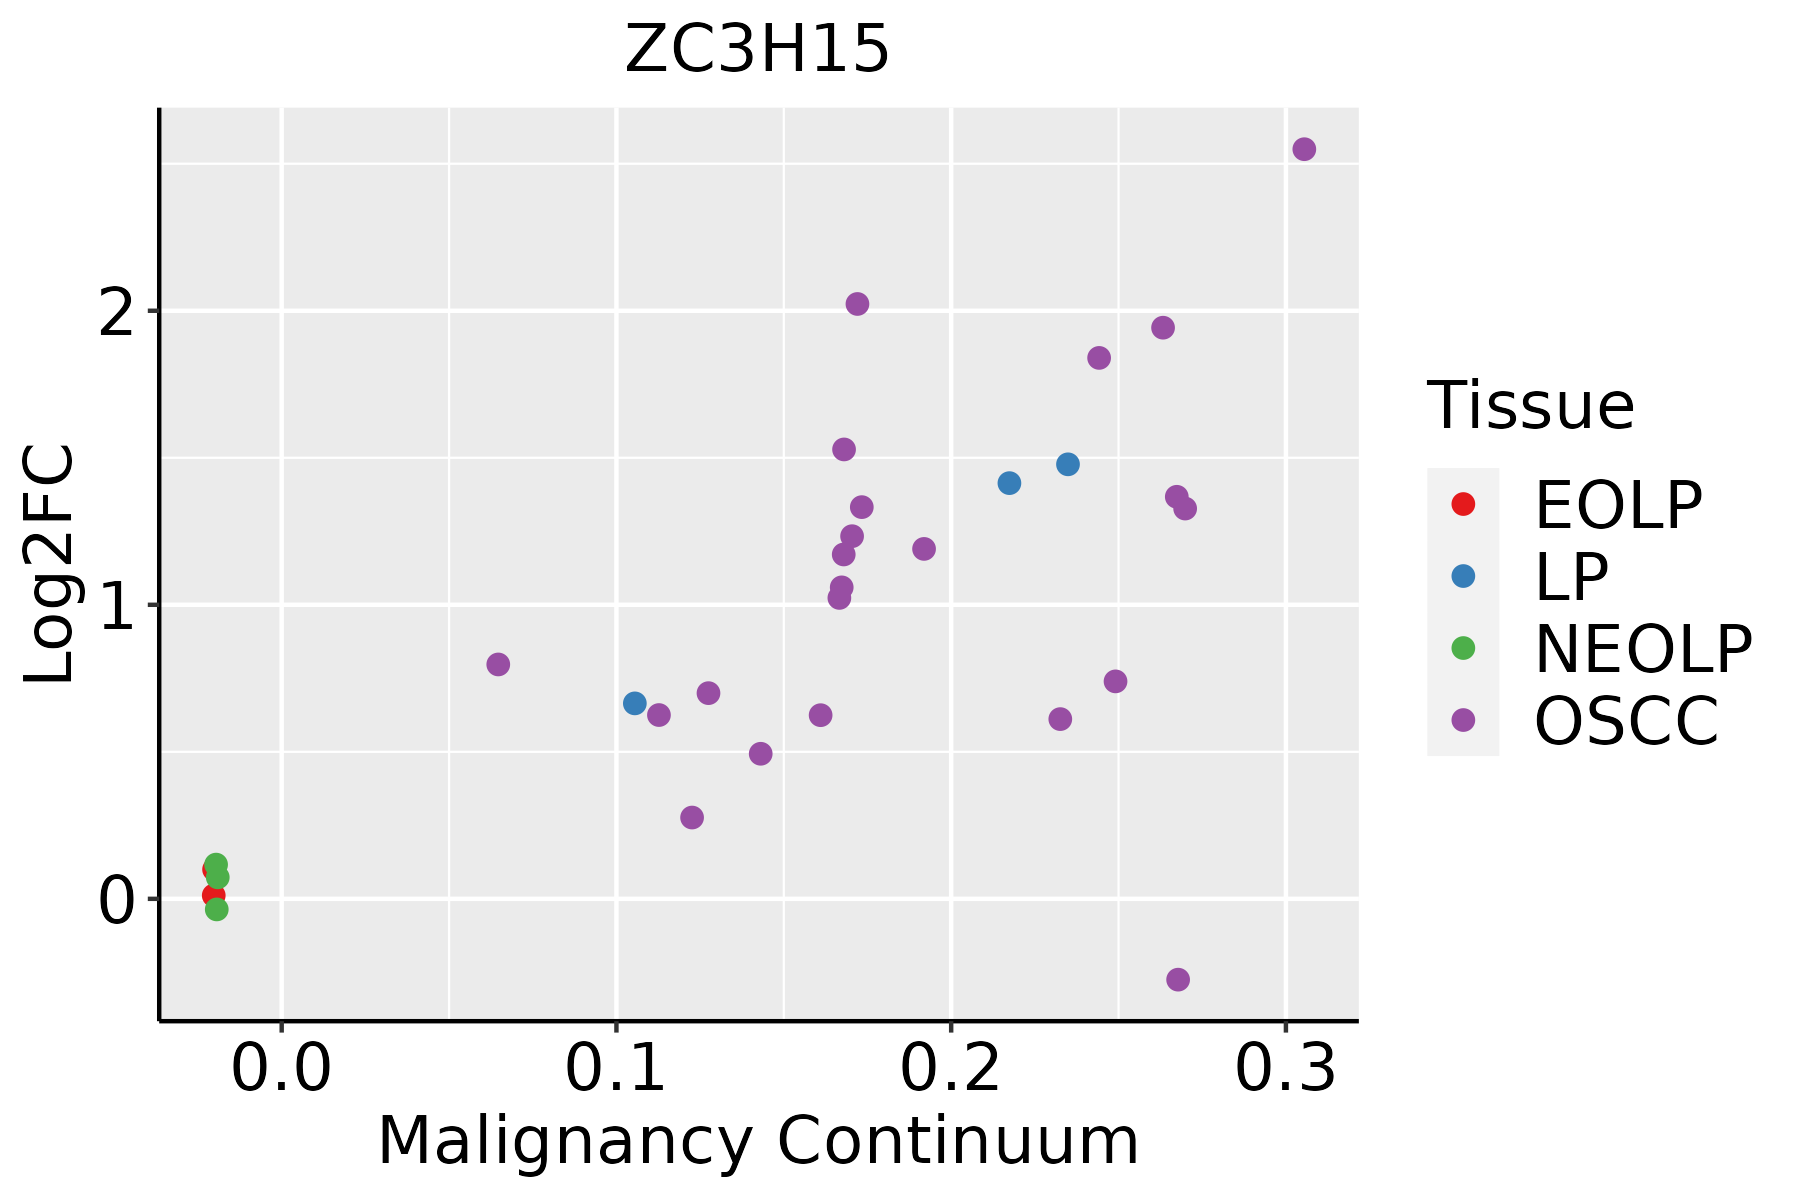 | EOLP: Erosive Oral lichen planus |
| LP: leukoplakia | ||
| NEOLP: Non-erosive oral lichen planus | ||
| OSCC: Oral squamous cell carcinoma | ||
| Prostate |  | BPH: Benign Prostatic Hyperplasia |
| Skin |  | AK: Actinic keratosis |
| cSCC: Cutaneous squamous cell carcinoma | ||
| SCCIS:squamous cell carcinoma in situ | ||
| Thyroid | 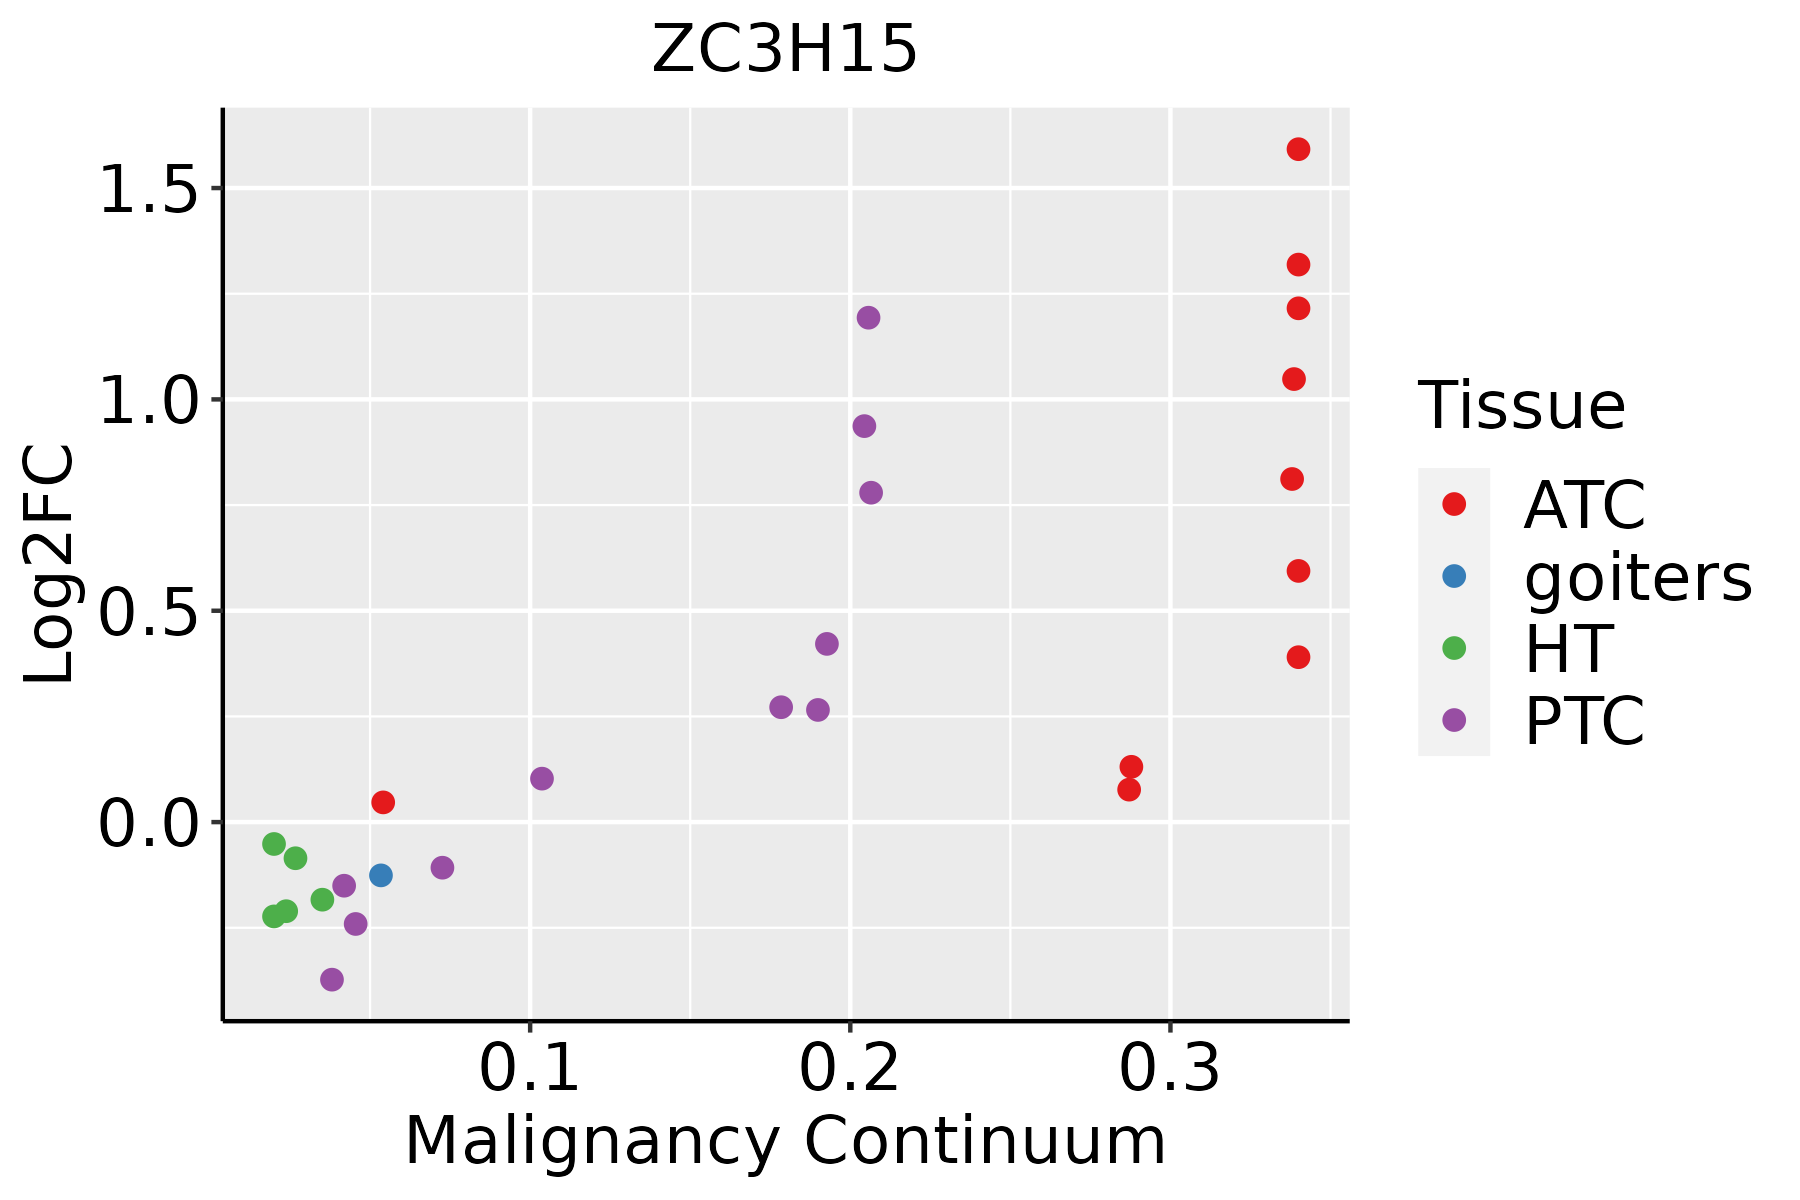 | ATC: Anaplastic thyroid cancer |
| HT: Hashimoto's thyroiditis | ||
| PTC: Papillary thyroid cancer |
| ∗log2FC in expression of this searched gene in stem-like cells from each diseased tissue sample relative to stem-like cells in normal samples in each tissue plotted against the malignancy continuum. Samples are colored based on if they are from different disease stage. |
Top |
Malignant transformation related pathway analysis |
| Find out the enriched GO biological processes and KEGG pathways involved in transition from healthy to precancer to cancer |
| Tissue | Disease Stage | Enriched GO biological Processes |
| Colorectum | AD |  |
| Colorectum | SER |  |
| Colorectum | MSS |  |
| Colorectum | MSI-H |  |
| Colorectum | FAP |  |
| ∗Top 15 enriched GO BP terms are showed in the bar plot of each disease state in each tissue. Each row represents a significant GO biological process which is colored according to the -log10(p.adjust). |
| Page: 1 2 3 4 5 6 7 8 9 |
| GO ID | Tissue | Disease Stage | Description | Gene Ratio | Bg Ratio | pvalue | p.adjust | Count |
| GO:000218116 | Endometrium | AEH | cytoplasmic translation | 104/2100 | 148/18723 | 1.01e-64 | 6.07e-61 | 104 |
| GO:00430878 | Endometrium | AEH | regulation of GTPase activity | 66/2100 | 348/18723 | 1.26e-05 | 2.77e-04 | 66 |
| GO:00435477 | Endometrium | AEH | positive regulation of GTPase activity | 48/2100 | 255/18723 | 2.18e-04 | 2.67e-03 | 48 |
| GO:000218117 | Endometrium | EEC | cytoplasmic translation | 104/2168 | 148/18723 | 2.53e-63 | 1.52e-59 | 104 |
| GO:004308712 | Endometrium | EEC | regulation of GTPase activity | 67/2168 | 348/18723 | 1.84e-05 | 3.43e-04 | 67 |
| GO:004354712 | Endometrium | EEC | positive regulation of GTPase activity | 50/2168 | 255/18723 | 1.26e-04 | 1.66e-03 | 50 |
| GO:000218127 | Esophagus | HGIN | cytoplasmic translation | 108/2587 | 148/18723 | 1.70e-60 | 1.02e-56 | 108 |
| GO:0002181111 | Esophagus | ESCC | cytoplasmic translation | 135/8552 | 148/18723 | 4.17e-32 | 2.65e-29 | 135 |
| GO:004308715 | Esophagus | ESCC | regulation of GTPase activity | 183/8552 | 348/18723 | 5.34e-03 | 2.00e-02 | 183 |
| GO:000218112 | Liver | Cirrhotic | cytoplasmic translation | 120/4634 | 148/18723 | 2.95e-47 | 1.85e-43 | 120 |
| GO:000218122 | Liver | HCC | cytoplasmic translation | 132/7958 | 148/18723 | 9.09e-33 | 5.76e-30 | 132 |
| GO:000218120 | Oral cavity | OSCC | cytoplasmic translation | 133/7305 | 148/18723 | 1.94e-38 | 2.46e-35 | 133 |
| GO:00192214 | Oral cavity | OSCC | cytokine-mediated signaling pathway | 222/7305 | 472/18723 | 2.02e-04 | 1.35e-03 | 222 |
| GO:004308710 | Oral cavity | OSCC | regulation of GTPase activity | 165/7305 | 348/18723 | 7.94e-04 | 4.27e-03 | 165 |
| GO:0002181110 | Oral cavity | LP | cytoplasmic translation | 124/4623 | 148/18723 | 5.09e-52 | 3.19e-48 | 124 |
| GO:000218126 | Oral cavity | EOLP | cytoplasmic translation | 102/2218 | 148/18723 | 7.91e-60 | 4.74e-56 | 102 |
| GO:001922112 | Oral cavity | EOLP | cytokine-mediated signaling pathway | 94/2218 | 472/18723 | 2.36e-07 | 7.37e-06 | 94 |
| GO:004308714 | Oral cavity | EOLP | regulation of GTPase activity | 66/2218 | 348/18723 | 6.92e-05 | 8.55e-04 | 66 |
| GO:00435479 | Oral cavity | EOLP | positive regulation of GTPase activity | 47/2218 | 255/18723 | 1.34e-03 | 9.33e-03 | 47 |
| GO:000218118 | Prostate | BPH | cytoplasmic translation | 115/3107 | 148/18723 | 1.08e-60 | 6.68e-57 | 115 |
| Page: 1 2 |
| Pathway ID | Tissue | Disease Stage | Description | Gene Ratio | Bg Ratio | pvalue | p.adjust | qvalue | Count |
| Page: 1 |
Top |
Cell-cell communication analysis |
| Identification of potential cell-cell interactions between two cell types and their ligand-receptor pairs for different disease states |
| Ligand | Receptor | LRpair | Pathway | Tissue | Disease Stage |
| Page: 1 |
Top |
Single-cell gene regulatory network inference analysis |
| Find out the significant the regulons (TFs) and the target genes of each regulon across cell types for different disease states |
| TF | Cell Type | Tissue | Disease Stage | Target Gene | RSS | Regulon Activity |
| ∗The dot plots of a searched regulon are shown for all cell subpopulations in each disease state of each tissue based on the regulon specific score inferred using pySCENIC and by calculating the average expression. |
| Page: 1 |
Top |
Somatic mutation of malignant transformation related genes |
| Annotation of somatic variants for genes involved in malignant transformation |
| Hugo Symbol | Variant Class | Variant Classification | dbSNP RS | HGVSc | HGVSp | HGVSp Short | SWISSPROT | BIOTYPE | SIFT | PolyPhen | Tumor Sample Barcode | Tissue | Histology | Sex | Age | Stage | Therapy Types | Drugs | Outcome |
| ZC3H15 | SNV | Missense_Mutation | c.586T>G | p.Trp196Gly | p.W196G | Q8WU90 | protein_coding | tolerated(0.05) | benign(0.039) | TCGA-AR-A250-01 | Breast | breast invasive carcinoma | Female | <65 | I/II | Chemotherapy | doxorubicin | SD | |
| ZC3H15 | SNV | Missense_Mutation | c.941N>G | p.Tyr314Cys | p.Y314C | Q8WU90 | protein_coding | tolerated(0.07) | benign(0.102) | TCGA-AR-A255-01 | Breast | breast invasive carcinoma | Female | <65 | I/II | Targeted Molecular therapy | trastuzumab | SD | |
| ZC3H15 | SNV | Missense_Mutation | c.913N>A | p.Asp305Asn | p.D305N | Q8WU90 | protein_coding | tolerated(0.06) | probably_damaging(0.971) | TCGA-B6-A0I8-01 | Breast | breast invasive carcinoma | Female | <65 | I/II | Unknown | Unknown | PD | |
| ZC3H15 | SNV | Missense_Mutation | novel | c.970N>C | p.Asp324His | p.D324H | Q8WU90 | protein_coding | deleterious(0.01) | possibly_damaging(0.518) | TCGA-C8-A8HQ-01 | Breast | breast invasive carcinoma | Female | <65 | I/II | Unknown | Unknown | SD |
| ZC3H15 | SNV | Missense_Mutation | rs758813880 | c.1045G>T | p.Val349Leu | p.V349L | Q8WU90 | protein_coding | tolerated(0.24) | benign(0.003) | TCGA-E9-A295-01 | Breast | breast invasive carcinoma | Female | >=65 | I/II | Hormone Therapy | tamoxiphen | SD |
| ZC3H15 | SNV | Missense_Mutation | novel | c.424N>C | p.Asp142His | p.D142H | Q8WU90 | protein_coding | deleterious(0) | probably_damaging(0.98) | TCGA-OL-A5RW-01 | Breast | breast invasive carcinoma | Female | <65 | I/II | Chemotherapy | adriamycin | CR |
| ZC3H15 | insertion | Nonsense_Mutation | novel | c.65_66insTTAACTGGCCCGGCAGGAAAAGTTTCCC | p.Lys22AsnfsTer2 | p.K22Nfs*2 | Q8WU90 | protein_coding | TCGA-A8-A085-01 | Breast | breast invasive carcinoma | Male | <65 | I/II | Hormone Therapy | tamoxiphen | SD | ||
| ZC3H15 | insertion | Frame_Shift_Ins | novel | c.232_233insC | p.Leu78SerfsTer6 | p.L78Sfs*6 | Q8WU90 | protein_coding | TCGA-AR-A0U0-01 | Breast | breast invasive carcinoma | Female | >=65 | I/II | Unknown | Unknown | SD | ||
| ZC3H15 | insertion | Frame_Shift_Ins | novel | c.233_234insA | p.Gln79AlafsTer5 | p.Q79Afs*5 | Q8WU90 | protein_coding | TCGA-AR-A0U0-01 | Breast | breast invasive carcinoma | Female | >=65 | I/II | Unknown | Unknown | SD | ||
| ZC3H15 | SNV | Missense_Mutation | c.57G>C | p.Lys19Asn | p.K19N | Q8WU90 | protein_coding | deleterious(0) | probably_damaging(0.95) | TCGA-EK-A2RA-01 | Cervix | cervical & endocervical cancer | Female | >=65 | I/II | Unknown | Unknown | SD |
| Page: 1 2 3 4 5 6 |
Top |
Related drugs of malignant transformation related genes |
| Identification of chemicals and drugs interact with genes involved in malignant transfromation |
| (DGIdb 4.0) |
| Entrez ID | Symbol | Category | Interaction Types | Drug Claim Name | Drug Name | PMIDs |
| Page: 1 |

Copyright 2023-Present -The University of Texas Health Science Center at Houston |