Schematic overview of the cellular and molecular mechanisms involved in the cancer progression, including the proposed cellular and molecular mechanisms in cancer cells trajectory. AT1: alveolar type 1 cells; AT2: alveolar type 2 cells; AAH: atypical adenomatous hyperplasia; AIS: adenocarcinoma in situ; MIA: minimally invasive adenocarcinoma; IA: invasive adenocarcinoma; EMT: epithelial-mesenchymal transition

Home

Download

Statistics

Help

Contact

Center for Computational Systems Medicine
leaf

Gene summary

leaf

Malignant transformation analysis

leaf

Malignant transformation related pathway analysis

leaf

Cell-cell communication analysis

leaf

Single-cell gene regulatory network inference analysis

leaf

Somatic mutation of malignant transformation related genes

leaf

Related drugs of malignant transformation related genes

Gene: ZC3H13

Gene summary for ZC3H13

check button Gene summary.

Gene informationSpeciesHuman
Gene symbol

ZC3H13

Gene ID

23091

Gene namezinc finger CCCH-type containing 13
Gene AliasKIAA0853
Cytomap13q14.13
Gene Typeprotein-coding
GO ID

GO:0001510

UniProtAcc

A0PJJ2


Top

Malignant transformation analysis

check button Identification of the aberrant gene expression in precancerous and cancerous lesions by comparing the gene expression of stem-like cells in diseased tissues with normal stem cells
check button Malignant transformation involving gene list.
Entrez IDSymbolReplicatesSpeciesOrganTissueAdj P-valueLog2FCMalignancy
23091ZC3H13GSM4909286HumanBreastIDC1.92e-051.12e-010.1081
23091ZC3H13GSM4909298HumanBreastIDC1.89e-093.33e-010.1551
23091ZC3H13GSM4909311HumanBreastIDC6.42e-11-1.47e-010.1534
23091ZC3H13GSM4909317HumanBreastIDC7.82e-246.58e-010.1355
23091ZC3H13GSM4909319HumanBreastIDC1.05e-12-1.10e-010.1563
23091ZC3H13GSM4909321HumanBreastIDC1.45e-02-1.17e-020.1559
23091ZC3H13M2HumanBreastIDC6.36e-107.79e-010.21
23091ZC3H13P1HumanBreastIDC4.81e-02-9.76e-020.1527
23091ZC3H13DCIS2HumanBreastDCIS3.07e-634.34e-010.0085
23091ZC3H13LZE4THumanEsophagusESCC9.91e-144.44e-010.0811
23091ZC3H13LZE5THumanEsophagusESCC7.45e-052.99e-010.0514
23091ZC3H13LZE7THumanEsophagusESCC2.77e-042.42e-010.0667
23091ZC3H13LZE8THumanEsophagusESCC4.13e-102.45e-010.067
23091ZC3H13LZE20THumanEsophagusESCC1.46e-029.89e-020.0662
23091ZC3H13LZE22D1HumanEsophagusHGIN2.12e-022.16e-020.0595
23091ZC3H13LZE24THumanEsophagusESCC3.61e-182.44e-010.0596
23091ZC3H13LZE21THumanEsophagusESCC4.63e-031.81e-010.0655
23091ZC3H13LZE6THumanEsophagusESCC3.69e-043.08e-020.0845
23091ZC3H13P1T-EHumanEsophagusESCC5.77e-055.96e-010.0875
23091ZC3H13P2T-EHumanEsophagusESCC9.72e-326.46e-010.1177
Page: 1 2 3 4 5 6 7 8 

check button Transcriptomic changes along malignancy continuum.
TissueExpression DynamicsAbbreviation
BreastThe image shows the transcriptomic changes along malignancy continuum.log2FC in expression of this searched gene in stem-like cells from each diseased tissue sample relative to stem-like cells in normal samples in each tissue plotted against the malignancy continuum. Samples are colored based on if they are from different disease stage.IDC: Invasive ductal carcinoma
DCIS: Ductal carcinoma in situ
Precancer(BRCA1-mut): Precancerous lesion from BRCA1 mutation carriers
EsophagusThe image shows the transcriptomic changes along malignancy continuum.log2FC in expression of this searched gene in stem-like cells from each diseased tissue sample relative to stem-like cells in normal samples in each tissue plotted against the malignancy continuum. Samples are colored based on if they are from different disease stage.
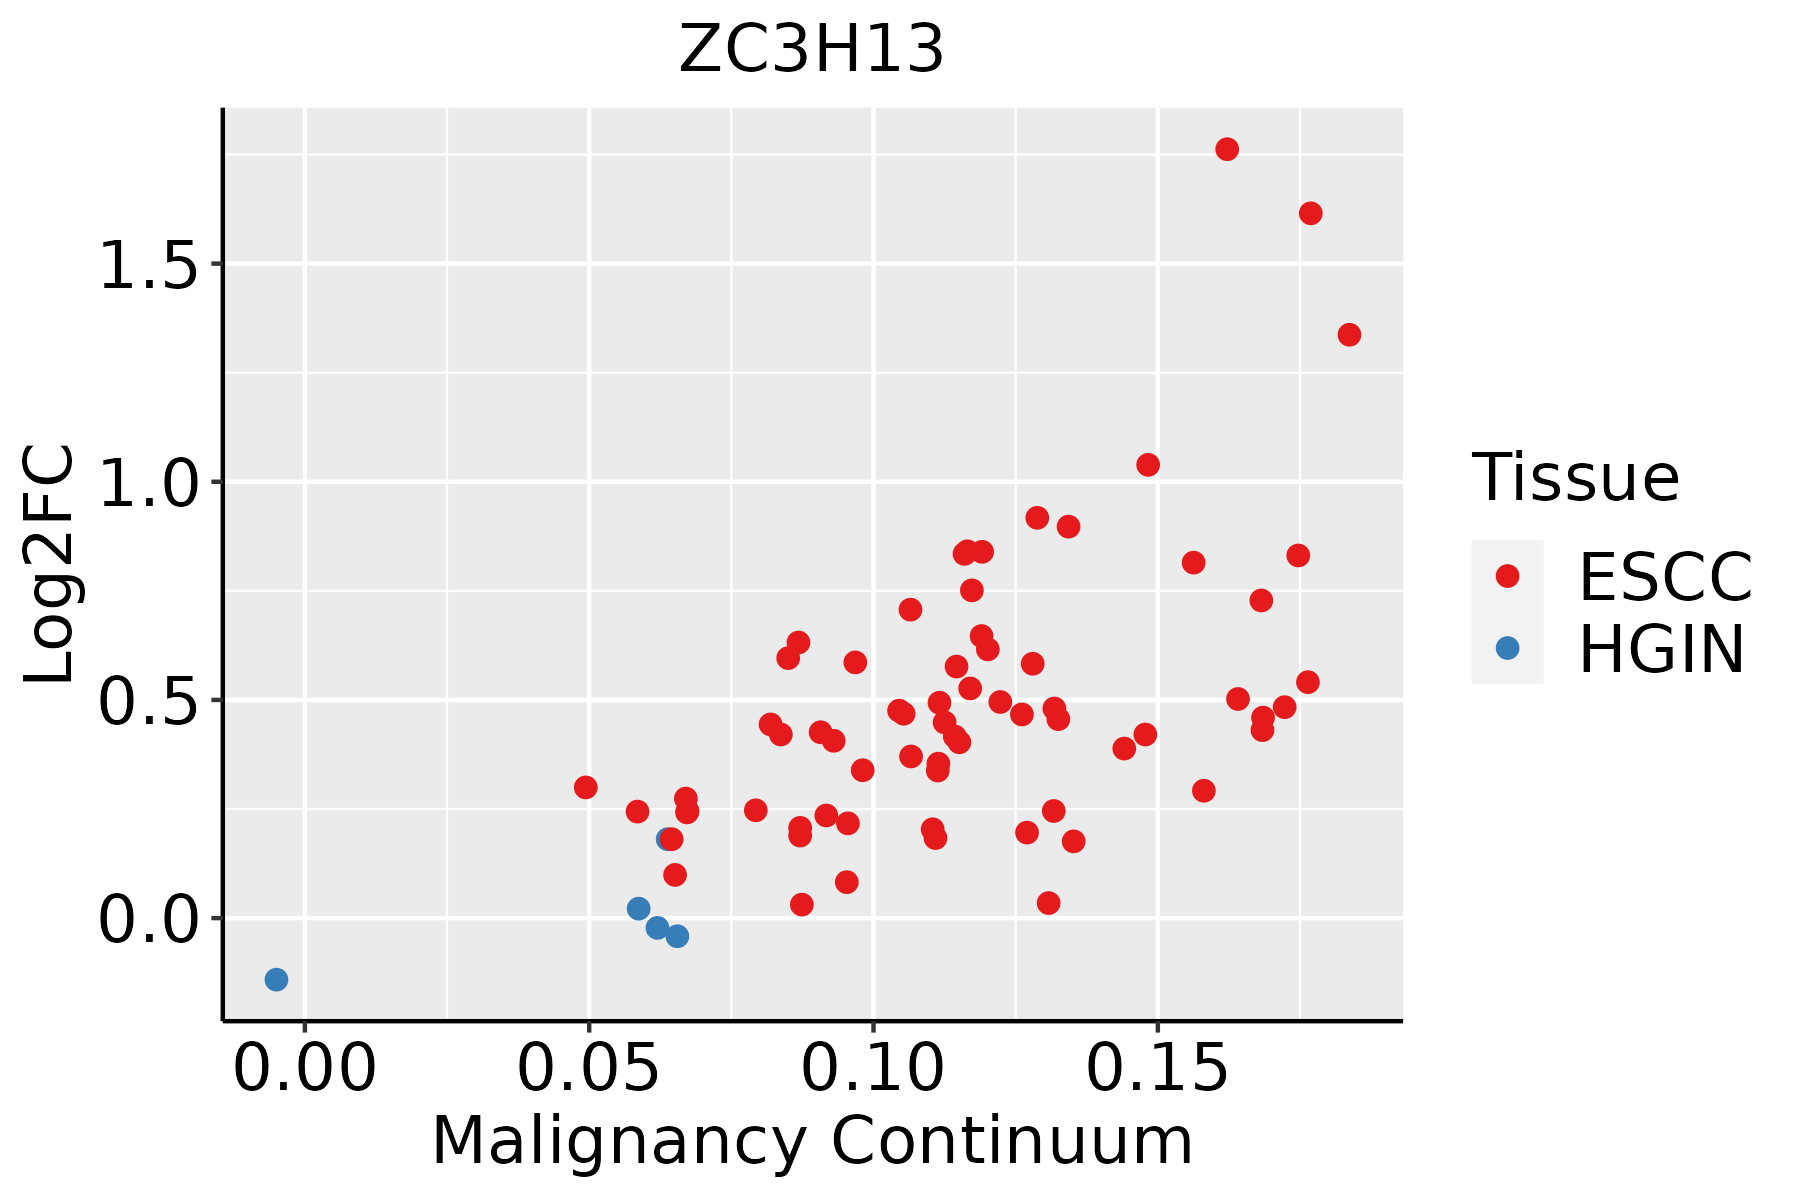
ESCC: Esophageal squamous cell carcinoma
HGIN: High-grade intraepithelial neoplasias
LGIN: Low-grade intraepithelial neoplasias
LiverThe image shows the transcriptomic changes along malignancy continuum.log2FC in expression of this searched gene in stem-like cells from each diseased tissue sample relative to stem-like cells in normal samples in each tissue plotted against the malignancy continuum. Samples are colored based on if they are from different disease stage.
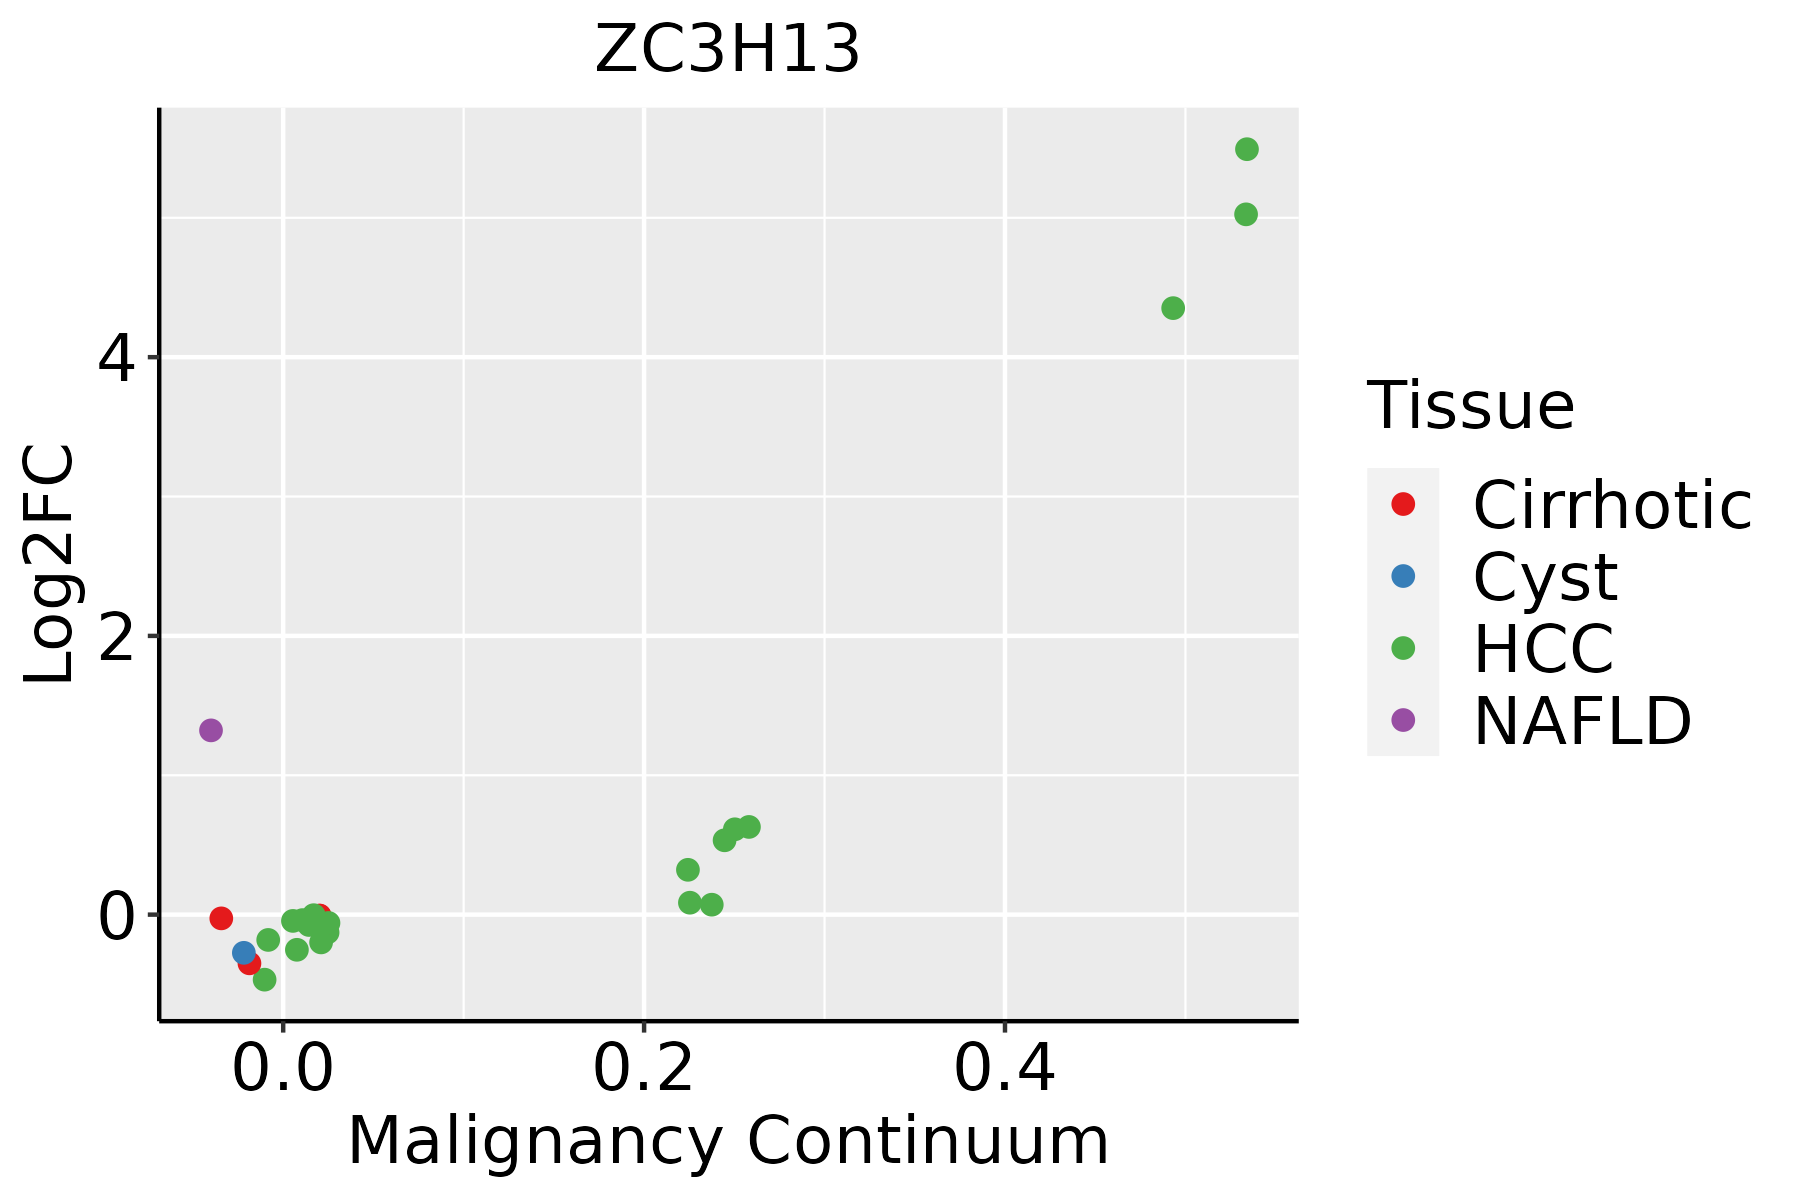
HCC: Hepatocellular carcinoma
NAFLD: Non-alcoholic fatty liver disease
Oral CavityThe image shows the transcriptomic changes along malignancy continuum.log2FC in expression of this searched gene in stem-like cells from each diseased tissue sample relative to stem-like cells in normal samples in each tissue plotted against the malignancy continuum. Samples are colored based on if they are from different disease stage.
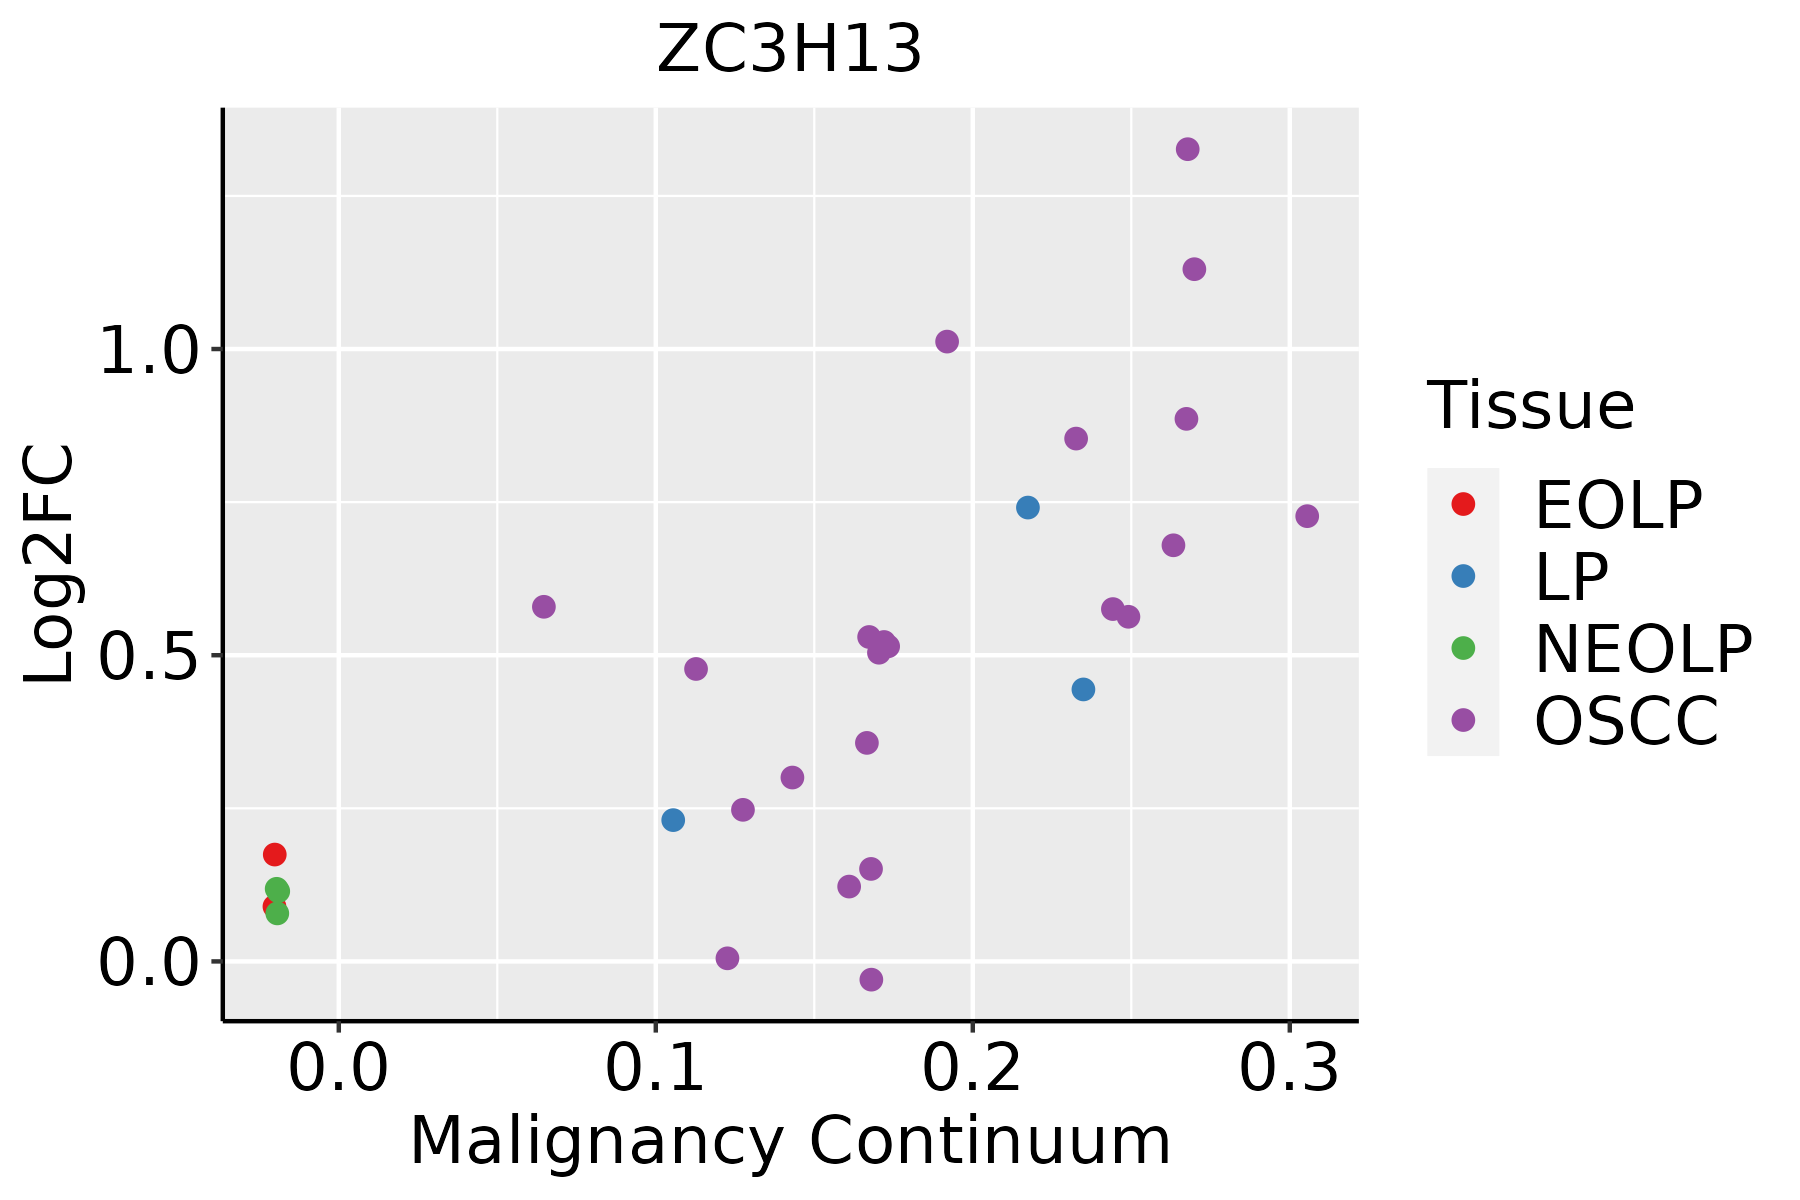
EOLP: Erosive Oral lichen planus
LP: leukoplakia
NEOLP: Non-erosive oral lichen planus
OSCC: Oral squamous cell carcinoma
ProstateThe image shows the transcriptomic changes along malignancy continuum.log2FC in expression of this searched gene in stem-like cells from each diseased tissue sample relative to stem-like cells in normal samples in each tissue plotted against the malignancy continuum. Samples are colored based on if they are from different disease stage.
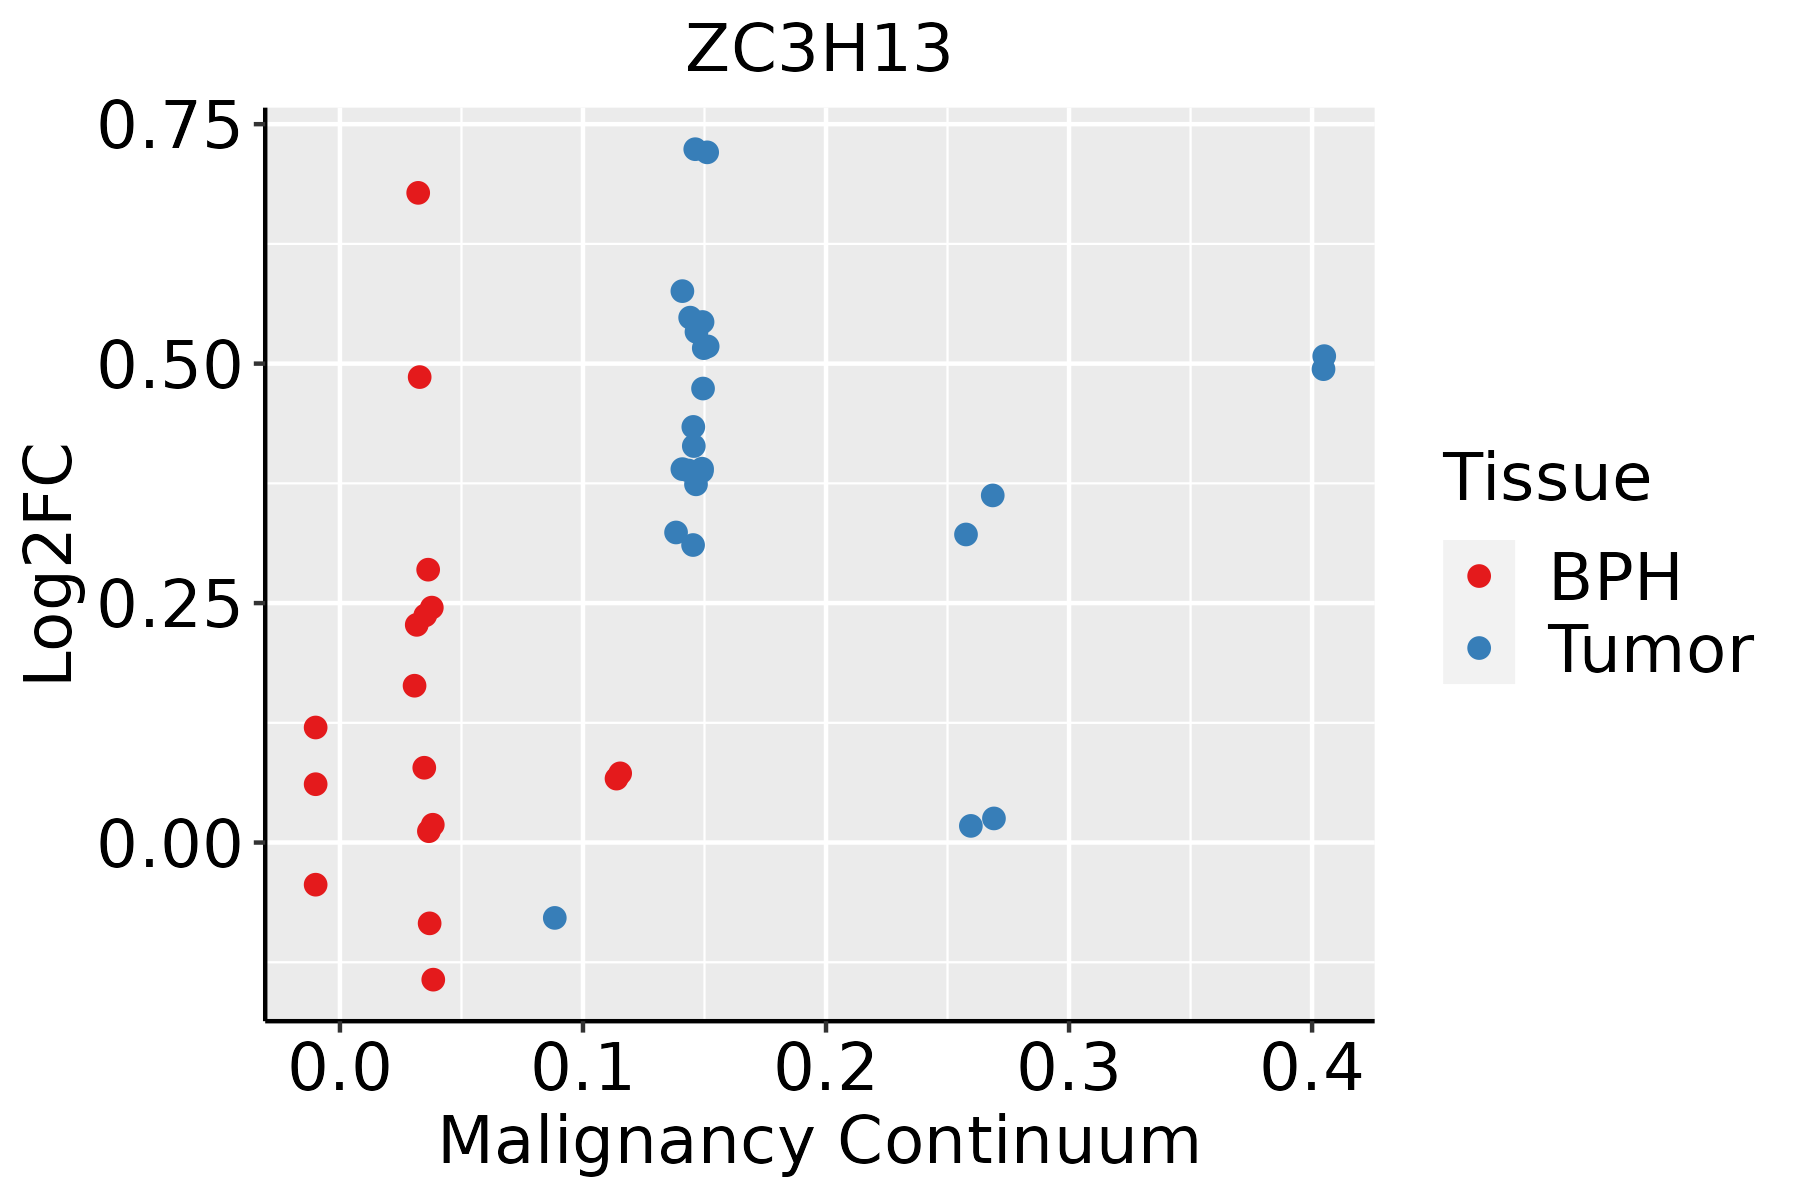
BPH: Benign Prostatic Hyperplasia
SkinThe image shows the transcriptomic changes along malignancy continuum.log2FC in expression of this searched gene in stem-like cells from each diseased tissue sample relative to stem-like cells in normal samples in each tissue plotted against the malignancy continuum. Samples are colored based on if they are from different disease stage.AK: Actinic keratosis
cSCC: Cutaneous squamous cell carcinoma
SCCIS:squamous cell carcinoma in situ
ThyroidThe image shows the transcriptomic changes along malignancy continuum.log2FC in expression of this searched gene in stem-like cells from each diseased tissue sample relative to stem-like cells in normal samples in each tissue plotted against the malignancy continuum. Samples are colored based on if they are from different disease stage.ATC: Anaplastic thyroid cancer
HT: Hashimoto's thyroiditis
PTC: Papillary thyroid cancer
∗log2FC in expression of this searched gene in stem-like cells from each diseased tissue sample relative to stem-like cells in normal samples in each tissue plotted against the malignancy continuum. Samples are colored based on if they are from different disease stage.

Top

Malignant transformation related pathway analysis

check buttonFind out the enriched GO biological processes and KEGG pathways involved in transition from healthy to precancer to cancer
check button Figure of enriched GO biological processes.
TissueDisease StageEnriched GO biological Processes
ColorectumADGO analysis - Figure of enriched GO biological processes: Top 15 enriched GO BP terms are showed in the bar plot of each disease state in each tissue. Each row represents a significant GO biological process which is colored according to the -log10(p.adjust).
ColorectumSERGO analysis - Figure of enriched GO biological processes: Top 15 enriched GO BP terms are showed in the bar plot of each disease state in each tissue. Each row represents a significant GO biological process which is colored according to the -log10(p.adjust).
ColorectumMSSGO analysis - Figure of enriched GO biological processes: Top 15 enriched GO BP terms are showed in the bar plot of each disease state in each tissue. Each row represents a significant GO biological process which is colored according to the -log10(p.adjust).
ColorectumMSI-HGO analysis - Figure of enriched GO biological processes: Top 15 enriched GO BP terms are showed in the bar plot of each disease state in each tissue. Each row represents a significant GO biological process which is colored according to the -log10(p.adjust).
ColorectumFAPGO analysis - Figure of enriched GO biological processes: Top 15 enriched GO BP terms are showed in the bar plot of each disease state in each tissue. Each row represents a significant GO biological process which is colored according to the -log10(p.adjust).
∗Top 15 enriched GO BP terms are showed in the bar plot of each disease state in each tissue. Each row represents a significant GO biological process which is colored according to the -log10(p.adjust).
Page: 1 2 3 4 5 6 7 8 9 

check button Enriched GO biological processes.
GO IDTissueDisease StageDescriptionGene RatioBg Ratiopvaluep.adjustCount
GO:000838014BreastIDCRNA splicing73/1434434/187231.27e-101.57e-0873
GO:000838024BreastDCISRNA splicing73/1390434/187233.05e-115.08e-0973
GO:000838026EsophagusHGINRNA splicing160/2587434/187233.74e-341.12e-30160
GO:00198277EsophagusHGINstem cell population maintenance39/2587131/187231.63e-066.14e-0539
GO:00987278EsophagusHGINmaintenance of cell number39/2587134/187233.02e-061.03e-0439
GO:20000362EsophagusHGINregulation of stem cell population maintenance11/258733/187233.55e-033.26e-0211
GO:0008380111EsophagusESCCRNA splicing336/8552434/187231.74e-423.67e-39336
GO:00434143EsophagusESCCmacromolecule methylation199/8552316/187233.44e-109.57e-09199
GO:00322592EsophagusESCCmethylation222/8552364/187232.26e-095.09e-08222
GO:00094512EsophagusESCCRNA modification114/8552167/187232.76e-096.04e-08114
GO:009872714EsophagusESCCmaintenance of cell number90/8552134/187233.94e-075.43e-0690
GO:001982714EsophagusESCCstem cell population maintenance88/8552131/187235.23e-076.97e-0688
GO:00015101EsophagusESCCRNA methylation58/855283/187236.87e-066.94e-0558
GO:00800092EsophagusESCCmRNA methylation14/855216/187236.78e-043.56e-0314
GO:00165561EsophagusESCCmRNA modification21/855227/187236.88e-043.61e-0321
GO:20000361EsophagusESCCregulation of stem cell population maintenance23/855233/187234.57e-031.78e-0223
GO:00083807LiverNAFLDRNA splicing70/1882434/187234.62e-051.10e-0370
GO:00198273LiverNAFLDstem cell population maintenance26/1882131/187235.40e-047.38e-0326
GO:00987273LiverNAFLDmaintenance of cell number26/1882134/187237.72e-049.73e-0326
GO:0043414LiverNAFLDmacromolecule methylation47/1882316/187234.08e-033.41e-0247
Page: 1 2 3 4 

check button Enriched KEGG pathways.
Pathway IDTissueDisease StageDescriptionGene RatioBg Ratiopvaluep.adjustqvalueCount
Page: 1 

Top

Cell-cell communication analysis

check buttonIdentification of potential cell-cell interactions between two cell types and their ligand-receptor pairs for different disease states
LigandReceptorLRpairPathwayTissueDisease Stage
Page: 1 

Top

Single-cell gene regulatory network inference analysis

check buttonFind out the significant the regulons (TFs) and the target genes of each regulon across cell types for different disease states
TFCell TypeTissueDisease StageTarget GeneRSSRegulon Activity
∗The dot plots of a searched regulon are shown for all cell subpopulations in each disease state of each tissue based on the regulon specific score inferred using pySCENIC and by calculating the average expression.
Page: 1 

Top

Somatic mutation of malignant transformation related genes

check buttonAnnotation of somatic variants for genes involved in malignant transformation
Hugo SymbolVariant ClassVariant ClassificationdbSNP RSHGVScHGVSpHGVSp ShortSWISSPROTBIOTYPESIFTPolyPhenTumor Sample BarcodeTissueHistologySexAgeStageTherapy TypesDrugsOutcome
ZC3H13SNVMissense_Mutationc.2654N>Ap.Arg885Lysp.R885KQ5T200protein_codingtolerated_low_confidence(0.51)benign(0.003)TCGA-A8-A08J-01Breastbreast invasive carcinomaFemale<65III/IVUnknownUnknownPD
ZC3H13SNVMissense_Mutationnovelc.1882G>Cp.Glu628Glnp.E628QQ5T200protein_codingdeleterious_low_confidence(0.01)possibly_damaging(0.703)TCGA-AC-A6IW-01Breastbreast invasive carcinomaFemale>=65I/IIUnknownUnknownSD
ZC3H13SNVMissense_Mutationrs375011338c.3782N>Ap.Arg1261Glnp.R1261QQ5T200protein_codingdeleterious_low_confidence(0)probably_damaging(0.992)TCGA-AN-A046-01Breastbreast invasive carcinomaFemale>=65I/IIUnknownUnknownSD
ZC3H13SNVMissense_Mutationrs767948149c.3259N>Ap.Ala1087Thrp.A1087TQ5T200protein_codingtolerated_low_confidence(0.88)benign(0)TCGA-AN-A046-01Breastbreast invasive carcinomaFemale>=65I/IIUnknownUnknownSD
ZC3H13SNVMissense_Mutationc.286N>Tp.Val96Leup.V96LQ5T200protein_codingdeleterious_low_confidence(0.01)benign(0.207)TCGA-BH-A1ES-06Breastbreast invasive carcinomaFemale<65I/IIUnknownUnknownPD
ZC3H13SNVMissense_Mutationrs550536100c.1988G>Ap.Arg663Glnp.R663QQ5T200protein_codingdeleterious_low_confidence(0)probably_damaging(0.988)TCGA-D8-A1J9-01Breastbreast invasive carcinomaFemale<65I/IIUnknownUnknownSD
ZC3H13SNVMissense_Mutationc.58A>Cp.Thr20Prop.T20PQ5T200protein_codingtolerated_low_confidence(0.24)possibly_damaging(0.69)TCGA-GI-A2C8-01Breastbreast invasive carcinomaFemale<65III/IVUnspecificAdriamycinSD
ZC3H13insertionNonsense_Mutationnovelc.3337_3338insTCTCTTGAGp.Thr1113delinsIleSerTerAlap.T1113delinsIS*AQ5T200protein_codingTCGA-A8-A08T-01Breastbreast invasive carcinomaFemale<65III/IVUnknownUnknownPD
ZC3H13insertionIn_Frame_Insnovelc.2009_2010insCAATGCAGCTGGp.Asp670_Arg671insAsnAlaAlaGlyp.D670_R671insNAAGQ5T200protein_codingTCGA-AN-A04C-01Breastbreast invasive carcinomaFemale<65I/IIUnknownUnknownSD
ZC3H13insertionIn_Frame_Insnovelc.2196_2197insAAGCTTGGGCCTGTGAGTTGTCATp.Asp732_His733insLysLeuGlyProValSerCysHisp.D732_H733insKLGPVSCHQ5T200protein_codingTCGA-AR-A0TY-01Breastbreast invasive carcinomaFemale<65I/IIUnspecificPaclitaxelPD
Page: 1 2 3 4 5 6 7 8 9 10 11 12 13 14 15 16 17 18 19 20 21 22 

Top

Related drugs of malignant transformation related genes

check buttonIdentification of chemicals and drugs interact with genes involved in malignant transfromation
(DGIdb 4.0)
Entrez IDSymbolCategoryInteraction TypesDrug Claim NameDrug NamePMIDs
Page: 1