Schematic overview of the cellular and molecular mechanisms involved in the cancer progression, including the proposed cellular and molecular mechanisms in cancer cells trajectory. AT1: alveolar type 1 cells; AT2: alveolar type 2 cells; AAH: atypical adenomatous hyperplasia; AIS: adenocarcinoma in situ; MIA: minimally invasive adenocarcinoma; IA: invasive adenocarcinoma; EMT: epithelial-mesenchymal transition

Home

Download

Statistics

Help

Contact

Center for Computational Systems Medicine
leaf

Gene summary

leaf

Malignant transformation analysis

leaf

Malignant transformation related pathway analysis

leaf

Cell-cell communication analysis

leaf

Single-cell gene regulatory network inference analysis

leaf

Somatic mutation of malignant transformation related genes

leaf

Related drugs of malignant transformation related genes

Gene: ZC3H12A

Gene summary for ZC3H12A

check button Gene summary.

Gene informationSpeciesHuman
Gene symbol

ZC3H12A

Gene ID

80149

Gene namezinc finger CCCH-type containing 12A
Gene AliasMCPIP
Cytomap1p34.3
Gene Typeprotein-coding
GO ID

GO:0000165

UniProtAcc

Q5D1E8


Top

Malignant transformation analysis

check button Identification of the aberrant gene expression in precancerous and cancerous lesions by comparing the gene expression of stem-like cells in diseased tissues with normal stem cells
check button Malignant transformation involving gene list.
Entrez IDSymbolReplicatesSpeciesOrganTissueAdj P-valueLog2FCMalignancy
80149ZC3H12ALZE8THumanEsophagusESCC3.92e-231.39e+000.067
80149ZC3H12ALZE20THumanEsophagusESCC1.23e-037.61e-010.0662
80149ZC3H12ALZE24THumanEsophagusESCC5.58e-141.14e+000.0596
80149ZC3H12ALZE21THumanEsophagusESCC4.72e-039.34e-010.0655
80149ZC3H12AP1T-EHumanEsophagusESCC5.46e-161.51e+000.0875
80149ZC3H12AP2T-EHumanEsophagusESCC8.06e-381.27e+000.1177
80149ZC3H12AP4T-EHumanEsophagusESCC2.12e-177.93e-010.1323
80149ZC3H12AP5T-EHumanEsophagusESCC6.03e-309.50e-010.1327
80149ZC3H12AP8T-EHumanEsophagusESCC6.27e-127.93e-010.0889
80149ZC3H12AP9T-EHumanEsophagusESCC4.68e-083.87e-010.1131
80149ZC3H12AP10T-EHumanEsophagusESCC2.66e-06-1.50e-010.116
80149ZC3H12AP11T-EHumanEsophagusESCC1.64e-171.68e+000.1426
80149ZC3H12AP15T-EHumanEsophagusESCC5.62e-147.66e-010.1149
80149ZC3H12AP20T-EHumanEsophagusESCC8.48e-351.98e+000.1124
80149ZC3H12AP21T-EHumanEsophagusESCC7.09e-461.78e+000.1617
80149ZC3H12AP22T-EHumanEsophagusESCC1.77e-03-8.40e-020.1236
80149ZC3H12AP23T-EHumanEsophagusESCC4.16e-492.25e+000.108
80149ZC3H12AP24T-EHumanEsophagusESCC8.32e-065.47e-010.1287
80149ZC3H12AP26T-EHumanEsophagusESCC2.57e-107.52e-010.1276
80149ZC3H12AP27T-EHumanEsophagusESCC7.78e-291.42e+000.1055
Page: 1 2 3 4 5 6 

check button Transcriptomic changes along malignancy continuum.
TissueExpression DynamicsAbbreviation
EsophagusThe image shows the transcriptomic changes along malignancy continuum.log2FC in expression of this searched gene in stem-like cells from each diseased tissue sample relative to stem-like cells in normal samples in each tissue plotted against the malignancy continuum. Samples are colored based on if they are from different disease stage.
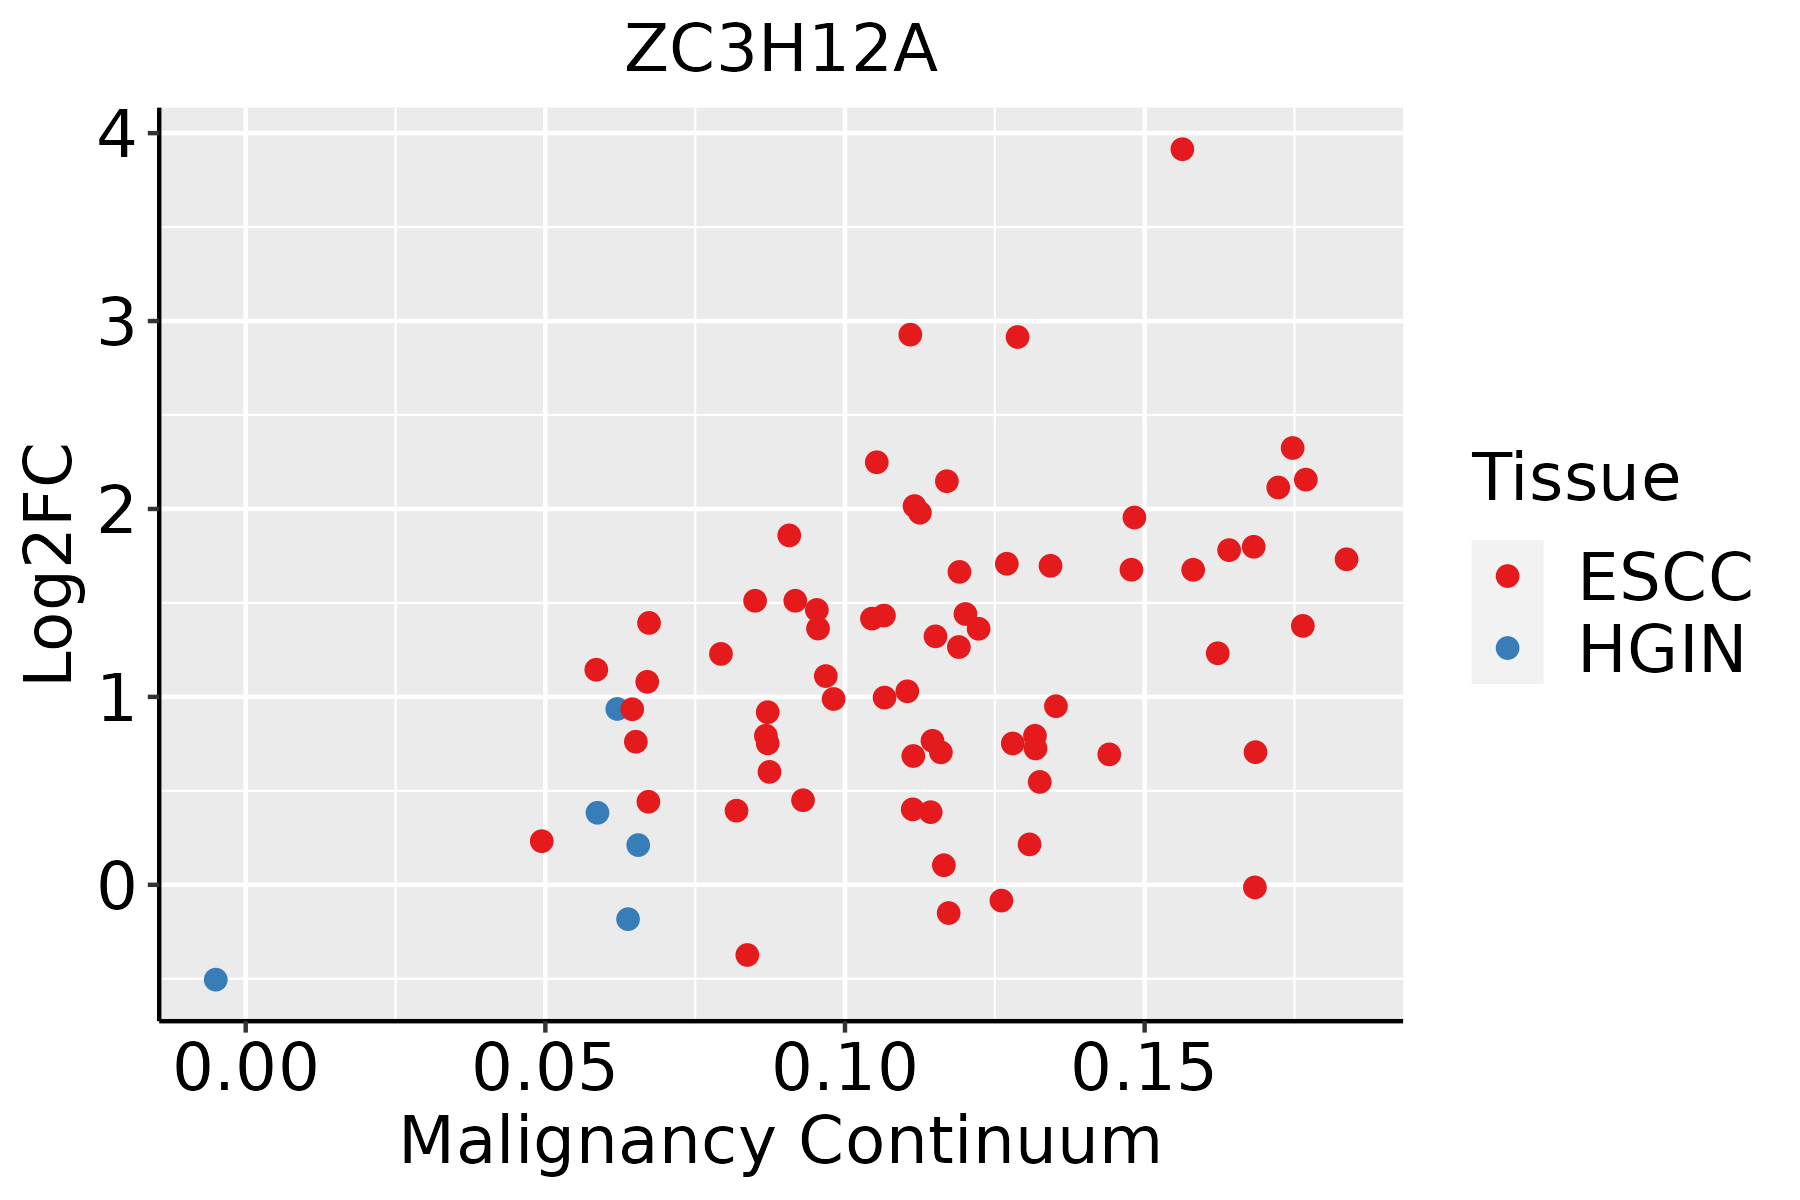
ESCC: Esophageal squamous cell carcinoma
HGIN: High-grade intraepithelial neoplasias
LGIN: Low-grade intraepithelial neoplasias
LiverThe image shows the transcriptomic changes along malignancy continuum.log2FC in expression of this searched gene in stem-like cells from each diseased tissue sample relative to stem-like cells in normal samples in each tissue plotted against the malignancy continuum. Samples are colored based on if they are from different disease stage.
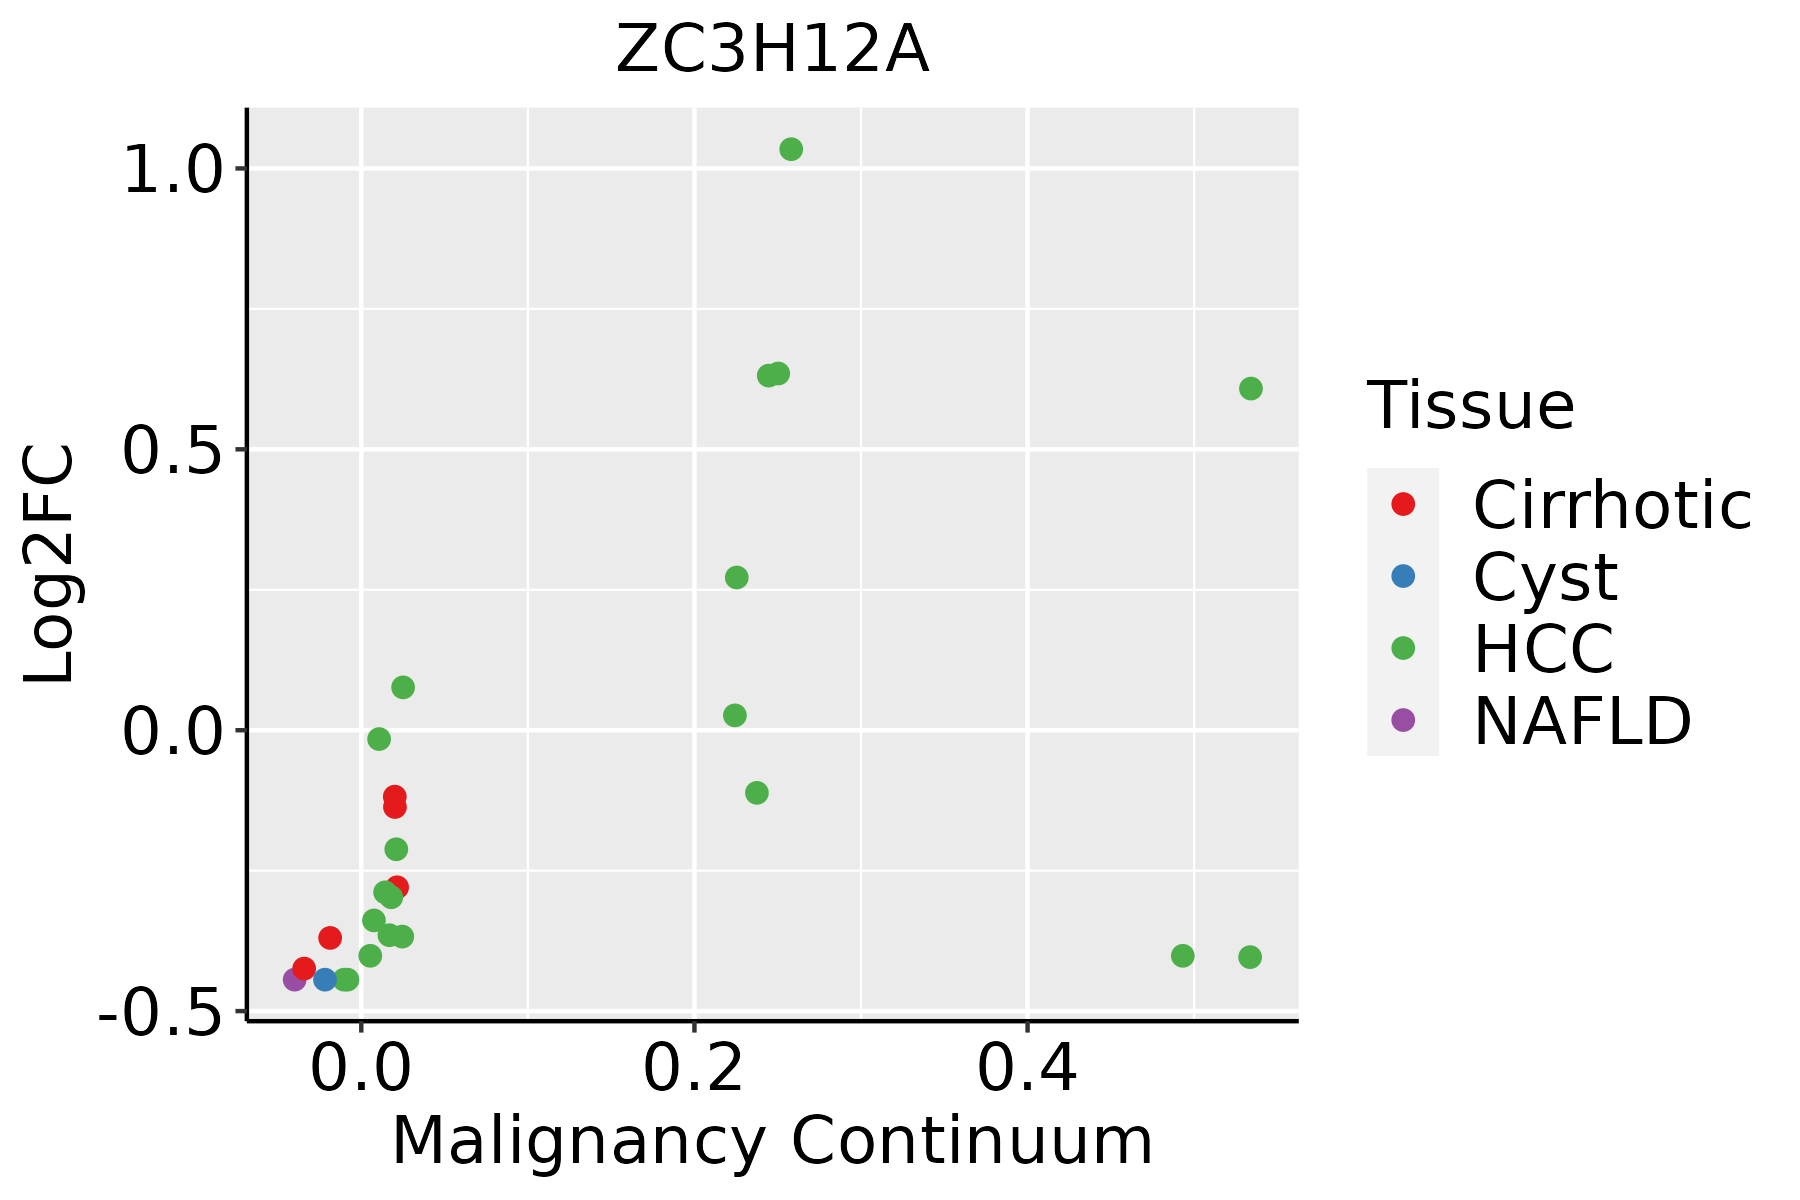
HCC: Hepatocellular carcinoma
NAFLD: Non-alcoholic fatty liver disease
LungThe image shows the transcriptomic changes along malignancy continuum.log2FC in expression of this searched gene in stem-like cells from each diseased tissue sample relative to stem-like cells in normal samples in each tissue plotted against the malignancy continuum. Samples are colored based on if they are from different disease stage.
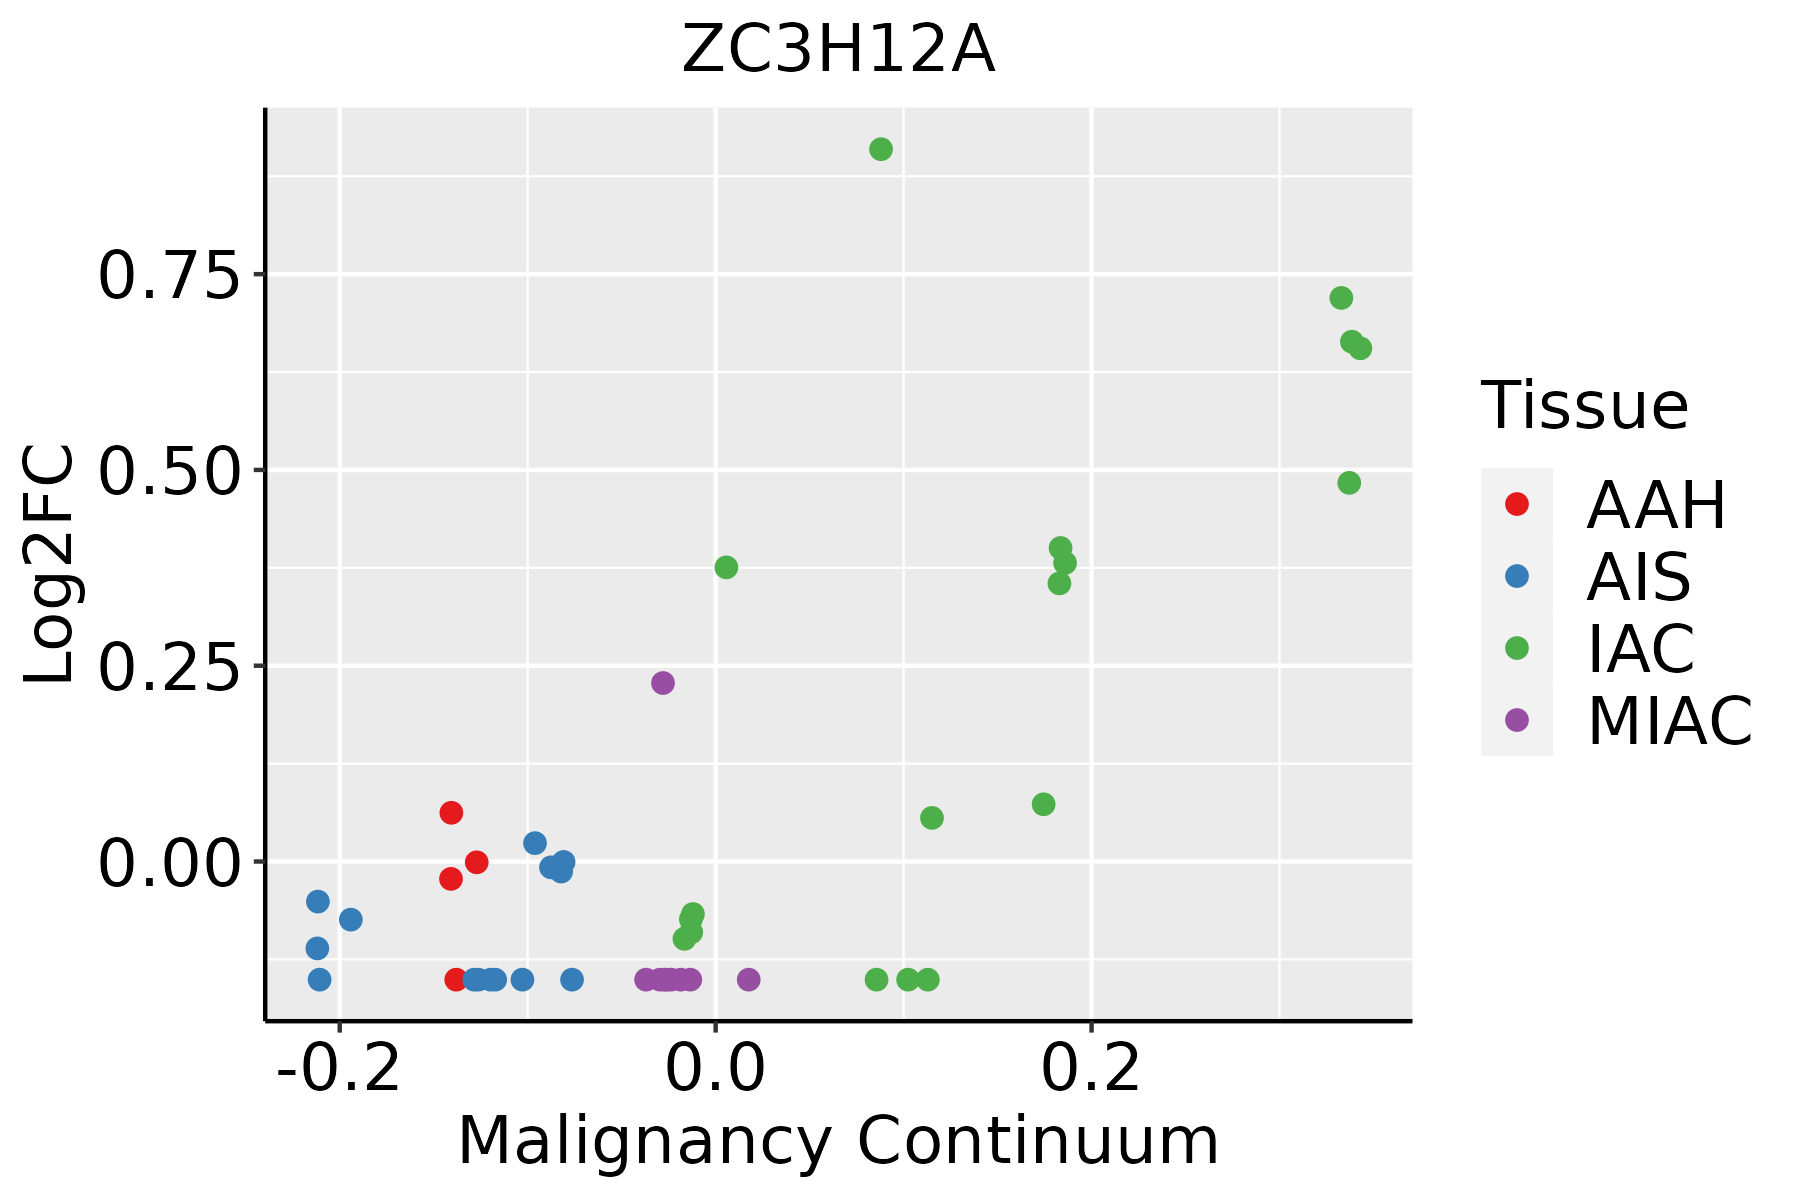
AAH: Atypical adenomatous hyperplasia
AIS: Adenocarcinoma in situ
IAC: Invasive lung adenocarcinoma
MIA: Minimally invasive adenocarcinoma
Oral CavityThe image shows the transcriptomic changes along malignancy continuum.log2FC in expression of this searched gene in stem-like cells from each diseased tissue sample relative to stem-like cells in normal samples in each tissue plotted against the malignancy continuum. Samples are colored based on if they are from different disease stage.
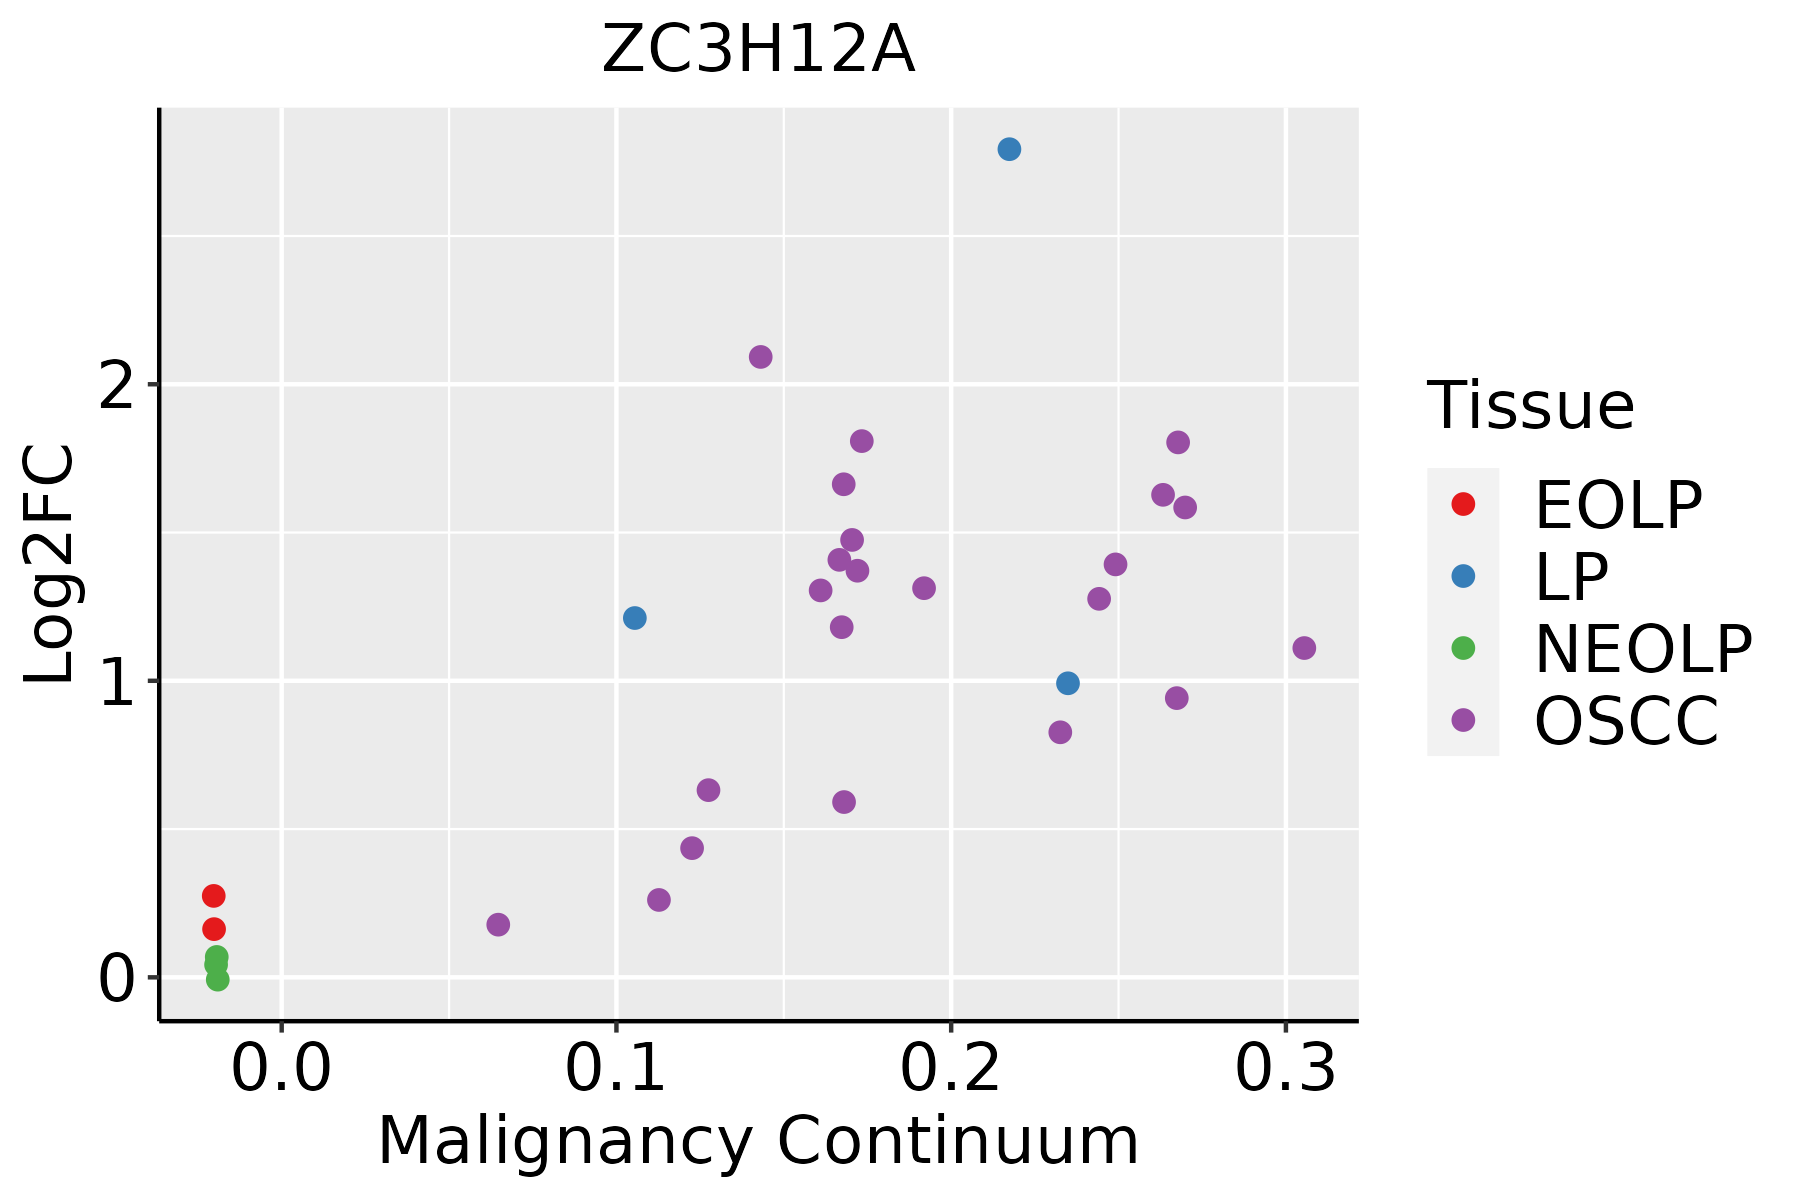
EOLP: Erosive Oral lichen planus
LP: leukoplakia
NEOLP: Non-erosive oral lichen planus
OSCC: Oral squamous cell carcinoma
ProstateThe image shows the transcriptomic changes along malignancy continuum.log2FC in expression of this searched gene in stem-like cells from each diseased tissue sample relative to stem-like cells in normal samples in each tissue plotted against the malignancy continuum. Samples are colored based on if they are from different disease stage.BPH: Benign Prostatic Hyperplasia
SkinThe image shows the transcriptomic changes along malignancy continuum.log2FC in expression of this searched gene in stem-like cells from each diseased tissue sample relative to stem-like cells in normal samples in each tissue plotted against the malignancy continuum. Samples are colored based on if they are from different disease stage.
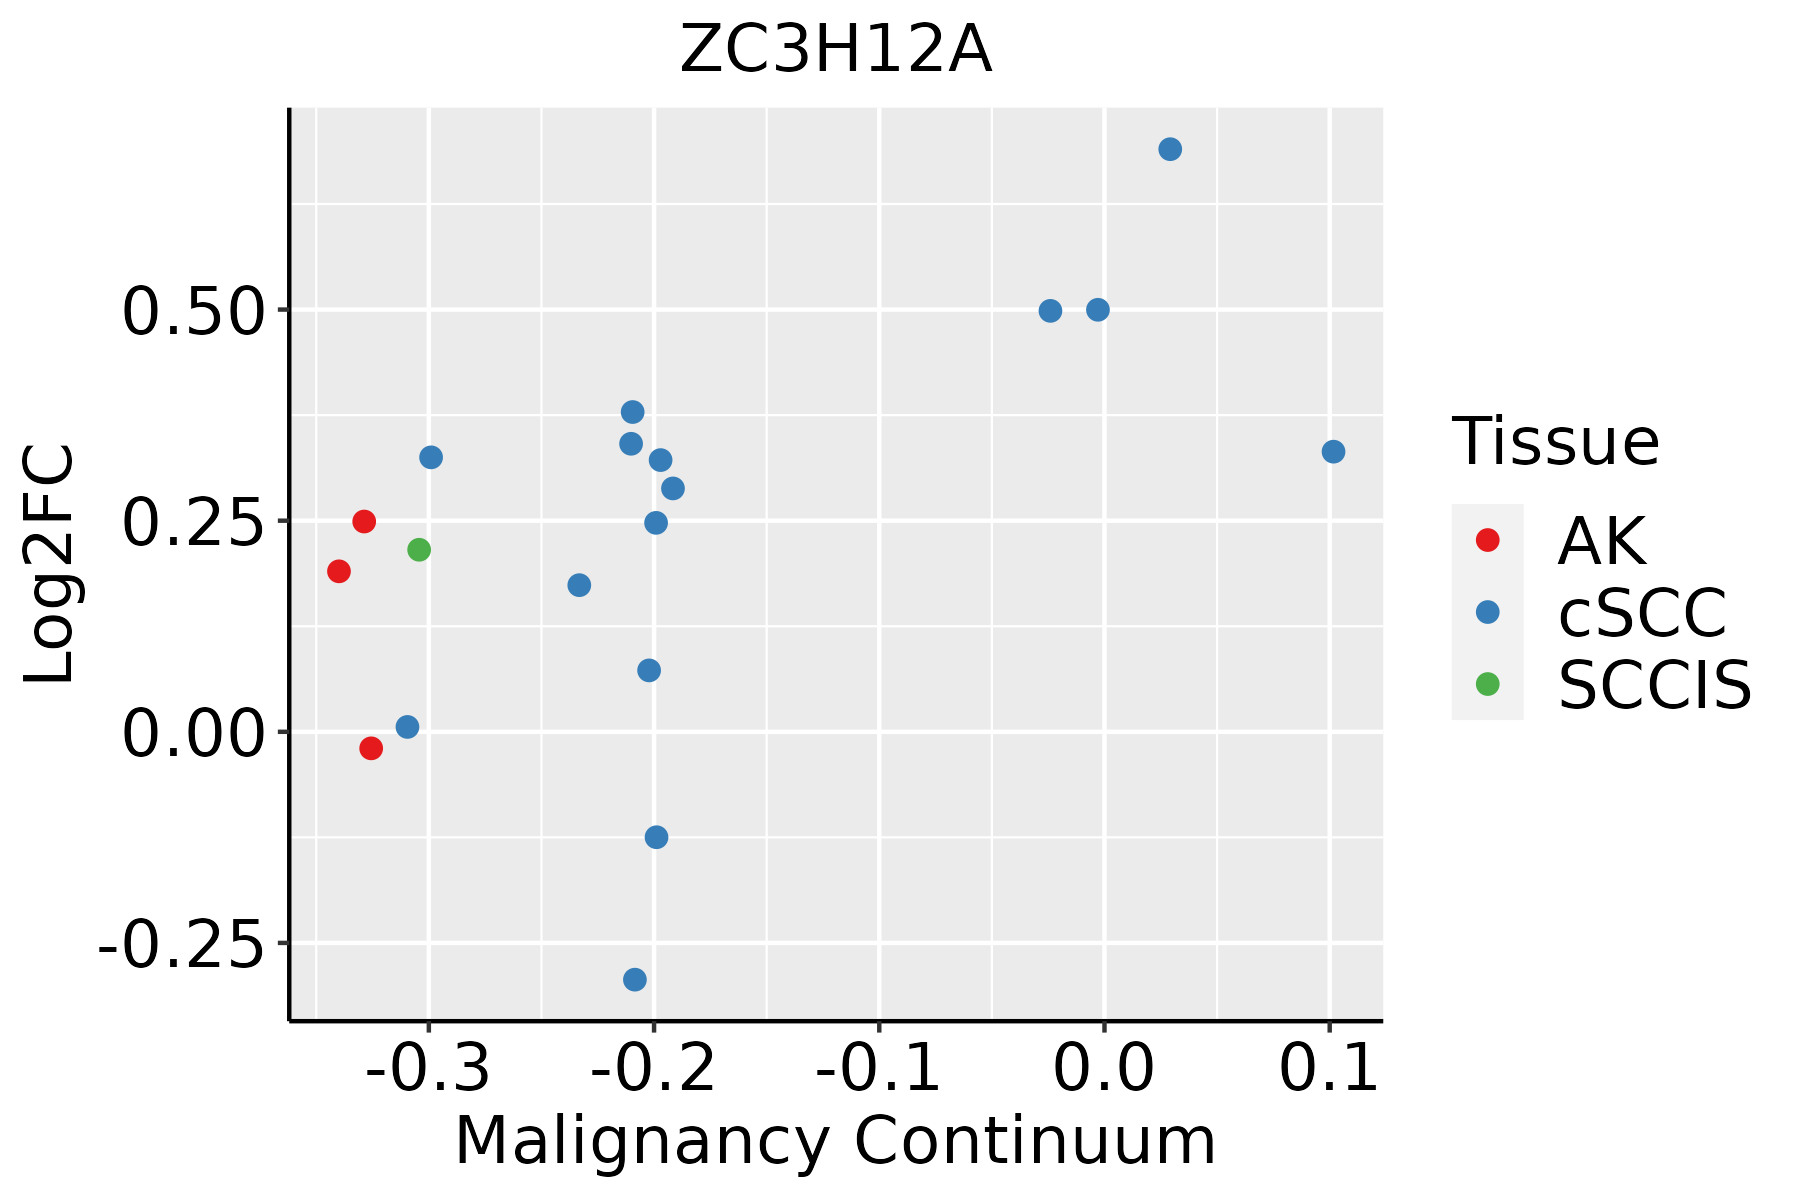
AK: Actinic keratosis
cSCC: Cutaneous squamous cell carcinoma
SCCIS:squamous cell carcinoma in situ
∗log2FC in expression of this searched gene in stem-like cells from each diseased tissue sample relative to stem-like cells in normal samples in each tissue plotted against the malignancy continuum. Samples are colored based on if they are from different disease stage.

Top

Malignant transformation related pathway analysis

check buttonFind out the enriched GO biological processes and KEGG pathways involved in transition from healthy to precancer to cancer
check button Figure of enriched GO biological processes.
TissueDisease StageEnriched GO biological Processes
ColorectumADGO analysis - Figure of enriched GO biological processes: Top 15 enriched GO BP terms are showed in the bar plot of each disease state in each tissue. Each row represents a significant GO biological process which is colored according to the -log10(p.adjust).
ColorectumSERGO analysis - Figure of enriched GO biological processes: Top 15 enriched GO BP terms are showed in the bar plot of each disease state in each tissue. Each row represents a significant GO biological process which is colored according to the -log10(p.adjust).
ColorectumMSSGO analysis - Figure of enriched GO biological processes: Top 15 enriched GO BP terms are showed in the bar plot of each disease state in each tissue. Each row represents a significant GO biological process which is colored according to the -log10(p.adjust).
ColorectumMSI-HGO analysis - Figure of enriched GO biological processes: Top 15 enriched GO BP terms are showed in the bar plot of each disease state in each tissue. Each row represents a significant GO biological process which is colored according to the -log10(p.adjust).
ColorectumFAPGO analysis - Figure of enriched GO biological processes: Top 15 enriched GO BP terms are showed in the bar plot of each disease state in each tissue. Each row represents a significant GO biological process which is colored according to the -log10(p.adjust).
∗Top 15 enriched GO BP terms are showed in the bar plot of each disease state in each tissue. Each row represents a significant GO biological process which is colored according to the -log10(p.adjust).
Page: 1 2 3 4 5 6 7 8 9 

check button Enriched GO biological processes.
GO IDTissueDisease StageDescriptionGene RatioBg Ratiopvaluep.adjustCount
GO:0072594110EsophagusESCCestablishment of protein localization to organelle311/8552422/187233.02e-322.13e-29311
GO:003466012EsophagusESCCncRNA metabolic process346/8552485/187234.35e-312.51e-28346
GO:0016032111EsophagusESCCviral process301/8552415/187233.34e-291.32e-26301
GO:0006913110EsophagusESCCnucleocytoplasmic transport230/8552301/187236.04e-282.02e-25230
GO:0051169110EsophagusESCCnuclear transport230/8552301/187236.04e-282.02e-25230
GO:003238618EsophagusESCCregulation of intracellular transport243/8552337/187233.20e-237.25e-21243
GO:0009896111EsophagusESCCpositive regulation of catabolic process332/8552492/187234.36e-239.22e-21332
GO:0006979111EsophagusESCCresponse to oxidative stress303/8552446/187237.15e-221.30e-19303
GO:0031331111EsophagusESCCpositive regulation of cellular catabolic process292/8552427/187238.67e-221.53e-19292
GO:1903311110EsophagusESCCregulation of mRNA metabolic process210/8552288/187233.25e-215.56e-19210
GO:0006401110EsophagusESCCRNA catabolic process204/8552278/187233.39e-215.66e-19204
GO:003450418EsophagusESCCprotein localization to nucleus211/8552290/187234.06e-216.60e-19211
GO:0019058111EsophagusESCCviral life cycle226/8552317/187231.17e-201.76e-18226
GO:1903320111EsophagusESCCregulation of protein modification by small protein conjugation or removal181/8552242/187231.80e-202.60e-18181
GO:0045862111EsophagusESCCpositive regulation of proteolysis256/8552372/187237.88e-209.43e-18256
GO:1903829111EsophagusESCCpositive regulation of cellular protein localization199/8552276/187232.99e-193.45e-17199
GO:0062197111EsophagusESCCcellular response to chemical stress234/8552337/187235.37e-195.97e-17234
GO:0034655110EsophagusESCCnucleobase-containing compound catabolic process272/8552407/187232.92e-182.90e-16272
GO:0033157110EsophagusESCCregulation of intracellular protein transport169/8552229/187233.31e-183.23e-16169
GO:001050617EsophagusESCCregulation of autophagy220/8552317/187236.72e-186.36e-16220
Page: 1 2 3 4 5 6 7 8 9 10 11 12 13 14 15 16 17 18 19 20 21 22 23 24 25 26 27 28 29 30 31 32 33 34 35 36 37 38 39 40 41 42 43 44 45 46 47 48 49 50 51 52 53 54 55 56 57 58 59 60 61 62 63 64 65 66 67 68 69 70 71 72 

check button Enriched KEGG pathways.
Pathway IDTissueDisease StageDescriptionGene RatioBg Ratiopvaluep.adjustqvalueCount
Page: 1 

Top

Cell-cell communication analysis

check buttonIdentification of potential cell-cell interactions between two cell types and their ligand-receptor pairs for different disease states
LigandReceptorLRpairPathwayTissueDisease Stage
Page: 1 

Top

Single-cell gene regulatory network inference analysis

check buttonFind out the significant the regulons (TFs) and the target genes of each regulon across cell types for different disease states
TFCell TypeTissueDisease StageTarget GeneRSSRegulon Activity
∗The dot plots of a searched regulon are shown for all cell subpopulations in each disease state of each tissue based on the regulon specific score inferred using pySCENIC and by calculating the average expression.
Page: 1 

Top

Somatic mutation of malignant transformation related genes

check buttonAnnotation of somatic variants for genes involved in malignant transformation
Hugo SymbolVariant ClassVariant ClassificationdbSNP RSHGVScHGVSpHGVSp ShortSWISSPROTBIOTYPESIFTPolyPhenTumor Sample BarcodeTissueHistologySexAgeStageTherapy TypesDrugsOutcome
ZC3H12ASNVMissense_Mutationnovelc.925N>Cp.Gly309Argp.G309RQ5D1E8protein_codingdeleterious(0)probably_damaging(0.991)TCGA-A7-A6VY-01Breastbreast invasive carcinomaFemale<65I/IIChemotherapycyclophosphamideCR
ZC3H12ASNVMissense_Mutationnovelc.698N>Tp.Ala233Valp.A233VQ5D1E8protein_codingdeleterious(0)probably_damaging(0.999)TCGA-AC-A2FE-01Breastbreast invasive carcinomaFemale<65III/IVChemotherapyadriamycinPD
ZC3H12ASNVMissense_Mutationnovelc.754N>Ap.Glu252Lysp.E252KQ5D1E8protein_codingdeleterious(0.02)probably_damaging(0.954)TCGA-AC-A2QI-01Breastbreast invasive carcinomaFemale>=65III/IVChemotherapycytoxanCR
ZC3H12ASNVMissense_Mutationc.1711N>Ap.Ala571Thrp.A571TQ5D1E8protein_codingtolerated(0.33)benign(0.044)TCGA-AN-A0AK-01Breastbreast invasive carcinomaFemale>=65I/IIUnknownUnknownSD
ZC3H12ASNVMissense_Mutationc.1792N>Gp.Ser598Glyp.S598GQ5D1E8protein_codingdeleterious_low_confidence(0.02)benign(0)TCGA-AO-A128-01Breastbreast invasive carcinomaFemale<65I/IIChemotherapydoxorubicinSD
ZC3H12ASNVMissense_Mutationc.1684N>Ap.Gly562Serp.G562SQ5D1E8protein_codingdeleterious(0.04)benign(0.219)TCGA-BH-A0E0-01Breastbreast invasive carcinomaFemale<65III/IVChemotherapydocetaxelSD
ZC3H12ASNVMissense_Mutationc.1457N>Gp.Ala486Glyp.A486GQ5D1E8protein_codingtolerated(0.57)benign(0.001)TCGA-E9-A245-01Breastbreast invasive carcinomaFemale<65I/IIHormone TherapytamoxiphenSD
ZC3H12ASNVMissense_Mutationnovelc.574N>Gp.Pro192Alap.P192AQ5D1E8protein_codingtolerated(0.25)probably_damaging(0.99)TCGA-S3-AA10-01Breastbreast invasive carcinomaFemale>=65I/IIChemotherapycytoxanCR
ZC3H12ASNVMissense_Mutationnovelc.725C>Tp.Ser242Phep.S242FQ5D1E8protein_codingdeleterious(0)probably_damaging(1)TCGA-XX-A89A-01Breastbreast invasive carcinomaFemale>=65I/IIUnknownUnknownSD
ZC3H12AinsertionNonsense_Mutationnovelc.971_972insTTGCTAAGAGTCCCCTAGCATCTTCCTGATGGTCTTTCTGCCTTp.Glu324AspfsTer3p.E324Dfs*3Q5D1E8protein_codingTCGA-AR-A0TY-01Breastbreast invasive carcinomaFemale<65I/IIUnspecificPaclitaxelPD
Page: 1 2 3 4 5 6 7 8 

Top

Related drugs of malignant transformation related genes

check buttonIdentification of chemicals and drugs interact with genes involved in malignant transfromation
(DGIdb 4.0)
Entrez IDSymbolCategoryInteraction TypesDrug Claim NameDrug NamePMIDs
Page: 1