
|
|||||
|
 | |
| |
| |
| |
| |
| |
|
Gene: ZC2HC1A |
Gene summary for ZC2HC1A |
| Gene information | Species | Human | Gene symbol | ZC2HC1A | Gene ID | 51101 |
| Gene name | zinc finger C2HC-type containing 1A | |
| Gene Alias | C8orf70 | |
| Cytomap | 8q21.13 | |
| Gene Type | protein-coding | GO ID | GO:0003674 | UniProtAcc | B2R9B8 |
Top |
Malignant transformation analysis |
| Identification of the aberrant gene expression in precancerous and cancerous lesions by comparing the gene expression of stem-like cells in diseased tissues with normal stem cells |
| Entrez ID | Symbol | Replicates | Species | Organ | Tissue | Adj P-value | Log2FC | Malignancy |
| 51101 | ZC2HC1A | LZE4T | Human | Esophagus | ESCC | 1.43e-10 | 3.61e-01 | 0.0811 |
| 51101 | ZC2HC1A | LZE8T | Human | Esophagus | ESCC | 2.94e-09 | 2.56e-01 | 0.067 |
| 51101 | ZC2HC1A | LZE24T | Human | Esophagus | ESCC | 8.22e-13 | 4.30e-01 | 0.0596 |
| 51101 | ZC2HC1A | P1T-E | Human | Esophagus | ESCC | 1.09e-04 | 4.24e-01 | 0.0875 |
| 51101 | ZC2HC1A | P2T-E | Human | Esophagus | ESCC | 3.10e-22 | 3.65e-01 | 0.1177 |
| 51101 | ZC2HC1A | P4T-E | Human | Esophagus | ESCC | 2.12e-18 | 4.63e-01 | 0.1323 |
| 51101 | ZC2HC1A | P5T-E | Human | Esophagus | ESCC | 3.58e-06 | 1.10e-01 | 0.1327 |
| 51101 | ZC2HC1A | P8T-E | Human | Esophagus | ESCC | 1.94e-24 | 4.21e-01 | 0.0889 |
| 51101 | ZC2HC1A | P9T-E | Human | Esophagus | ESCC | 1.32e-04 | 1.50e-01 | 0.1131 |
| 51101 | ZC2HC1A | P10T-E | Human | Esophagus | ESCC | 2.39e-23 | 2.96e-01 | 0.116 |
| 51101 | ZC2HC1A | P11T-E | Human | Esophagus | ESCC | 1.13e-14 | 5.02e-01 | 0.1426 |
| 51101 | ZC2HC1A | P12T-E | Human | Esophagus | ESCC | 5.23e-03 | 1.23e-02 | 0.1122 |
| 51101 | ZC2HC1A | P15T-E | Human | Esophagus | ESCC | 4.65e-05 | 1.76e-01 | 0.1149 |
| 51101 | ZC2HC1A | P16T-E | Human | Esophagus | ESCC | 4.85e-55 | 1.03e+00 | 0.1153 |
| 51101 | ZC2HC1A | P17T-E | Human | Esophagus | ESCC | 3.54e-09 | 2.73e-01 | 0.1278 |
| 51101 | ZC2HC1A | P20T-E | Human | Esophagus | ESCC | 6.08e-10 | 6.88e-02 | 0.1124 |
| 51101 | ZC2HC1A | P21T-E | Human | Esophagus | ESCC | 1.35e-03 | 1.15e-02 | 0.1617 |
| 51101 | ZC2HC1A | P22T-E | Human | Esophagus | ESCC | 2.97e-19 | 3.46e-01 | 0.1236 |
| 51101 | ZC2HC1A | P23T-E | Human | Esophagus | ESCC | 2.84e-02 | 1.85e-01 | 0.108 |
| 51101 | ZC2HC1A | P24T-E | Human | Esophagus | ESCC | 5.40e-12 | 1.20e-01 | 0.1287 |
| Page: 1 2 3 4 |
| Tissue | Expression Dynamics | Abbreviation |
| Esophagus | 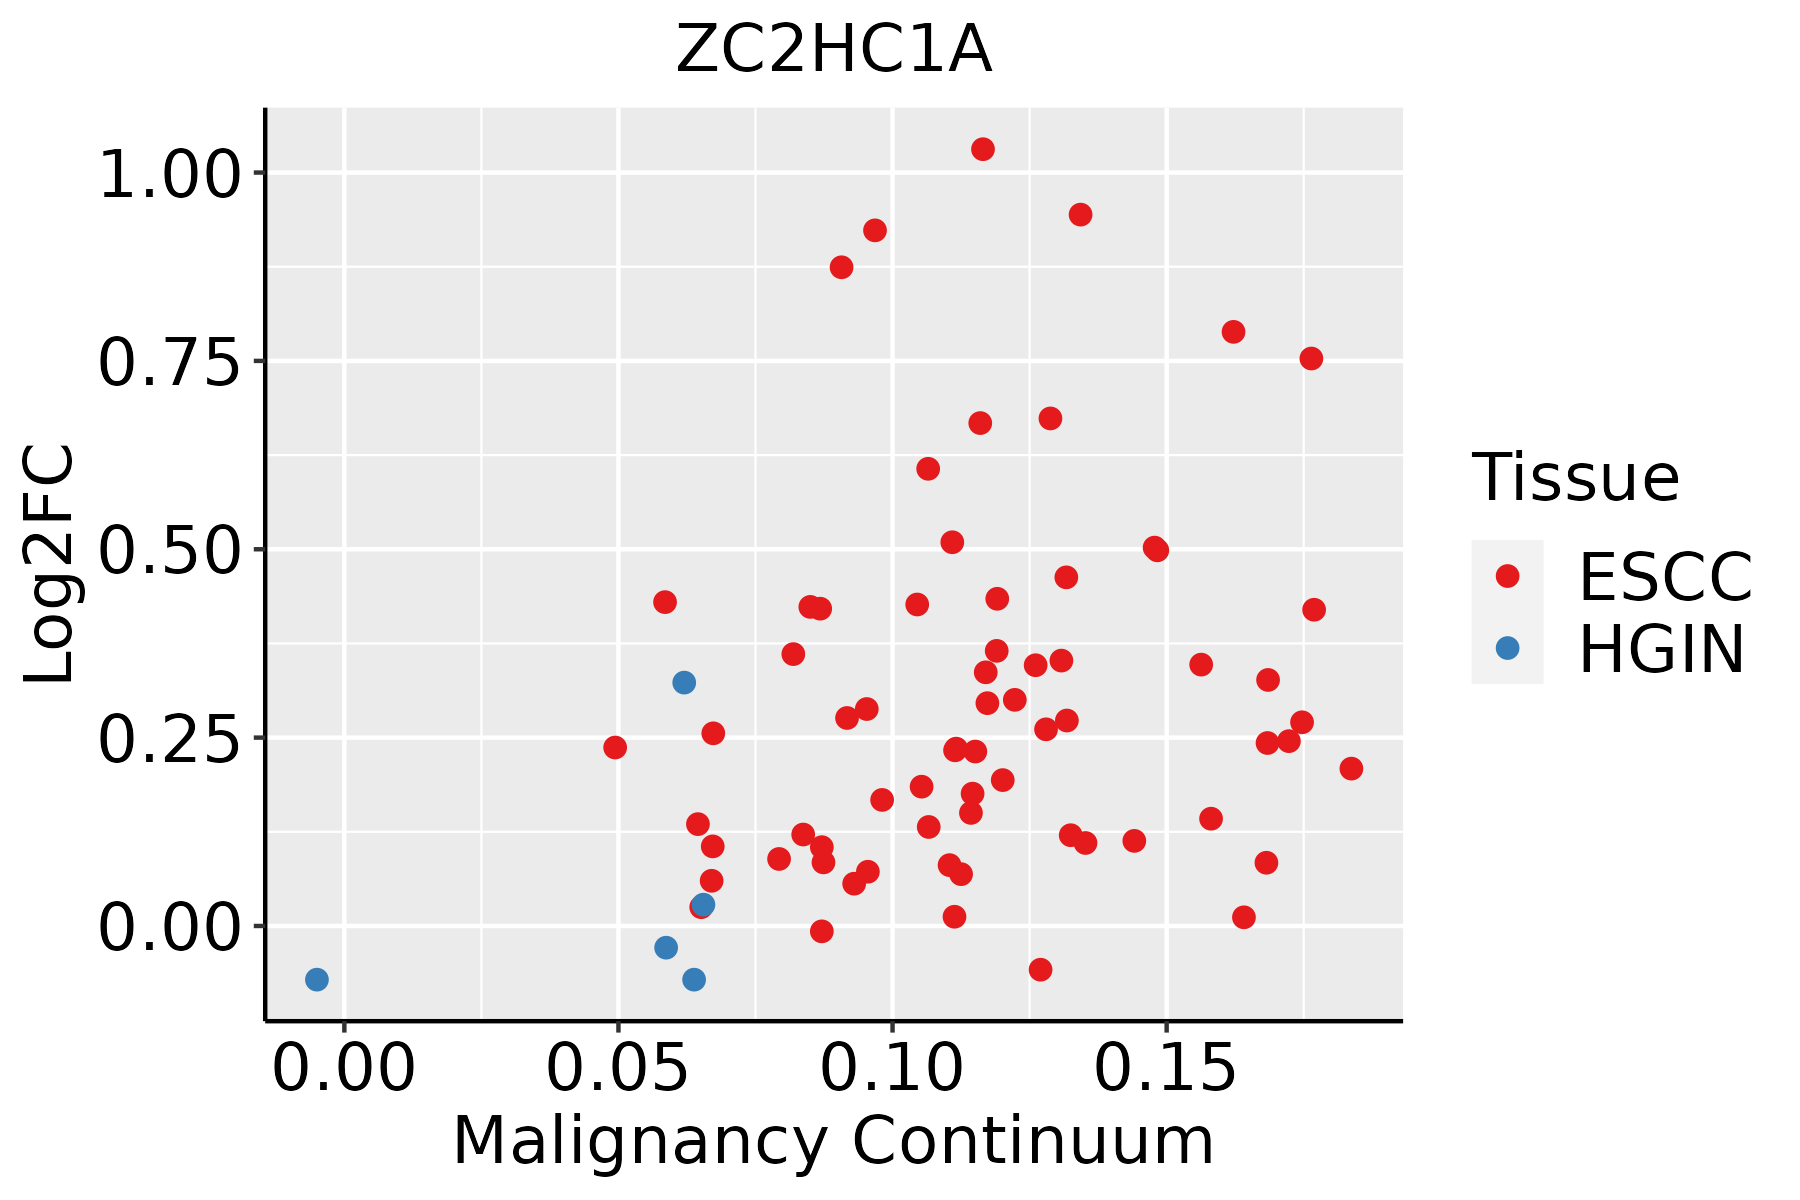 | ESCC: Esophageal squamous cell carcinoma |
| HGIN: High-grade intraepithelial neoplasias | ||
| LGIN: Low-grade intraepithelial neoplasias | ||
| Oral Cavity | 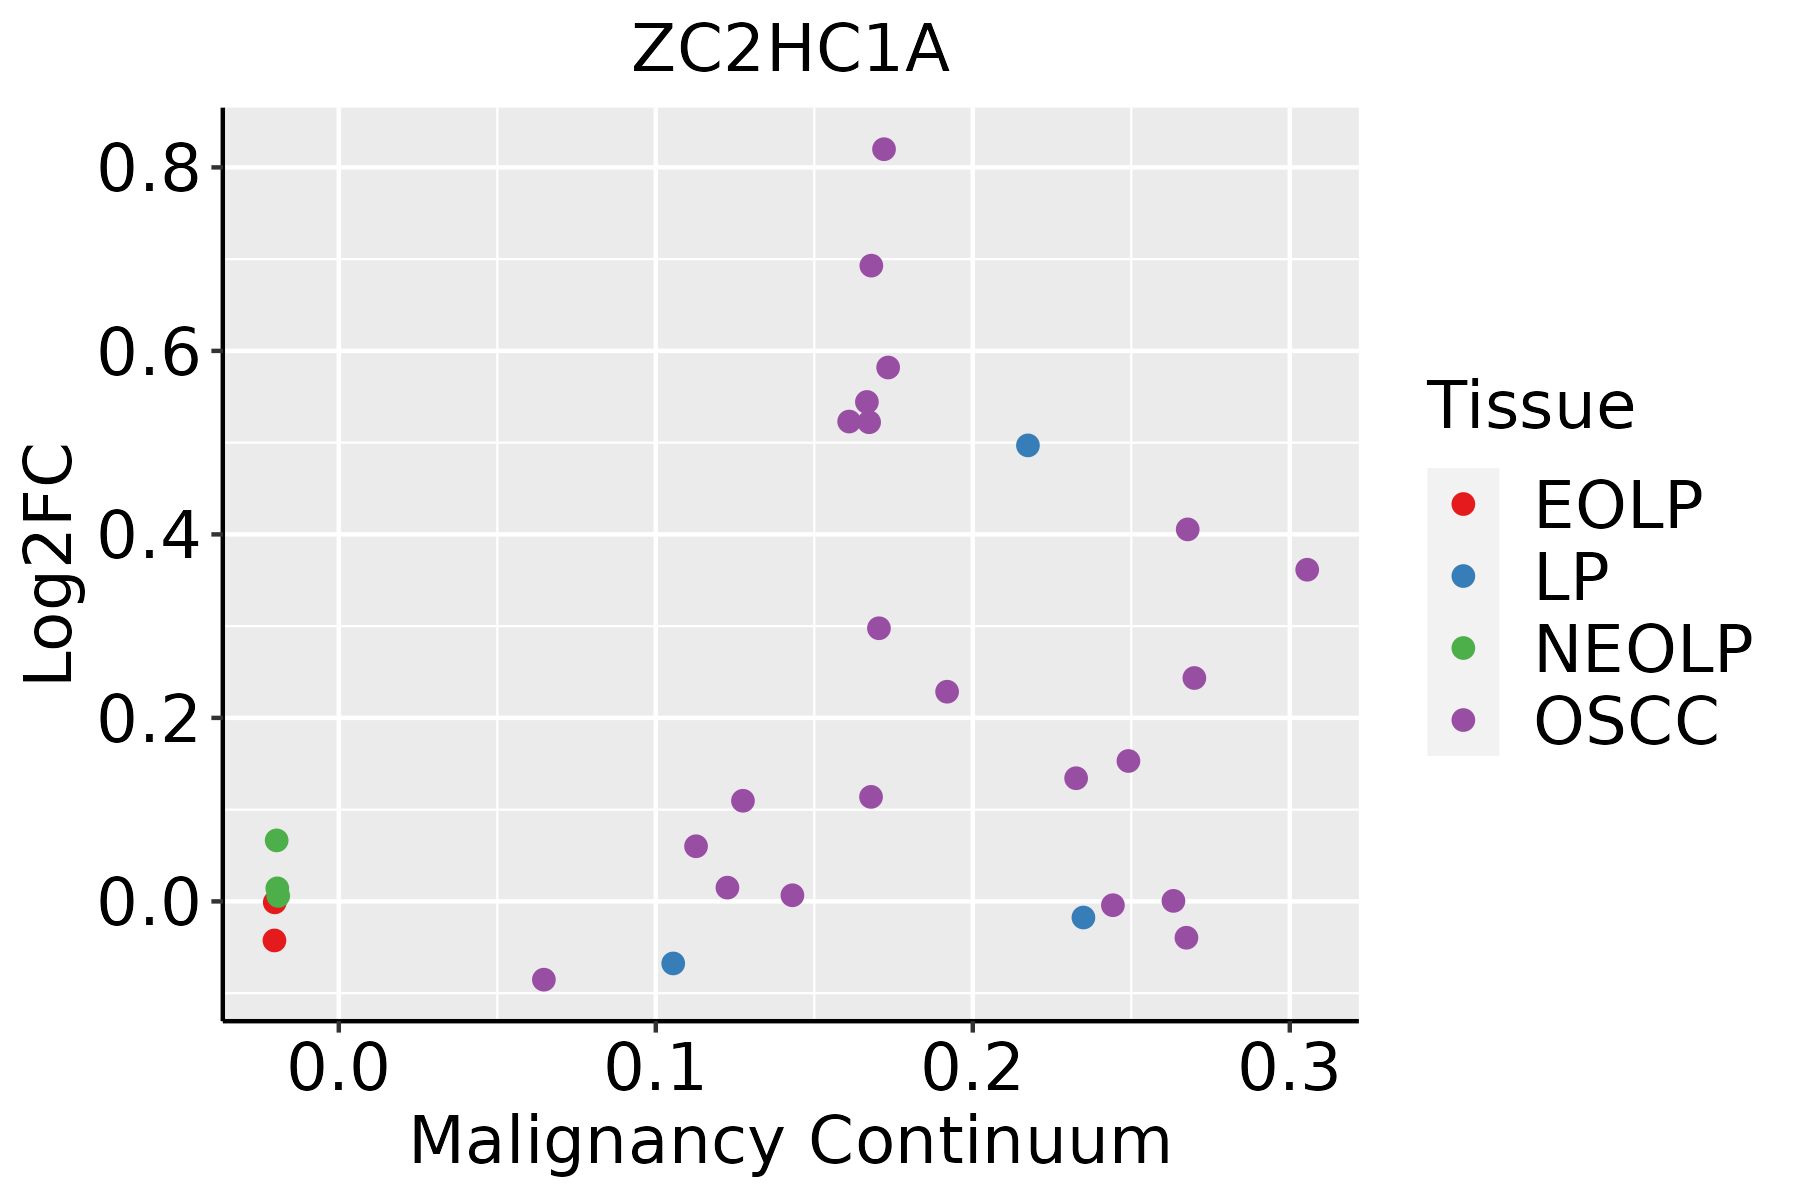 | EOLP: Erosive Oral lichen planus |
| LP: leukoplakia | ||
| NEOLP: Non-erosive oral lichen planus | ||
| OSCC: Oral squamous cell carcinoma | ||
| Thyroid | 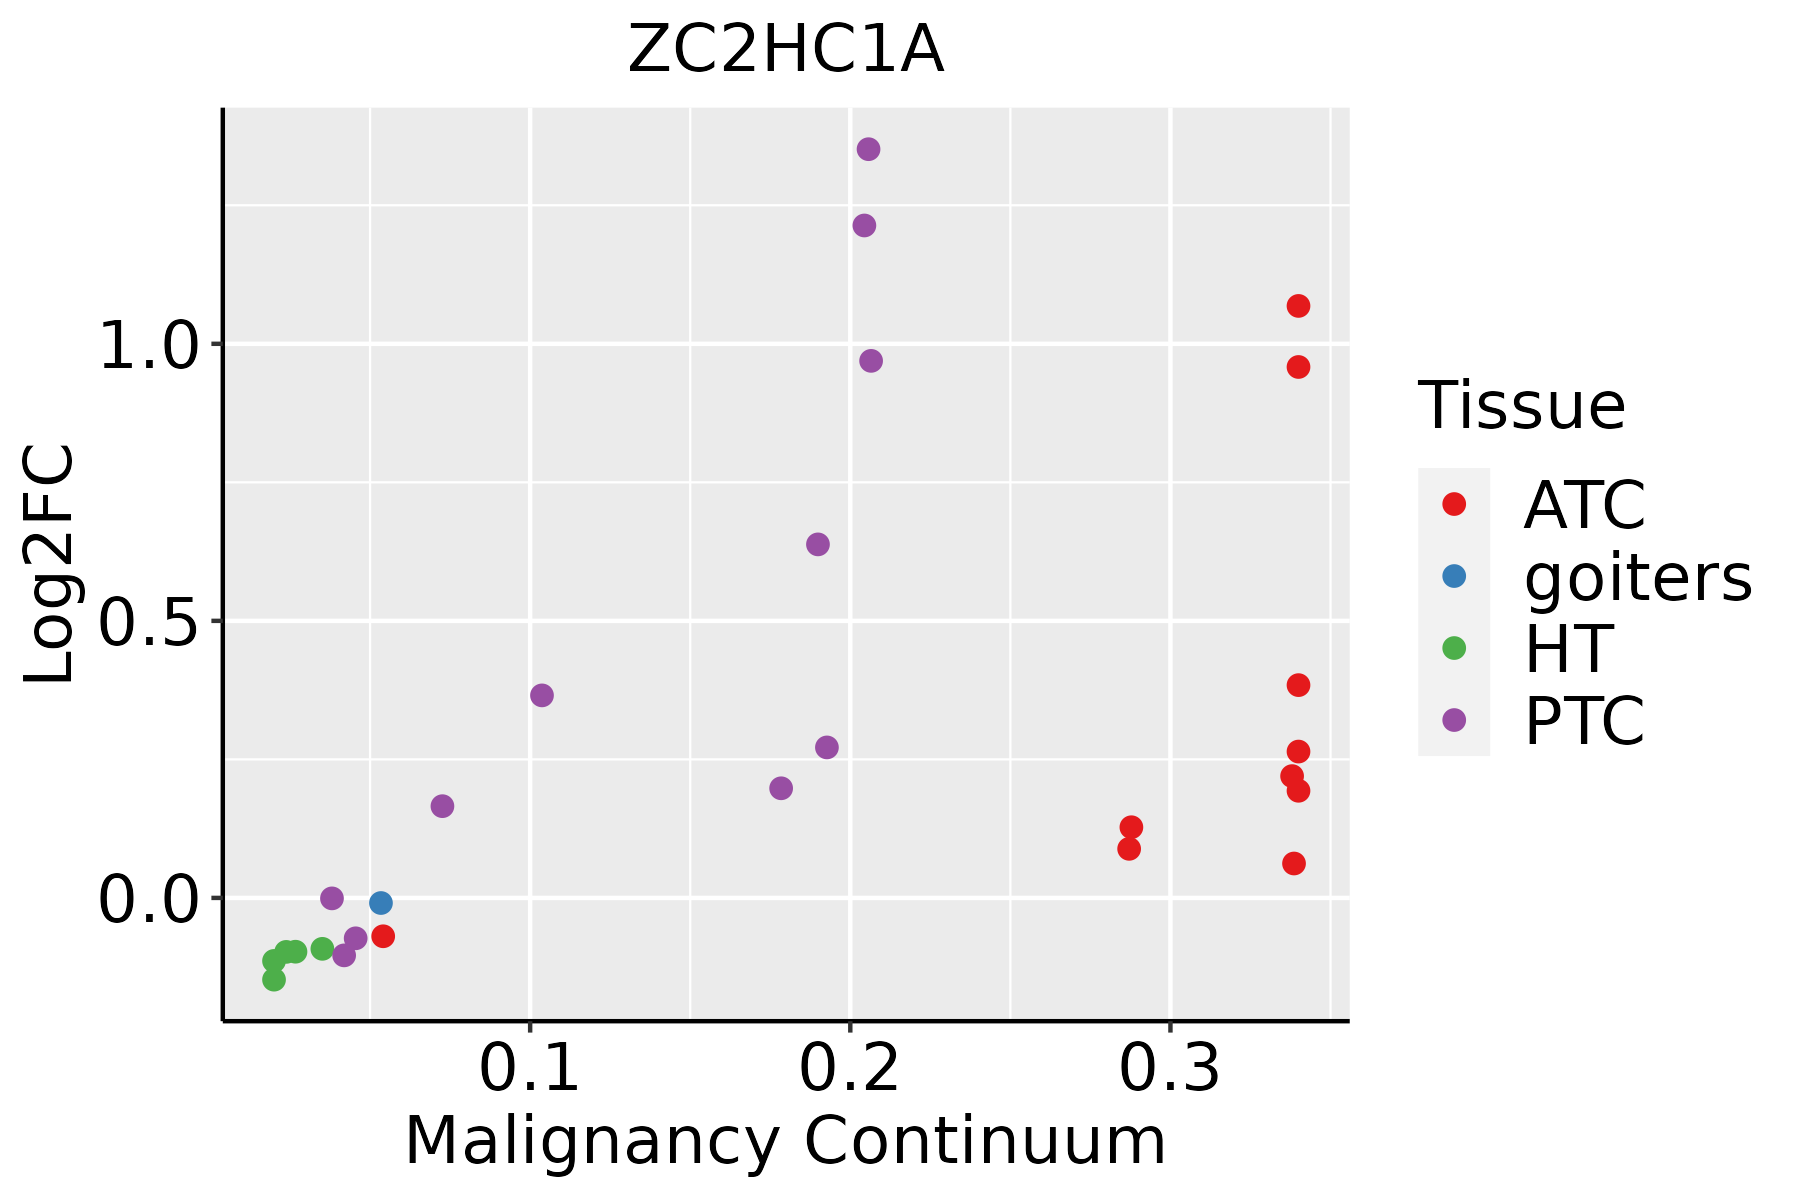 | ATC: Anaplastic thyroid cancer |
| HT: Hashimoto's thyroiditis | ||
| PTC: Papillary thyroid cancer |
| ∗log2FC in expression of this searched gene in stem-like cells from each diseased tissue sample relative to stem-like cells in normal samples in each tissue plotted against the malignancy continuum. Samples are colored based on if they are from different disease stage. |
Top |
Malignant transformation related pathway analysis |
| Find out the enriched GO biological processes and KEGG pathways involved in transition from healthy to precancer to cancer |
| Tissue | Disease Stage | Enriched GO biological Processes |
| Colorectum | AD |  |
| Colorectum | SER |  |
| Colorectum | MSS |  |
| Colorectum | MSI-H |  |
| Colorectum | FAP |  |
| ∗Top 15 enriched GO BP terms are showed in the bar plot of each disease state in each tissue. Each row represents a significant GO biological process which is colored according to the -log10(p.adjust). |
| Page: 1 2 3 4 5 6 7 8 9 |
| GO ID | Tissue | Disease Stage | Description | Gene Ratio | Bg Ratio | pvalue | p.adjust | Count |
| Page: 1 |
| Pathway ID | Tissue | Disease Stage | Description | Gene Ratio | Bg Ratio | pvalue | p.adjust | qvalue | Count |
| Page: 1 |
Top |
Cell-cell communication analysis |
| Identification of potential cell-cell interactions between two cell types and their ligand-receptor pairs for different disease states |
| Ligand | Receptor | LRpair | Pathway | Tissue | Disease Stage |
| Page: 1 |
Top |
Single-cell gene regulatory network inference analysis |
| Find out the significant the regulons (TFs) and the target genes of each regulon across cell types for different disease states |
| TF | Cell Type | Tissue | Disease Stage | Target Gene | RSS | Regulon Activity |
| ∗The dot plots of a searched regulon are shown for all cell subpopulations in each disease state of each tissue based on the regulon specific score inferred using pySCENIC and by calculating the average expression. |
| Page: 1 |
Top |
Somatic mutation of malignant transformation related genes |
| Annotation of somatic variants for genes involved in malignant transformation |
| Hugo Symbol | Variant Class | Variant Classification | dbSNP RS | HGVSc | HGVSp | HGVSp Short | SWISSPROT | BIOTYPE | SIFT | PolyPhen | Tumor Sample Barcode | Tissue | Histology | Sex | Age | Stage | Therapy Types | Drugs | Outcome |
| ZC2HC1A | SNV | Missense_Mutation | novel | c.317N>C | p.Lys106Thr | p.K106T | Q96GY0 | protein_coding | deleterious(0.01) | benign(0.276) | TCGA-AN-A046-01 | Breast | breast invasive carcinoma | Female | >=65 | I/II | Unknown | Unknown | SD |
| ZC2HC1A | SNV | Missense_Mutation | novel | c.520C>A | p.Leu174Ile | p.L174I | Q96GY0 | protein_coding | tolerated(0.49) | benign(0.01) | TCGA-B6-A40C-01 | Breast | breast invasive carcinoma | Female | <65 | I/II | Hormone Therapy | cyclophosphamide | SD |
| ZC2HC1A | SNV | Missense_Mutation | c.833N>G | p.Ser278Cys | p.S278C | Q96GY0 | protein_coding | tolerated(0.07) | possibly_damaging(0.817) | TCGA-E2-A1IN-01 | Breast | breast invasive carcinoma | Female | <65 | I/II | Hormone Therapy | arimidex | SD | |
| ZC2HC1A | SNV | Missense_Mutation | rs143922654 | c.136C>T | p.Arg46Trp | p.R46W | Q96GY0 | protein_coding | deleterious(0) | probably_damaging(1) | TCGA-E2-A576-01 | Breast | breast invasive carcinoma | Female | >=65 | I/II | Chemotherapy | taxotere | SD |
| ZC2HC1A | SNV | Missense_Mutation | c.256G>A | p.Glu86Lys | p.E86K | Q96GY0 | protein_coding | deleterious(0.01) | probably_damaging(0.917) | TCGA-C5-A1BN-01 | Cervix | cervical & endocervical cancer | Female | <65 | I/II | Chemotherapy | cisplatin | PD | |
| ZC2HC1A | deletion | Frame_Shift_Del | novel | c.130delN | p.Lys45AsnfsTer20 | p.K45Nfs*20 | Q96GY0 | protein_coding | TCGA-5M-AAT6-01 | Colorectum | colon adenocarcinoma | Female | <65 | III/IV | Unknown | Unknown | PD | ||
| ZC2HC1A | insertion | Frame_Shift_Ins | novel | c.662_663insA | p.Ser223IlefsTer5 | p.S223Ifs*5 | Q96GY0 | protein_coding | TCGA-AG-A00Y-01 | Colorectum | rectum adenocarcinoma | Male | >=65 | I/II | Unknown | Unknown | PD | ||
| ZC2HC1A | SNV | Missense_Mutation | novel | c.297N>T | p.Gln99His | p.Q99H | Q96GY0 | protein_coding | tolerated(0.11) | benign(0.03) | TCGA-A5-A0G1-01 | Endometrium | uterine corpus endometrioid carcinoma | Female | >=65 | I/II | Unknown | Unknown | SD |
| ZC2HC1A | SNV | Missense_Mutation | novel | c.60G>T | p.Lys20Asn | p.K20N | Q96GY0 | protein_coding | tolerated(0.69) | benign(0.057) | TCGA-A5-A1OF-01 | Endometrium | uterine corpus endometrioid carcinoma | Female | <65 | I/II | Unknown | Unknown | SD |
| ZC2HC1A | SNV | Missense_Mutation | novel | c.950N>G | p.Glu317Gly | p.E317G | Q96GY0 | protein_coding | deleterious(0) | probably_damaging(0.997) | TCGA-AJ-A3EK-01 | Endometrium | uterine corpus endometrioid carcinoma | Female | <65 | I/II | Chemotherapy | carboplatin | CR |
| Page: 1 2 3 4 |
Top |
Related drugs of malignant transformation related genes |
| Identification of chemicals and drugs interact with genes involved in malignant transfromation |
| (DGIdb 4.0) |
| Entrez ID | Symbol | Category | Interaction Types | Drug Claim Name | Drug Name | PMIDs |
| Page: 1 |

Copyright 2023-Present -The University of Texas Health Science Center at Houston |