| Tissue | Expression Dynamics | Abbreviation |
| Cervix | 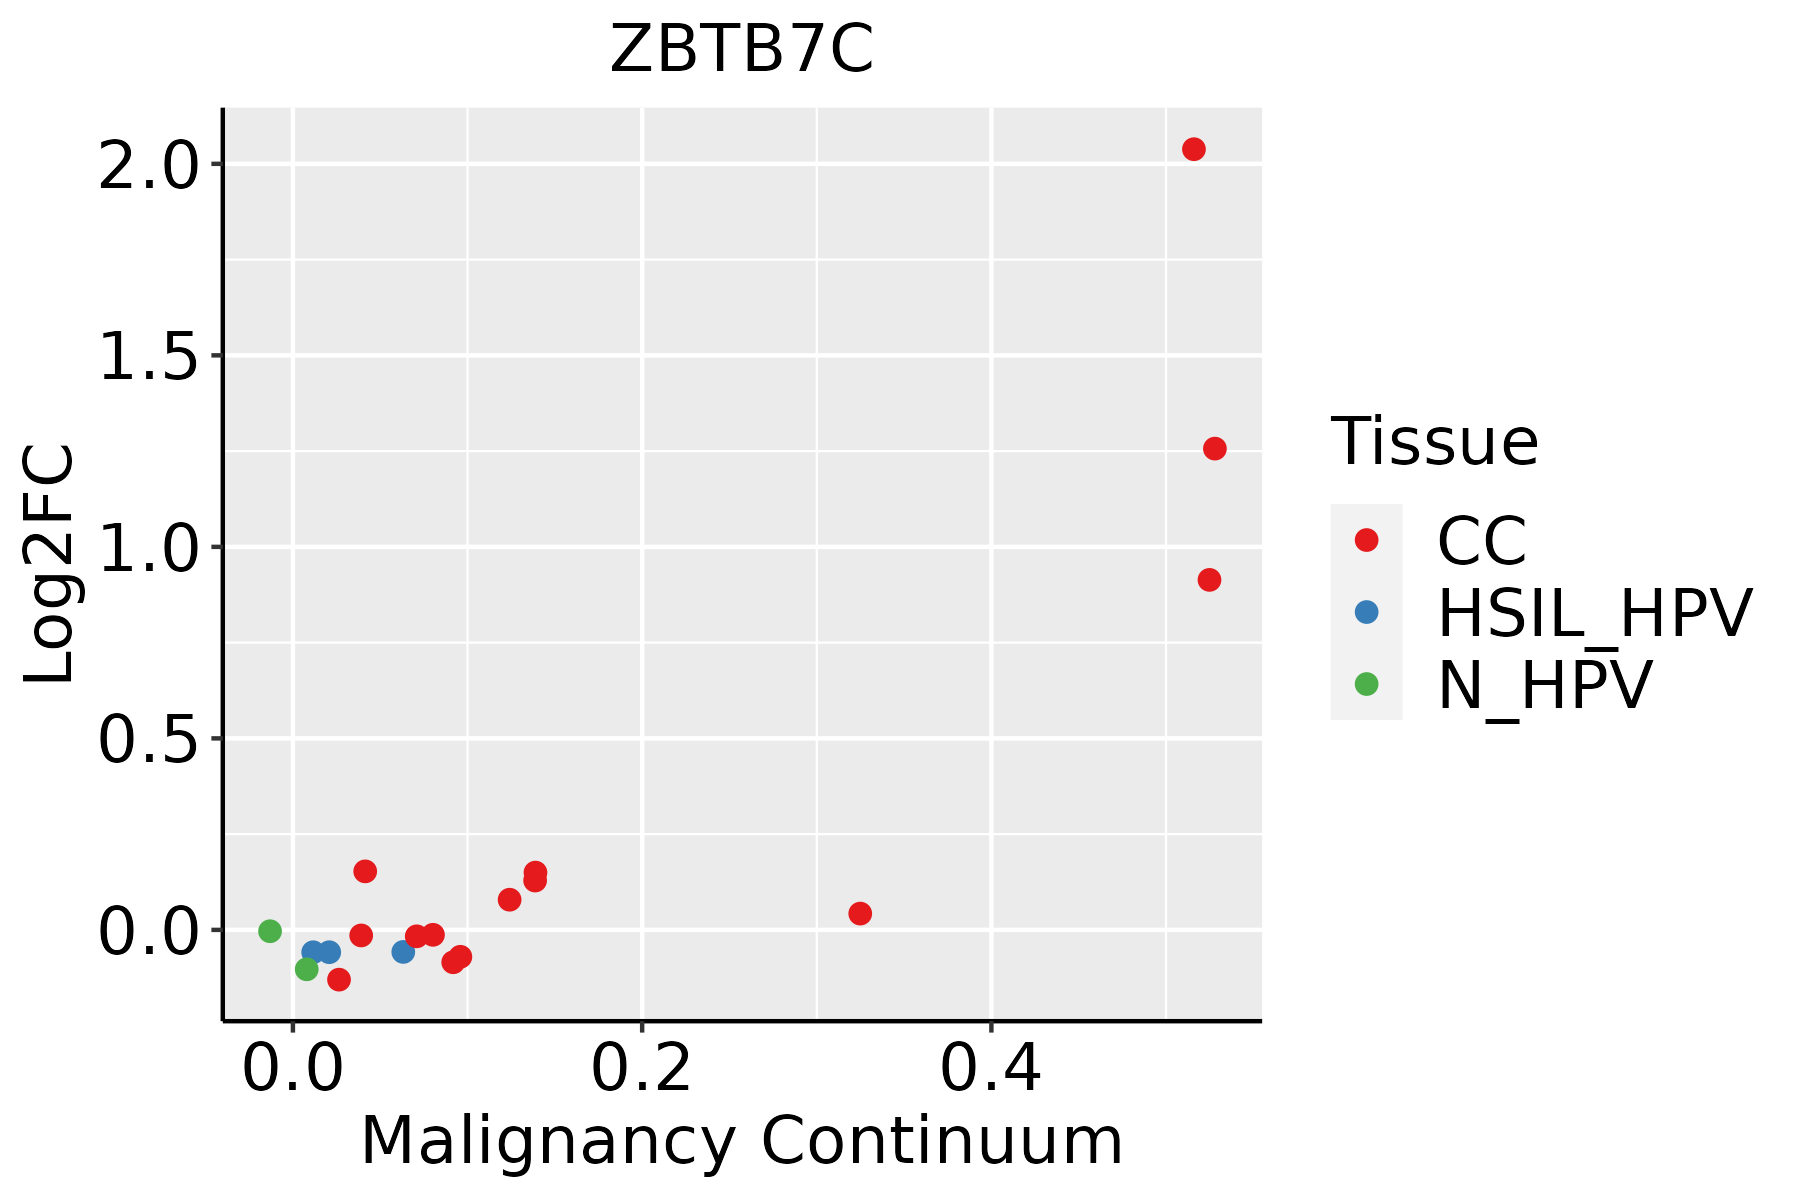 | CC: Cervix cancer |
| HSIL_HPV: HPV-infected high-grade squamous intraepithelial lesions |
| N_HPV: HPV-infected normal cervix |
| Colorectum (GSE201348) |  | FAP: Familial adenomatous polyposis |
| CRC: Colorectal cancer |
| Colorectum (HTA11) |  | AD: Adenomas |
| SER: Sessile serrated lesions |
| MSI-H: Microsatellite-high colorectal cancer |
| MSS: Microsatellite stable colorectal cancer |
| Esophagus | 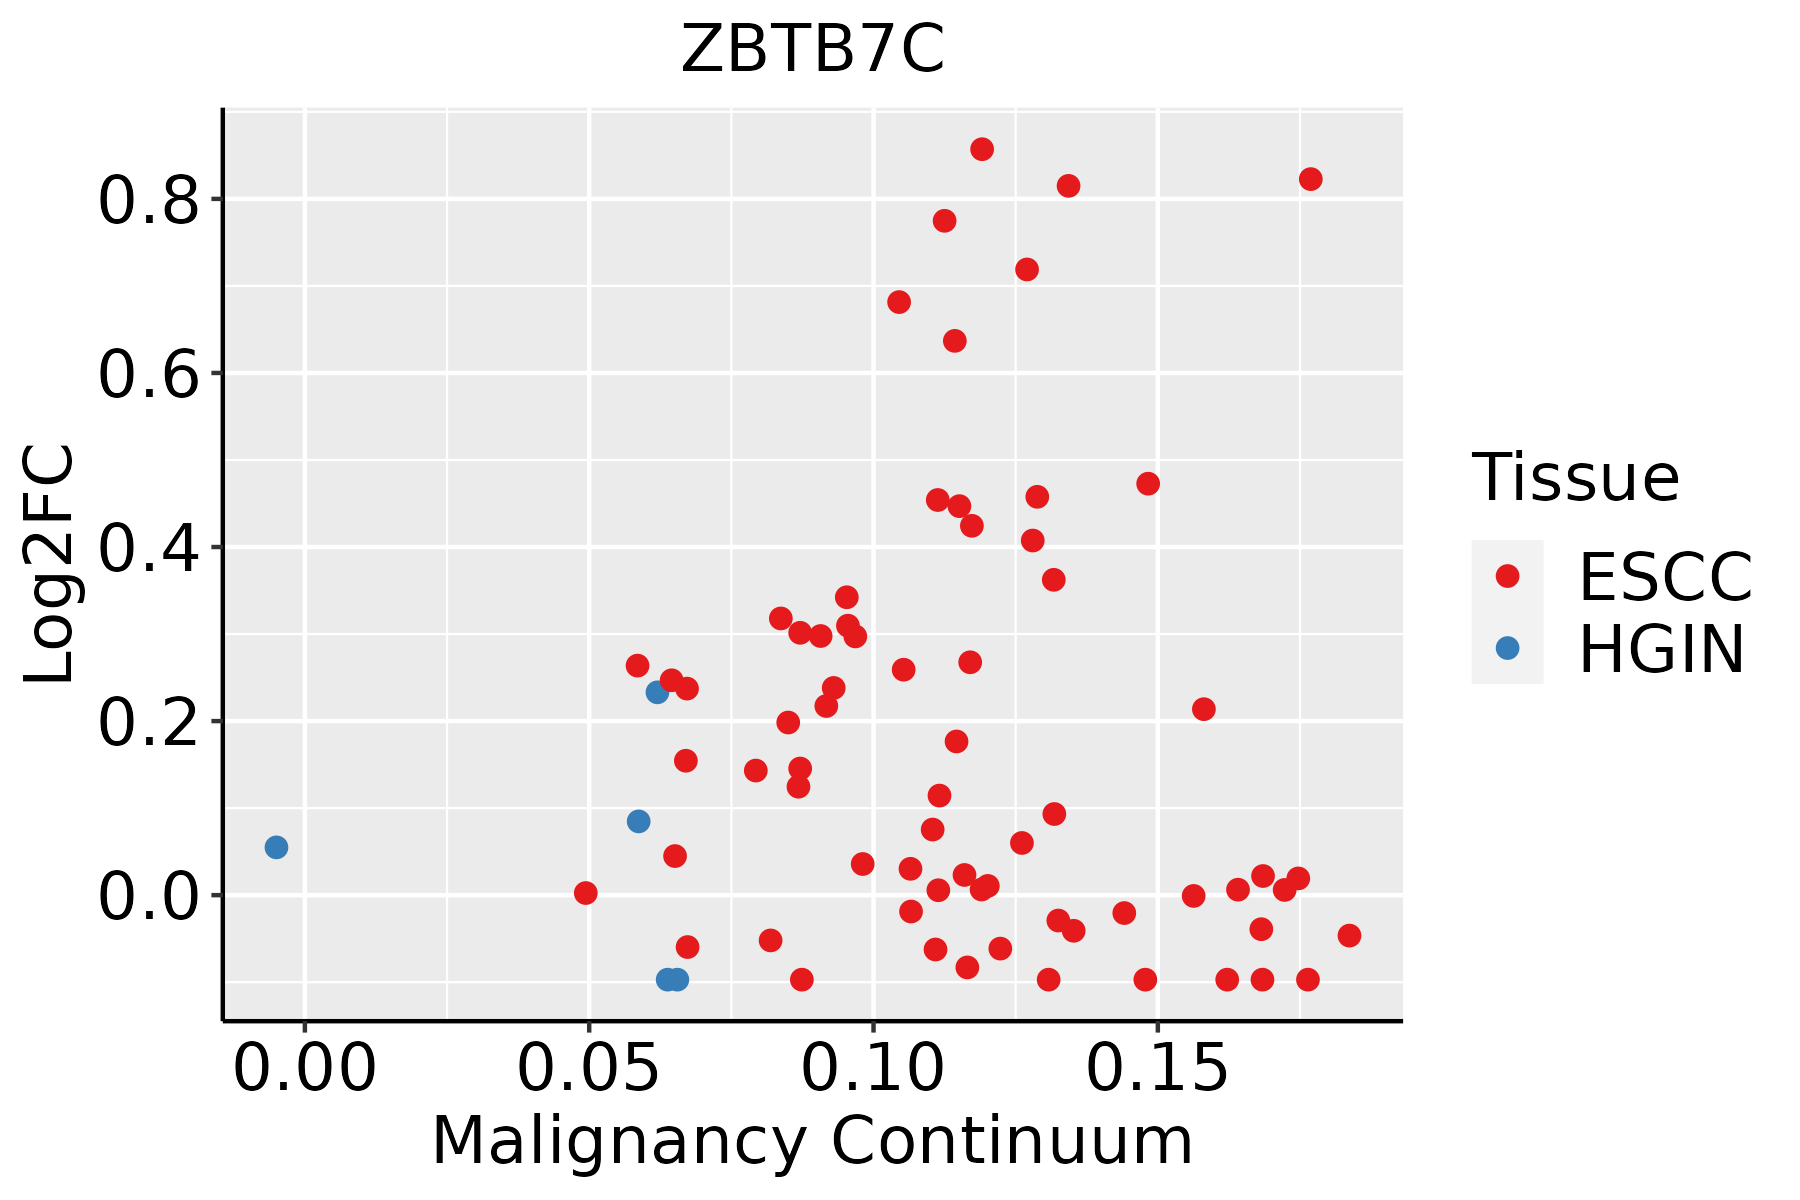 | ESCC: Esophageal squamous cell carcinoma |
| HGIN: High-grade intraepithelial neoplasias |
| LGIN: Low-grade intraepithelial neoplasias |
| GC |  | CAG: Chronic atrophic gastritis |
| CAG with IM: Chronic atrophic gastritis with intestinal metaplasia |
| CSG: Chronic superficial gastritis |
| GC: Gastric cancer |
| SIM: Severe intestinal metaplasia |
| WIM: Wild intestinal metaplasia |
| Lung | 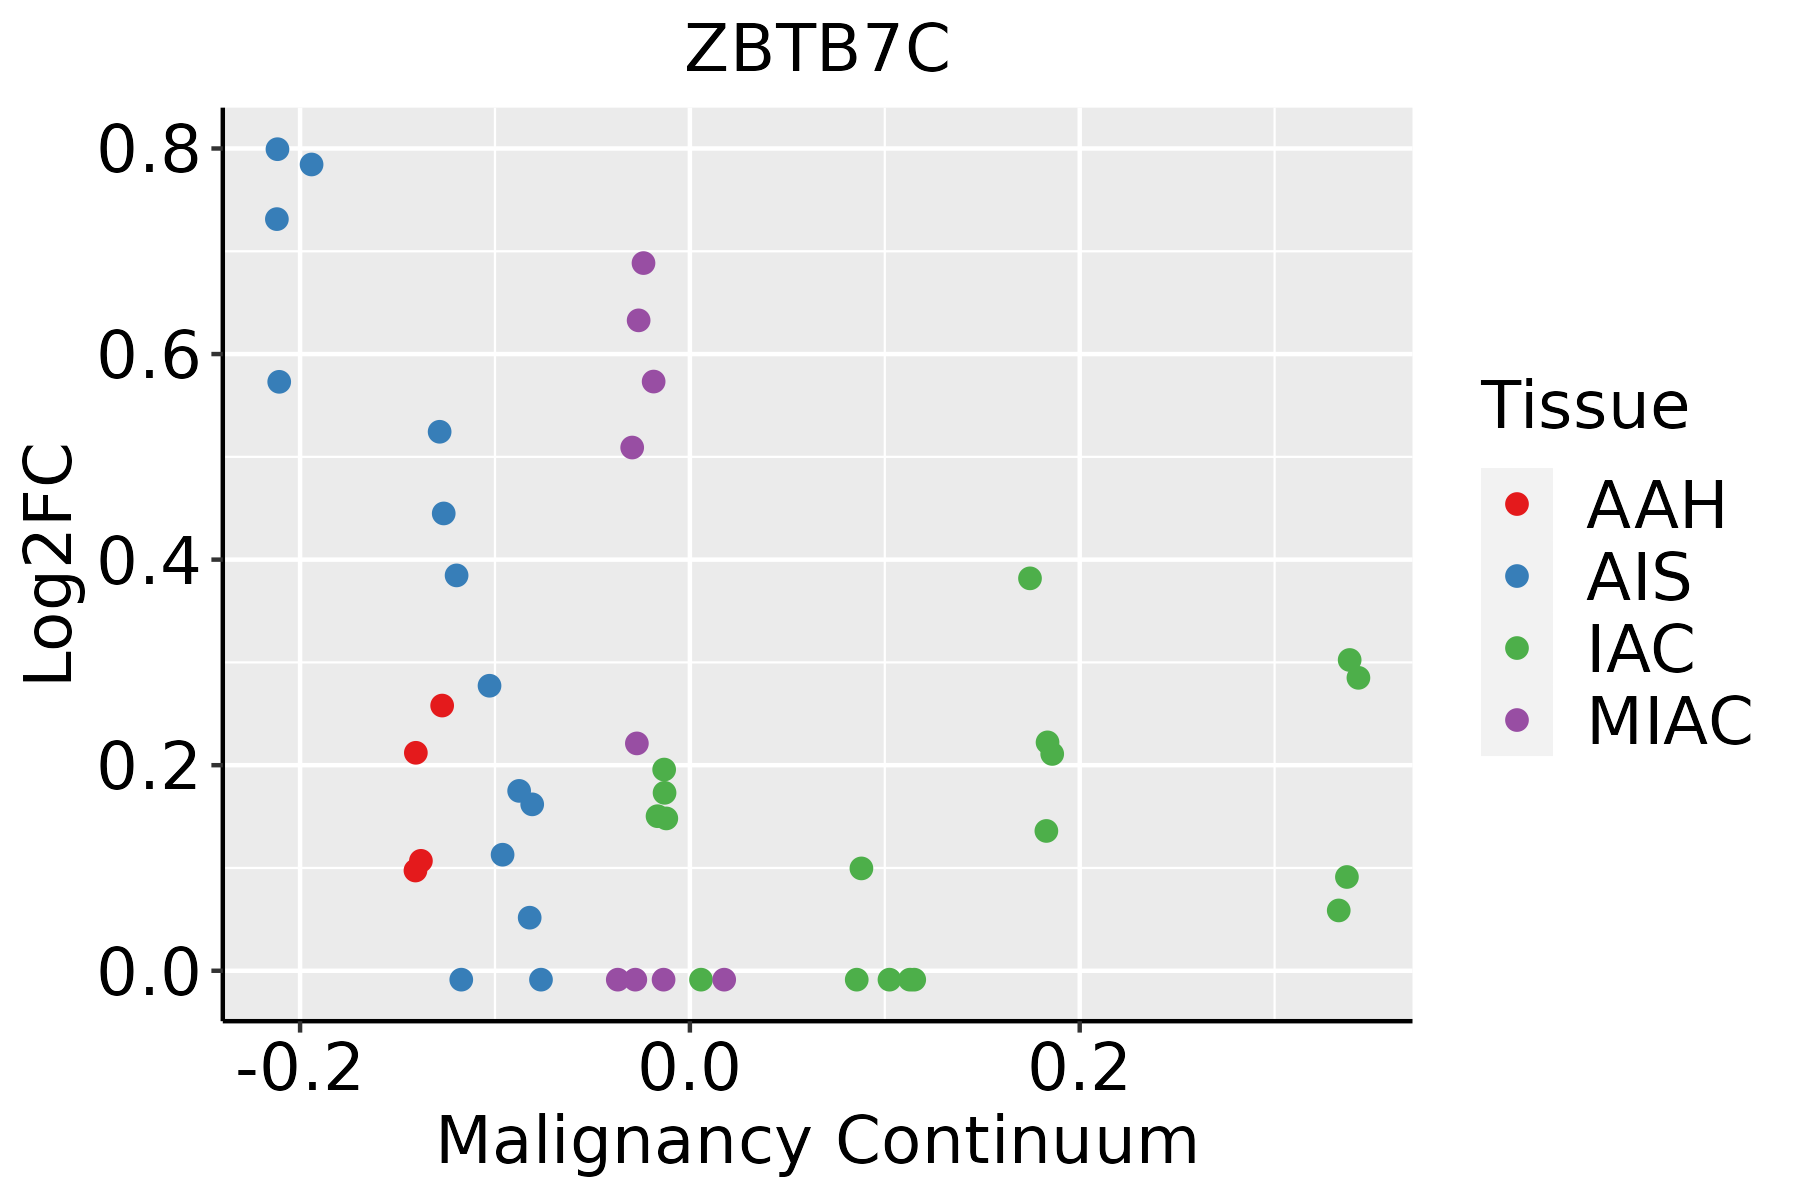 | AAH: Atypical adenomatous hyperplasia |
| AIS: Adenocarcinoma in situ |
| IAC: Invasive lung adenocarcinoma |
| MIA: Minimally invasive adenocarcinoma |
| Thyroid |  | ATC: Anaplastic thyroid cancer |
| HT: Hashimoto's thyroiditis |
| PTC: Papillary thyroid cancer |
| GO ID | Tissue | Disease Stage | Description | Gene Ratio | Bg Ratio | pvalue | p.adjust | Count |
| GO:005109810 | Cervix | CC | regulation of binding | 80/2311 | 363/18723 | 1.32e-07 | 6.42e-06 | 80 |
| GO:00454445 | Cervix | CC | fat cell differentiation | 53/2311 | 229/18723 | 3.72e-06 | 9.75e-05 | 53 |
| GO:005110110 | Cervix | CC | regulation of DNA binding | 31/2311 | 118/18723 | 2.91e-05 | 4.81e-04 | 31 |
| GO:0045598 | Cervix | CC | regulation of fat cell differentiation | 31/2311 | 139/18723 | 7.06e-04 | 6.41e-03 | 31 |
| GO:00456004 | Cervix | CC | positive regulation of fat cell differentiation | 18/2311 | 66/18723 | 8.09e-04 | 7.07e-03 | 18 |
| GO:0051098 | Colorectum | AD | regulation of binding | 126/3918 | 363/18723 | 6.01e-10 | 4.88e-08 | 126 |
| GO:0051101 | Colorectum | AD | regulation of DNA binding | 42/3918 | 118/18723 | 1.62e-04 | 2.23e-03 | 42 |
| GO:00510981 | Colorectum | SER | regulation of binding | 97/2897 | 363/18723 | 1.98e-08 | 1.43e-06 | 97 |
| GO:00511011 | Colorectum | SER | regulation of DNA binding | 33/2897 | 118/18723 | 3.70e-04 | 5.71e-03 | 33 |
| GO:0045444 | Colorectum | SER | fat cell differentiation | 51/2897 | 229/18723 | 3.96e-03 | 3.26e-02 | 51 |
| GO:0045600 | Colorectum | SER | positive regulation of fat cell differentiation | 19/2897 | 66/18723 | 4.29e-03 | 3.45e-02 | 19 |
| GO:00510982 | Colorectum | MSS | regulation of binding | 113/3467 | 363/18723 | 3.55e-09 | 2.41e-07 | 113 |
| GO:00511012 | Colorectum | MSS | regulation of DNA binding | 37/3467 | 118/18723 | 5.29e-04 | 5.99e-03 | 37 |
| GO:00510984 | Colorectum | FAP | regulation of binding | 81/2622 | 363/18723 | 1.04e-05 | 2.97e-04 | 81 |
| GO:00510985 | Colorectum | CRC | regulation of binding | 72/2078 | 363/18723 | 6.43e-07 | 4.50e-05 | 72 |
| GO:005109825 | Esophagus | HGIN | regulation of binding | 78/2587 | 363/18723 | 3.73e-05 | 9.30e-04 | 78 |
| GO:005110125 | Esophagus | HGIN | regulation of DNA binding | 28/2587 | 118/18723 | 2.54e-03 | 2.51e-02 | 28 |
| GO:0051098111 | Esophagus | ESCC | regulation of binding | 251/8552 | 363/18723 | 6.73e-20 | 8.46e-18 | 251 |
| GO:0051101111 | Esophagus | ESCC | regulation of DNA binding | 84/8552 | 118/18723 | 1.64e-08 | 3.21e-07 | 84 |
| GO:00454449 | Esophagus | ESCC | fat cell differentiation | 135/8552 | 229/18723 | 3.38e-05 | 2.78e-04 | 135 |
| Hugo Symbol | Variant Class | Variant Classification | dbSNP RS | HGVSc | HGVSp | HGVSp Short | SWISSPROT | BIOTYPE | SIFT | PolyPhen | Tumor Sample Barcode | Tissue | Histology | Sex | Age | Stage | Therapy Types | Drugs | Outcome |
| ZBTB7C | SNV | Missense_Mutation | novel | c.548N>C | p.Ile183Thr | p.I183T | A1YPR0 | protein_coding | tolerated(0.74) | benign(0.007) | TCGA-BH-A1FN-01 | Breast | breast invasive carcinoma | Female | <65 | I/II | Unknown | Unknown | PD |
| ZBTB7C | SNV | Missense_Mutation | | c.1091A>C | p.Gln364Pro | p.Q364P | A1YPR0 | protein_coding | deleterious(0) | probably_damaging(0.991) | TCGA-E9-A1N5-01 | Breast | breast invasive carcinoma | Female | <65 | I/II | Chemotherapy | doxorubicin | SD |
| ZBTB7C | SNV | Missense_Mutation | | c.83N>A | p.Arg28Gln | p.R28Q | A1YPR0 | protein_coding | deleterious(0) | probably_damaging(0.998) | TCGA-GM-A3XN-01 | Breast | breast invasive carcinoma | Female | <65 | III/IV | Chemotherapy | paclitaxel | CR |
| ZBTB7C | insertion | Frame_Shift_Ins | novel | c.61_62insCATACCGGGGAGAAGCCATACA | p.Leu21ProfsTer13 | p.L21Pfs*13 | A1YPR0 | protein_coding | | | TCGA-A2-A0CM-01 | Breast | breast invasive carcinoma | Female | <65 | I/II | Chemotherapy | adriamycin | PD |
| ZBTB7C | insertion | Nonsense_Mutation | novel | c.578_579insTTTATGAGTTACATGGAGGCTAGTTAAGAGTGTGGTATAGAAC | p.His194LeufsTer2 | p.H194Lfs*2 | A1YPR0 | protein_coding | | | TCGA-A8-A097-01 | Breast | breast invasive carcinoma | Female | >=65 | I/II | Hormone Therapy | tamoxiphen | SD |
| ZBTB7C | insertion | In_Frame_Ins | novel | c.301_302insAAGGAAGTGAGGCGCCTCAAGCACCTTGGTTGCTTGGCTTCCTCTTCT | p.Ala101delinsGluGlySerGluAlaProGlnAlaProTrpLeuLeuGlyPheLeuPheSer | p.A101delinsEGSEAPQAPWLLGFLFS | A1YPR0 | protein_coding | | | TCGA-B6-A0I6-01 | Breast | breast invasive carcinoma | Female | <65 | I/II | Unknown | Unknown | PD |
| ZBTB7C | SNV | Missense_Mutation | novel | c.1709N>T | p.Ala570Val | p.A570V | A1YPR0 | protein_coding | tolerated_low_confidence(0.08) | benign(0.236) | TCGA-2W-A8YY-01 | Cervix | cervical & endocervical cancer | Female | <65 | I/II | Chemotherapy | cisplatin | CR |
| ZBTB7C | SNV | Missense_Mutation | | c.463N>A | p.Glu155Lys | p.E155K | A1YPR0 | protein_coding | tolerated(0.14) | benign(0.075) | TCGA-EK-A3GK-01 | Cervix | cervical & endocervical cancer | Female | <65 | I/II | Unknown | Unknown | SD |
| ZBTB7C | SNV | Missense_Mutation | novel | c.1165G>A | p.Glu389Lys | p.E389K | A1YPR0 | protein_coding | deleterious(0) | probably_damaging(0.998) | TCGA-ZJ-AAXB-01 | Cervix | cervical & endocervical cancer | Female | <65 | I/II | Unknown | Unknown | SD |
| ZBTB7C | SNV | Missense_Mutation | rs774830243 | c.1199N>A | p.Arg400His | p.R400H | A1YPR0 | protein_coding | deleterious(0.01) | benign(0.052) | TCGA-5M-AAT6-01 | Colorectum | colon adenocarcinoma | Female | <65 | III/IV | Unknown | Unknown | PD |


