
|
|||||
|
 | |
| |
| |
| |
| |
| |
|
Gene: ZBTB48 |
Gene summary for ZBTB48 |
| Gene information | Species | Human | Gene symbol | ZBTB48 | Gene ID | 3104 |
| Gene name | zinc finger and BTB domain containing 48 | |
| Gene Alias | HKR3 | |
| Cytomap | 1p36.31 | |
| Gene Type | protein-coding | GO ID | GO:0000723 | UniProtAcc | A8K291 |
Top |
Malignant transformation analysis |
| Identification of the aberrant gene expression in precancerous and cancerous lesions by comparing the gene expression of stem-like cells in diseased tissues with normal stem cells |
| Entrez ID | Symbol | Replicates | Species | Organ | Tissue | Adj P-value | Log2FC | Malignancy |
| 3104 | ZBTB48 | LZE4T | Human | Esophagus | ESCC | 1.31e-02 | 1.36e-01 | 0.0811 |
| 3104 | ZBTB48 | LZE7T | Human | Esophagus | ESCC | 5.05e-06 | 3.34e-01 | 0.0667 |
| 3104 | ZBTB48 | LZE8T | Human | Esophagus | ESCC | 7.33e-07 | 2.17e-01 | 0.067 |
| 3104 | ZBTB48 | LZE20T | Human | Esophagus | ESCC | 2.51e-07 | 2.75e-01 | 0.0662 |
| 3104 | ZBTB48 | LZE24T | Human | Esophagus | ESCC | 4.51e-10 | 2.69e-01 | 0.0596 |
| 3104 | ZBTB48 | LZE21T | Human | Esophagus | ESCC | 6.87e-03 | 2.37e-01 | 0.0655 |
| 3104 | ZBTB48 | P1T-E | Human | Esophagus | ESCC | 2.88e-04 | 2.61e-01 | 0.0875 |
| 3104 | ZBTB48 | P2T-E | Human | Esophagus | ESCC | 1.74e-12 | 2.36e-01 | 0.1177 |
| 3104 | ZBTB48 | P4T-E | Human | Esophagus | ESCC | 3.11e-05 | 1.93e-01 | 0.1323 |
| 3104 | ZBTB48 | P5T-E | Human | Esophagus | ESCC | 2.68e-04 | 1.62e-01 | 0.1327 |
| 3104 | ZBTB48 | P8T-E | Human | Esophagus | ESCC | 1.08e-11 | 2.22e-01 | 0.0889 |
| 3104 | ZBTB48 | P9T-E | Human | Esophagus | ESCC | 5.81e-15 | 2.05e-01 | 0.1131 |
| 3104 | ZBTB48 | P10T-E | Human | Esophagus | ESCC | 4.83e-16 | 3.00e-01 | 0.116 |
| 3104 | ZBTB48 | P11T-E | Human | Esophagus | ESCC | 9.27e-05 | 2.78e-01 | 0.1426 |
| 3104 | ZBTB48 | P12T-E | Human | Esophagus | ESCC | 1.19e-08 | 1.88e-01 | 0.1122 |
| 3104 | ZBTB48 | P15T-E | Human | Esophagus | ESCC | 5.65e-14 | 3.20e-01 | 0.1149 |
| 3104 | ZBTB48 | P16T-E | Human | Esophagus | ESCC | 2.32e-09 | 1.75e-01 | 0.1153 |
| 3104 | ZBTB48 | P20T-E | Human | Esophagus | ESCC | 6.24e-13 | 2.97e-01 | 0.1124 |
| 3104 | ZBTB48 | P21T-E | Human | Esophagus | ESCC | 1.23e-12 | 2.53e-01 | 0.1617 |
| 3104 | ZBTB48 | P22T-E | Human | Esophagus | ESCC | 1.30e-07 | 1.65e-01 | 0.1236 |
| Page: 1 2 3 |
| Tissue | Expression Dynamics | Abbreviation |
| Esophagus | 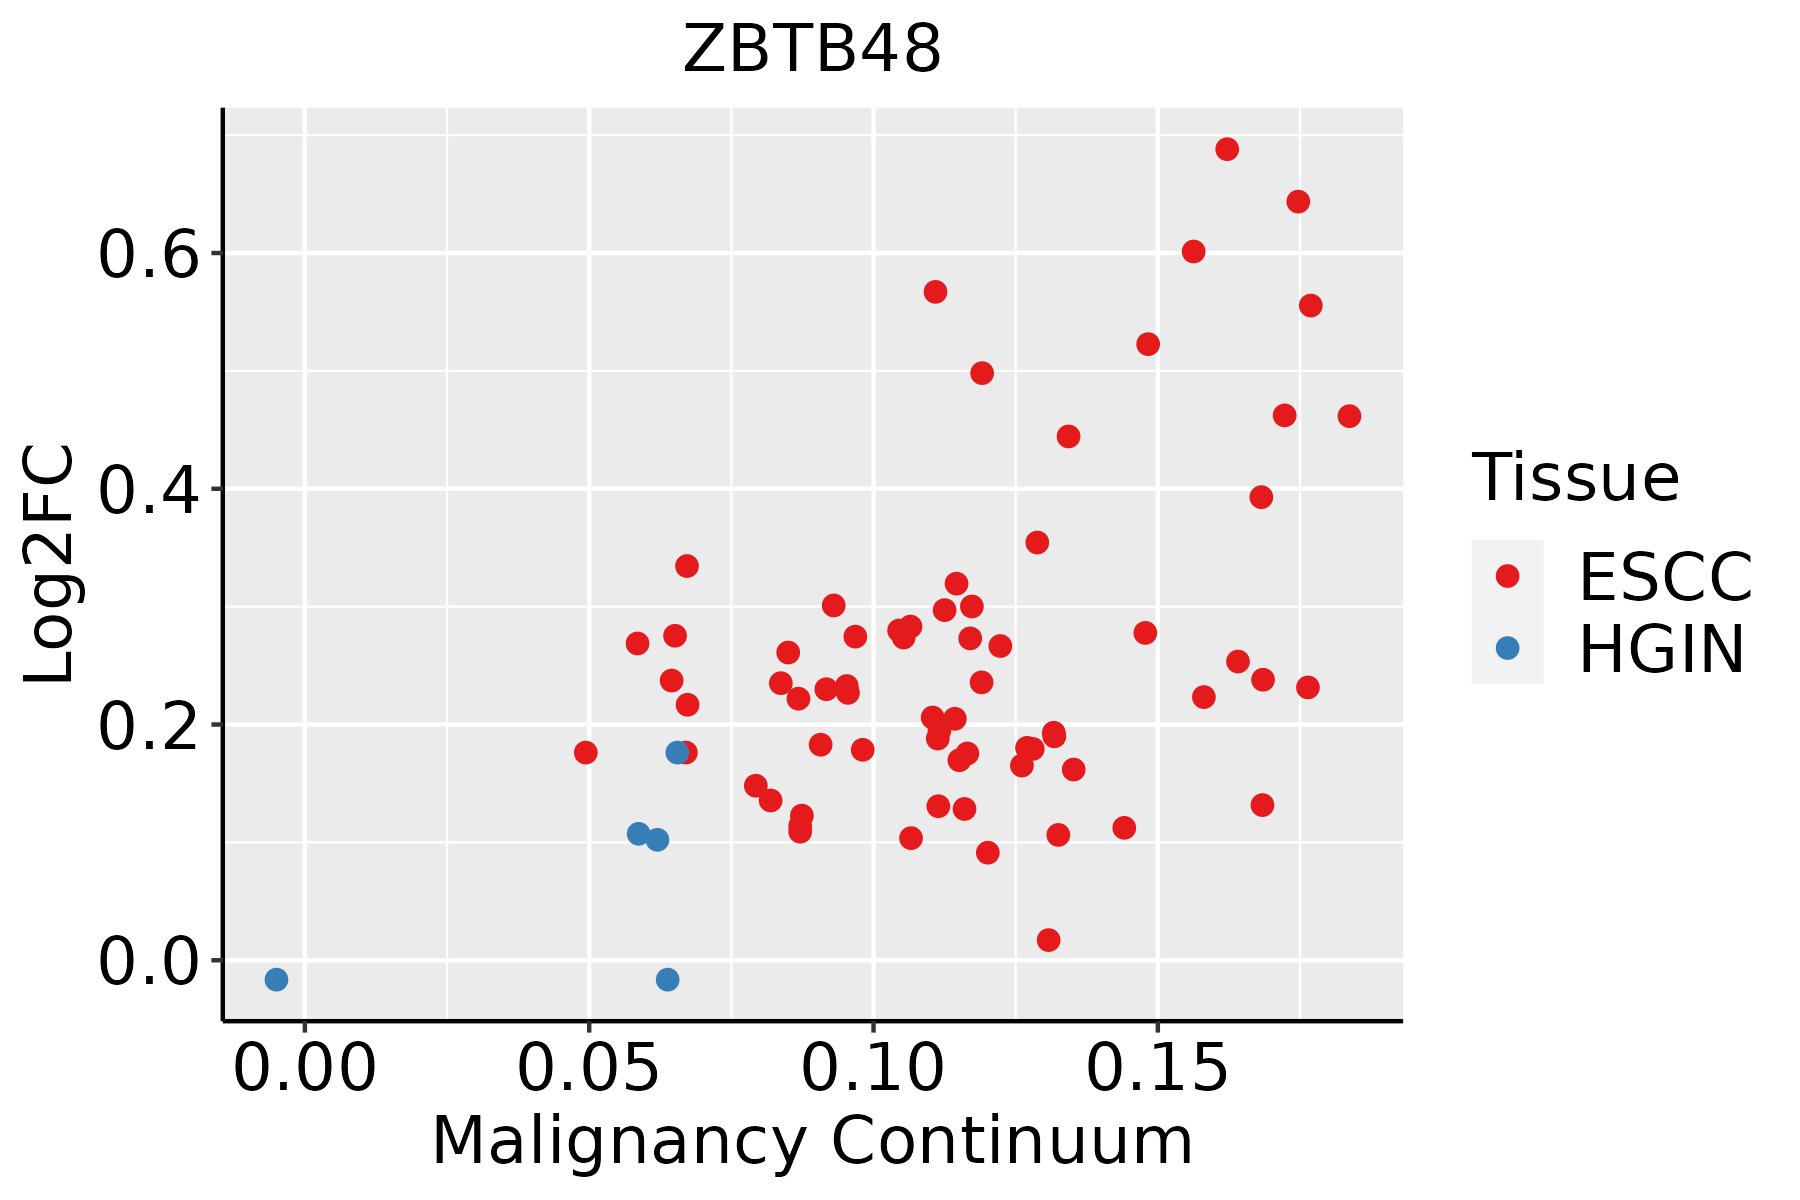 | ESCC: Esophageal squamous cell carcinoma |
| HGIN: High-grade intraepithelial neoplasias | ||
| LGIN: Low-grade intraepithelial neoplasias |
| ∗log2FC in expression of this searched gene in stem-like cells from each diseased tissue sample relative to stem-like cells in normal samples in each tissue plotted against the malignancy continuum. Samples are colored based on if they are from different disease stage. |
Top |
Malignant transformation related pathway analysis |
| Find out the enriched GO biological processes and KEGG pathways involved in transition from healthy to precancer to cancer |
| Tissue | Disease Stage | Enriched GO biological Processes |
| Colorectum | AD |  |
| Colorectum | SER |  |
| Colorectum | MSS |  |
| Colorectum | MSI-H |  |
| Colorectum | FAP |  |
| ∗Top 15 enriched GO BP terms are showed in the bar plot of each disease state in each tissue. Each row represents a significant GO biological process which is colored according to the -log10(p.adjust). |
| Page: 1 2 3 4 5 6 7 8 9 |
| GO ID | Tissue | Disease Stage | Description | Gene Ratio | Bg Ratio | pvalue | p.adjust | Count |
| GO:000072319 | Esophagus | ESCC | telomere maintenance | 99/8552 | 131/18723 | 2.68e-12 | 1.08e-10 | 99 |
| GO:001083319 | Esophagus | ESCC | telomere maintenance via telomere lengthening | 61/8552 | 81/18723 | 5.24e-08 | 9.37e-07 | 61 |
| GO:003220014 | Esophagus | ESCC | telomere organization | 99/8552 | 159/18723 | 1.77e-05 | 1.57e-04 | 99 |
| Page: 1 |
| Pathway ID | Tissue | Disease Stage | Description | Gene Ratio | Bg Ratio | pvalue | p.adjust | qvalue | Count |
| Page: 1 |
Top |
Cell-cell communication analysis |
| Identification of potential cell-cell interactions between two cell types and their ligand-receptor pairs for different disease states |
| Ligand | Receptor | LRpair | Pathway | Tissue | Disease Stage |
| Page: 1 |
Top |
Single-cell gene regulatory network inference analysis |
| Find out the significant the regulons (TFs) and the target genes of each regulon across cell types for different disease states |
| TF | Cell Type | Tissue | Disease Stage | Target Gene | RSS | Regulon Activity |
| ZBTB48 | MAST | Oral cavity | ADJ | TBP,GPSM2,TBC1D24, etc. | 1.80e-01 |  |
| ZBTB48 | CD8TEX | Oral cavity | ADJ | TBP,GPSM2,TBC1D24, etc. | 0.00e+00 | |
| ZBTB48 | CD8TEXINT | Oral cavity | ADJ | TBP,GPSM2,TBC1D24, etc. | 0.00e+00 | |
| ZBTB48 | INMON | Oral cavity | EOLP | TBP,GPSM2,TBC1D24, etc. | 2.21e-01 |  |
| ZBTB48 | CD8TEX | Oral cavity | EOLP | TBP,GPSM2,TBC1D24, etc. | 0.00e+00 | |
| ZBTB48 | CD8TEFF | Oral cavity | EOLP | TBP,GPSM2,TBC1D24, etc. | 1.36e-03 | |
| ZBTB48 | cDC | Oral cavity | EOLP | TBP,GPSM2,TBC1D24, etc. | 1.73e-03 | |
| ZBTB48 | MDSCs | Oral cavity | EOLP | TBP,GPSM2,TBC1D24, etc. | 0.00e+00 | |
| ZBTB48 | pDC | Oral cavity | EOLP | TBP,GPSM2,TBC1D24, etc. | 0.00e+00 | |
| ZBTB48 | NK | Oral cavity | EOLP | TBP,GPSM2,TBC1D24, etc. | 3.27e-03 | |
| ∗The dot plots of a searched regulon are shown for all cell subpopulations in each disease state of each tissue based on the regulon specific score inferred using pySCENIC and by calculating the average expression. |
| Page: 1 2 3 4 |
Top |
Somatic mutation of malignant transformation related genes |
| Annotation of somatic variants for genes involved in malignant transformation |
| Hugo Symbol | Variant Class | Variant Classification | dbSNP RS | HGVSc | HGVSp | HGVSp Short | SWISSPROT | BIOTYPE | SIFT | PolyPhen | Tumor Sample Barcode | Tissue | Histology | Sex | Age | Stage | Therapy Types | Drugs | Outcome |
| ZBTB48 | SNV | Missense_Mutation | c.94G>T | p.Val32Leu | p.V32L | P10074 | protein_coding | tolerated(0.11) | possibly_damaging(0.717) | TCGA-E9-A247-01 | Breast | breast invasive carcinoma | Female | <65 | I/II | Hormone Therapy | tamoxiphen | SD | |
| ZBTB48 | deletion | Frame_Shift_Del | novel | c.1577delG | p.Cys526LeufsTer12 | p.C526Lfs*12 | P10074 | protein_coding | TCGA-EW-A2FV-01 | Breast | breast invasive carcinoma | Female | <65 | III/IV | Chemotherapy | docetaxel | SD | ||
| ZBTB48 | SNV | Missense_Mutation | novel | c.1096C>T | p.Arg366Trp | p.R366W | P10074 | protein_coding | deleterious(0) | probably_damaging(0.999) | TCGA-VS-A8EJ-01 | Cervix | cervical & endocervical cancer | Female | <65 | I/II | Chemotherapy | cisplatin | PD |
| ZBTB48 | SNV | Missense_Mutation | c.1697G>A | p.Arg566His | p.R566H | P10074 | protein_coding | tolerated(0.07) | probably_damaging(0.971) | TCGA-A6-2686-01 | Colorectum | colon adenocarcinoma | Female | >=65 | I/II | Unknown | Unknown | SD | |
| ZBTB48 | SNV | Missense_Mutation | rs751636477 | c.1832N>A | p.Arg611His | p.R611H | P10074 | protein_coding | deleterious(0) | benign(0.299) | TCGA-AA-3672-01 | Colorectum | colon adenocarcinoma | Female | >=65 | III/IV | Unknown | Unknown | SD |
| ZBTB48 | SNV | Missense_Mutation | rs753725004 | c.1097N>A | p.Arg366Gln | p.R366Q | P10074 | protein_coding | deleterious(0.01) | probably_damaging(0.984) | TCGA-AA-3877-01 | Colorectum | colon adenocarcinoma | Female | >=65 | I/II | Unknown | Unknown | SD |
| ZBTB48 | SNV | Missense_Mutation | c.1592C>T | p.Thr531Ile | p.T531I | P10074 | protein_coding | deleterious(0.01) | probably_damaging(0.974) | TCGA-AZ-6601-01 | Colorectum | colon adenocarcinoma | Male | >=65 | I/II | Unknown | Unknown | PD | |
| ZBTB48 | SNV | Missense_Mutation | rs751172145 | c.1508N>A | p.Arg503Gln | p.R503Q | P10074 | protein_coding | deleterious(0.01) | possibly_damaging(0.903) | TCGA-CA-6717-01 | Colorectum | colon adenocarcinoma | Male | <65 | I/II | Chemotherapy | oxaliplatin | CR |
| ZBTB48 | SNV | Missense_Mutation | c.1454N>A | p.Arg485His | p.R485H | P10074 | protein_coding | deleterious(0) | probably_damaging(0.966) | TCGA-D5-6928-01 | Colorectum | colon adenocarcinoma | Male | >=65 | I/II | Unknown | Unknown | SD | |
| ZBTB48 | SNV | Missense_Mutation | novel | c.1886N>G | p.Gln629Arg | p.Q629R | P10074 | protein_coding | tolerated_low_confidence(0.09) | benign(0.366) | TCGA-G4-6320-01 | Colorectum | colon adenocarcinoma | Male | >=65 | III/IV | Chemotherapy | oxaliplatin | SD |
| Page: 1 2 3 4 5 |
Top |
Related drugs of malignant transformation related genes |
| Identification of chemicals and drugs interact with genes involved in malignant transfromation |
| (DGIdb 4.0) |
| Entrez ID | Symbol | Category | Interaction Types | Drug Claim Name | Drug Name | PMIDs |
| Page: 1 |

Copyright 2023-Present -The University of Texas Health Science Center at Houston |