
|
|||||
|
 | |
| |
| |
| |
| |
| |
|
Gene: ZBTB44 |
Gene summary for ZBTB44 |
| Gene information | Species | Human | Gene symbol | ZBTB44 | Gene ID | 29068 |
| Gene name | zinc finger and BTB domain containing 44 | |
| Gene Alias | BTBD15 | |
| Cytomap | 11q24.3 | |
| Gene Type | protein-coding | GO ID | GO:0005575 | UniProtAcc | H7BY22 |
Top |
Malignant transformation analysis |
| Identification of the aberrant gene expression in precancerous and cancerous lesions by comparing the gene expression of stem-like cells in diseased tissues with normal stem cells |
| Entrez ID | Symbol | Replicates | Species | Organ | Tissue | Adj P-value | Log2FC | Malignancy |
| 29068 | ZBTB44 | LZE4T | Human | Esophagus | ESCC | 1.28e-02 | -2.18e-02 | 0.0811 |
| 29068 | ZBTB44 | LZE7T | Human | Esophagus | ESCC | 3.49e-06 | 3.43e-02 | 0.0667 |
| 29068 | ZBTB44 | LZE20T | Human | Esophagus | ESCC | 2.98e-04 | 5.47e-02 | 0.0662 |
| 29068 | ZBTB44 | LZE22T | Human | Esophagus | ESCC | 7.17e-04 | 5.01e-02 | 0.068 |
| 29068 | ZBTB44 | LZE24T | Human | Esophagus | ESCC | 1.49e-19 | 4.91e-01 | 0.0596 |
| 29068 | ZBTB44 | LZE21T | Human | Esophagus | ESCC | 8.18e-06 | 6.39e-02 | 0.0655 |
| 29068 | ZBTB44 | LZE6T | Human | Esophagus | ESCC | 1.20e-05 | 1.31e-02 | 0.0845 |
| 29068 | ZBTB44 | P2T-E | Human | Esophagus | ESCC | 4.63e-11 | 1.51e-01 | 0.1177 |
| 29068 | ZBTB44 | P4T-E | Human | Esophagus | ESCC | 2.15e-22 | 4.57e-01 | 0.1323 |
| 29068 | ZBTB44 | P5T-E | Human | Esophagus | ESCC | 3.71e-05 | -2.79e-03 | 0.1327 |
| 29068 | ZBTB44 | P8T-E | Human | Esophagus | ESCC | 1.10e-23 | 4.73e-01 | 0.0889 |
| 29068 | ZBTB44 | P9T-E | Human | Esophagus | ESCC | 4.79e-13 | 7.23e-02 | 0.1131 |
| 29068 | ZBTB44 | P10T-E | Human | Esophagus | ESCC | 6.32e-28 | 5.10e-01 | 0.116 |
| 29068 | ZBTB44 | P11T-E | Human | Esophagus | ESCC | 1.74e-10 | 2.60e-01 | 0.1426 |
| 29068 | ZBTB44 | P12T-E | Human | Esophagus | ESCC | 3.38e-19 | 3.28e-01 | 0.1122 |
| 29068 | ZBTB44 | P15T-E | Human | Esophagus | ESCC | 4.21e-22 | 5.49e-02 | 0.1149 |
| 29068 | ZBTB44 | P16T-E | Human | Esophagus | ESCC | 3.01e-25 | 3.20e-01 | 0.1153 |
| 29068 | ZBTB44 | P17T-E | Human | Esophagus | ESCC | 9.34e-04 | 7.98e-02 | 0.1278 |
| 29068 | ZBTB44 | P20T-E | Human | Esophagus | ESCC | 1.96e-19 | 1.37e-01 | 0.1124 |
| 29068 | ZBTB44 | P21T-E | Human | Esophagus | ESCC | 5.76e-16 | 2.89e-01 | 0.1617 |
| Page: 1 2 3 4 5 |
| Tissue | Expression Dynamics | Abbreviation |
| Esophagus | 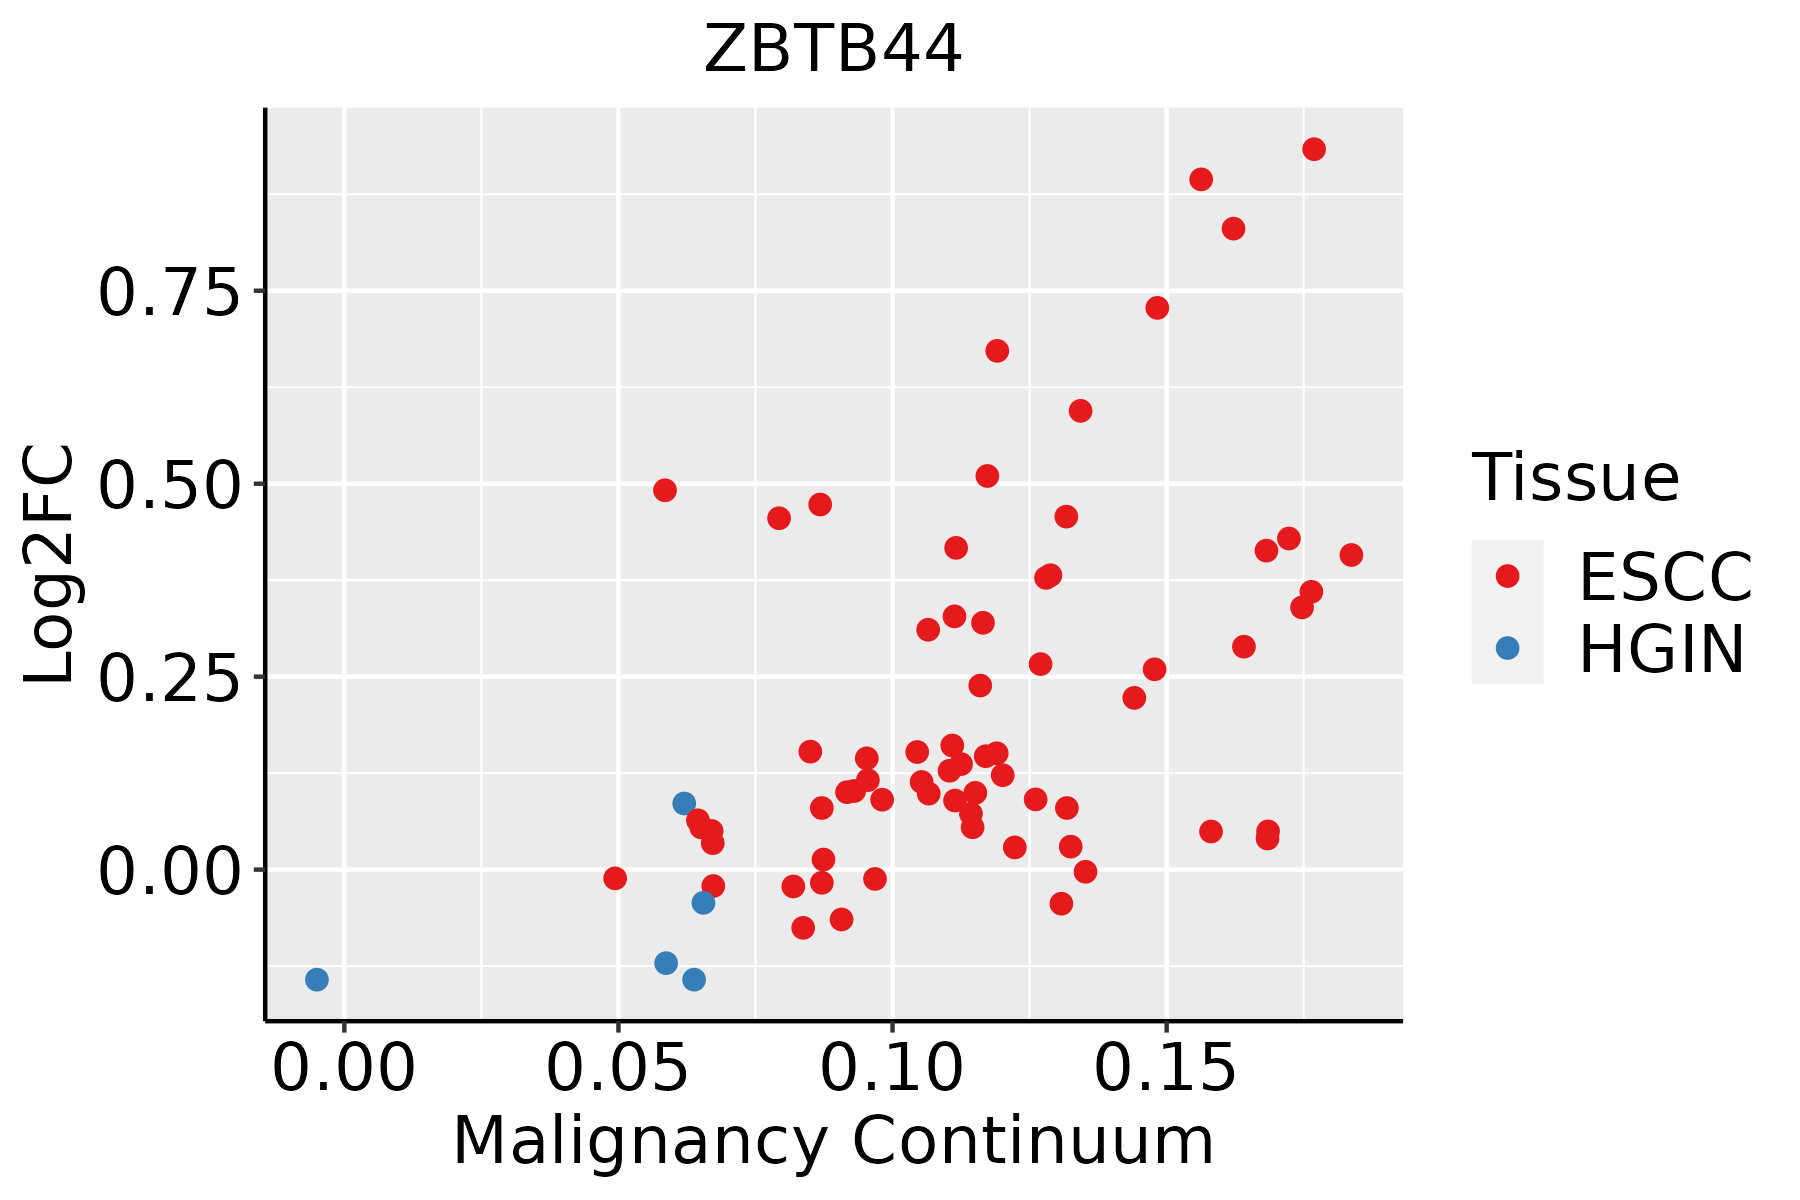 | ESCC: Esophageal squamous cell carcinoma |
| HGIN: High-grade intraepithelial neoplasias | ||
| LGIN: Low-grade intraepithelial neoplasias | ||
| Liver | 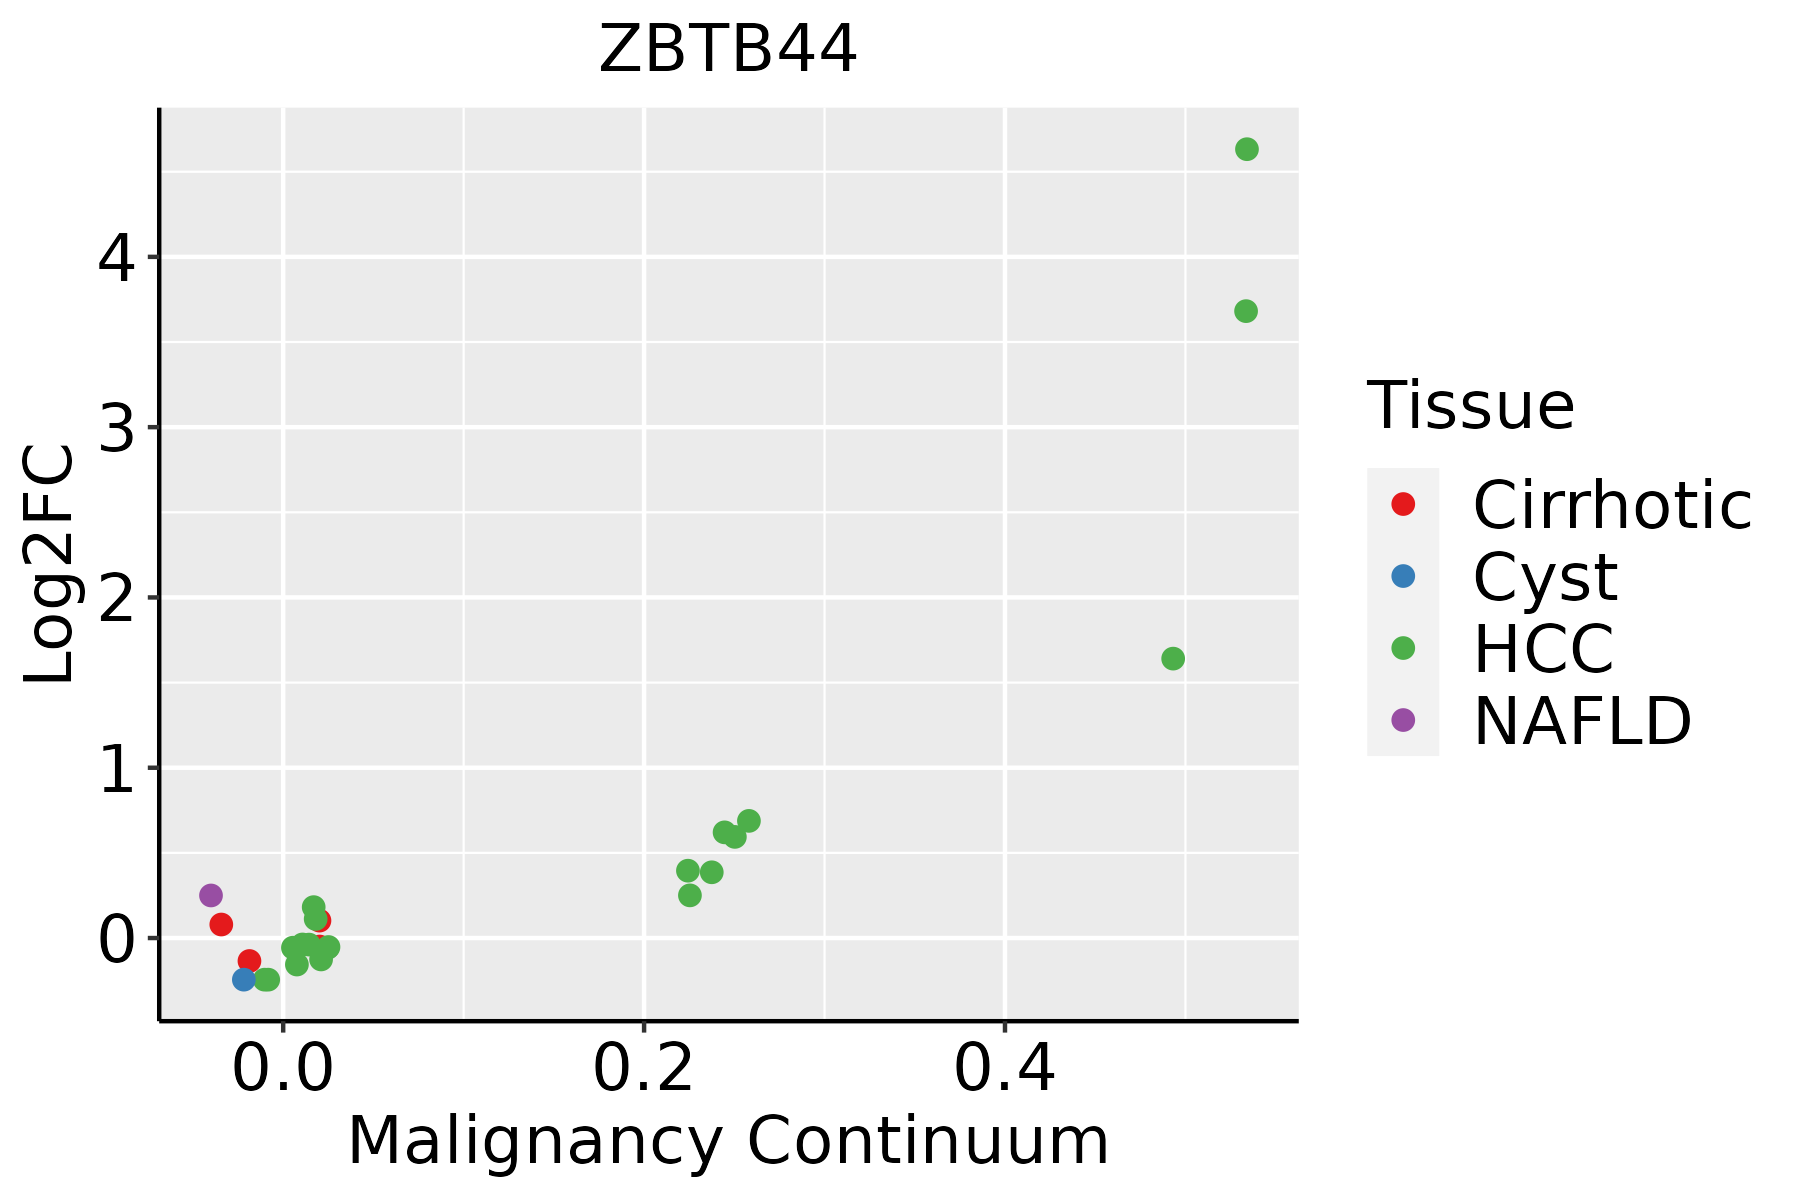 | HCC: Hepatocellular carcinoma |
| NAFLD: Non-alcoholic fatty liver disease | ||
| Oral Cavity | 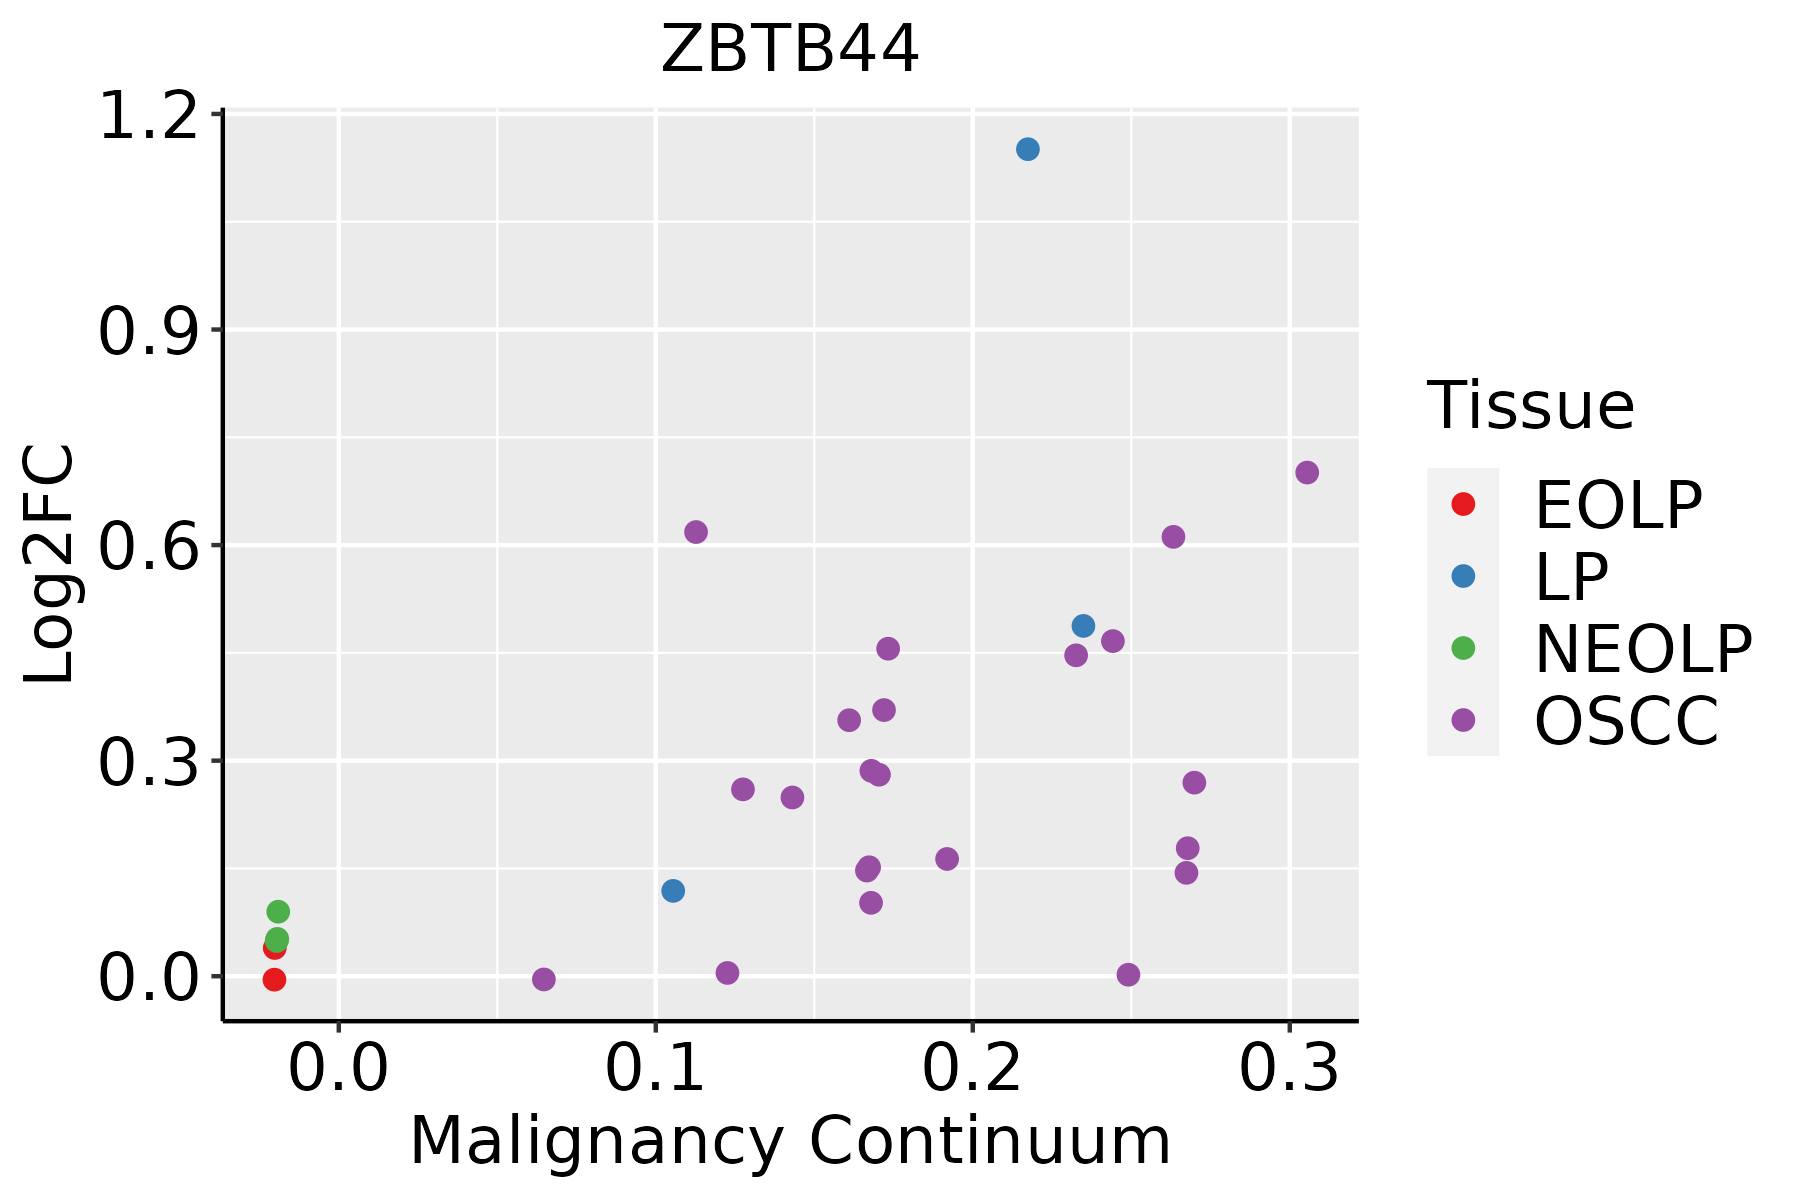 | EOLP: Erosive Oral lichen planus |
| LP: leukoplakia | ||
| NEOLP: Non-erosive oral lichen planus | ||
| OSCC: Oral squamous cell carcinoma | ||
| Prostate | 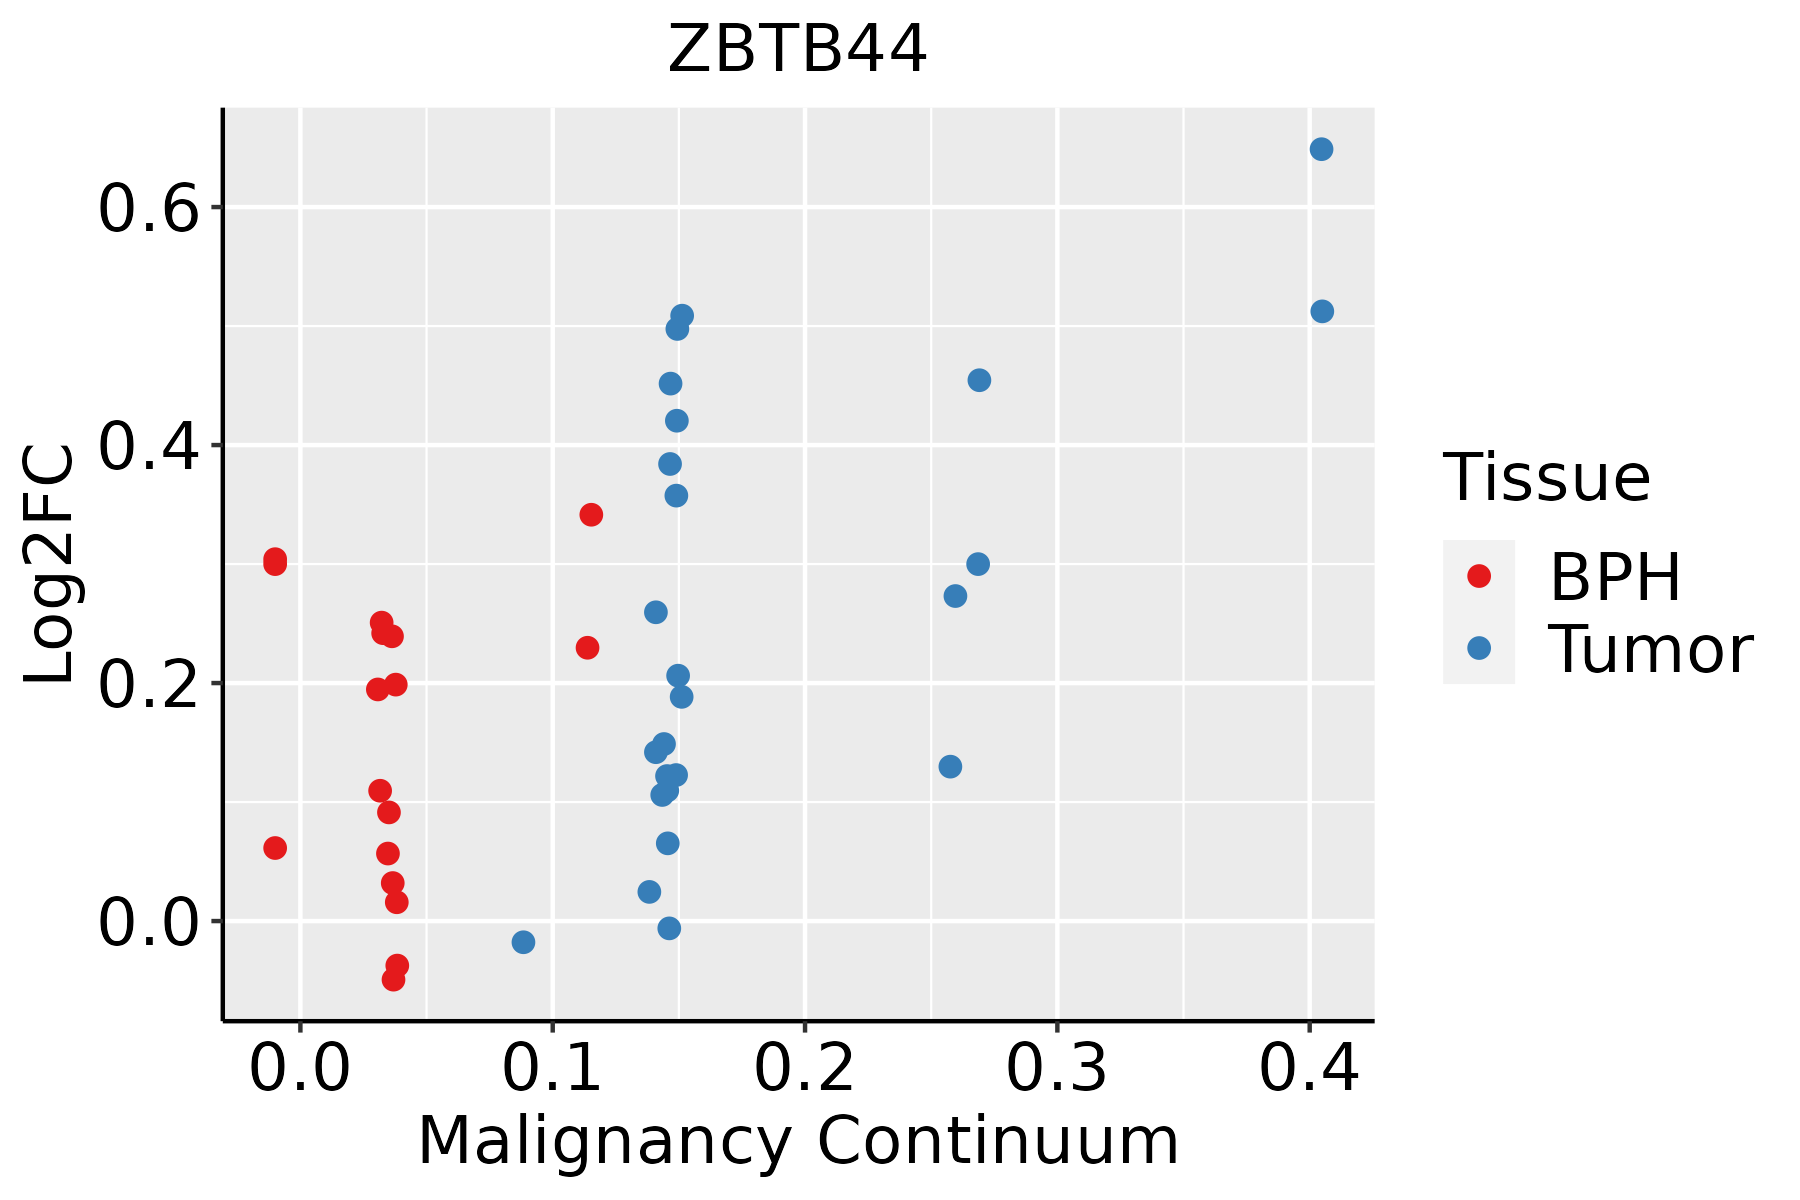 | BPH: Benign Prostatic Hyperplasia |
| Thyroid |  | ATC: Anaplastic thyroid cancer |
| HT: Hashimoto's thyroiditis | ||
| PTC: Papillary thyroid cancer |
| ∗log2FC in expression of this searched gene in stem-like cells from each diseased tissue sample relative to stem-like cells in normal samples in each tissue plotted against the malignancy continuum. Samples are colored based on if they are from different disease stage. |
Top |
Malignant transformation related pathway analysis |
| Find out the enriched GO biological processes and KEGG pathways involved in transition from healthy to precancer to cancer |
| Tissue | Disease Stage | Enriched GO biological Processes |
| Colorectum | AD |  |
| Colorectum | SER |  |
| Colorectum | MSS |  |
| Colorectum | MSI-H |  |
| Colorectum | FAP |  |
| ∗Top 15 enriched GO BP terms are showed in the bar plot of each disease state in each tissue. Each row represents a significant GO biological process which is colored according to the -log10(p.adjust). |
| Page: 1 2 3 4 5 6 7 8 9 |
| GO ID | Tissue | Disease Stage | Description | Gene Ratio | Bg Ratio | pvalue | p.adjust | Count |
| Page: 1 |
| Pathway ID | Tissue | Disease Stage | Description | Gene Ratio | Bg Ratio | pvalue | p.adjust | qvalue | Count |
| Page: 1 |
Top |
Cell-cell communication analysis |
| Identification of potential cell-cell interactions between two cell types and their ligand-receptor pairs for different disease states |
| Ligand | Receptor | LRpair | Pathway | Tissue | Disease Stage |
| Page: 1 |
Top |
Single-cell gene regulatory network inference analysis |
| Find out the significant the regulons (TFs) and the target genes of each regulon across cell types for different disease states |
| TF | Cell Type | Tissue | Disease Stage | Target Gene | RSS | Regulon Activity |
| ∗The dot plots of a searched regulon are shown for all cell subpopulations in each disease state of each tissue based on the regulon specific score inferred using pySCENIC and by calculating the average expression. |
| Page: 1 |
Top |
Somatic mutation of malignant transformation related genes |
| Annotation of somatic variants for genes involved in malignant transformation |
| Hugo Symbol | Variant Class | Variant Classification | dbSNP RS | HGVSc | HGVSp | HGVSp Short | SWISSPROT | BIOTYPE | SIFT | PolyPhen | Tumor Sample Barcode | Tissue | Histology | Sex | Age | Stage | Therapy Types | Drugs | Outcome |
| ZBTB44 | SNV | Missense_Mutation | novel | c.1265N>T | p.Ser422Leu | p.S422L | protein_coding | deleterious(0) | benign(0.167) | TCGA-5L-AAT0-01 | Breast | breast invasive carcinoma | Female | <65 | I/II | Hormone Therapy | tamoxiphen | SD | |
| ZBTB44 | SNV | Missense_Mutation | c.362C>T | p.Ser121Leu | p.S121L | protein_coding | deleterious(0.03) | probably_damaging(0.996) | TCGA-BH-A18P-01 | Breast | breast invasive carcinoma | Female | <65 | I/II | Unknown | Unknown | PD | ||
| ZBTB44 | SNV | Missense_Mutation | c.1022N>T | p.Ser341Leu | p.S341L | protein_coding | deleterious(0.01) | benign(0.197) | TCGA-EW-A1IW-01 | Breast | breast invasive carcinoma | Female | >=65 | I/II | Hormone Therapy | aromasin | SD | ||
| ZBTB44 | deletion | Frame_Shift_Del | novel | c.725delN | p.Pro242LeufsTer13 | p.P242Lfs*13 | protein_coding | TCGA-D8-A27V-01 | Breast | breast invasive carcinoma | Female | <65 | I/II | Hormone Therapy | tamoxiphen | SD | |||
| ZBTB44 | SNV | Missense_Mutation | c.1609N>C | p.Glu537Gln | p.E537Q | protein_coding | tolerated_low_confidence(0.13) | benign(0.283) | TCGA-IR-A3LK-01 | Cervix | cervical & endocervical cancer | Female | >=65 | I/II | Chemotherapy | cisplatin | PD | ||
| ZBTB44 | SNV | Missense_Mutation | c.107N>A | p.Arg36His | p.R36H | protein_coding | deleterious(0.03) | probably_damaging(0.999) | TCGA-AA-3492-01 | Colorectum | colon adenocarcinoma | Female | >=65 | I/II | Unknown | Unknown | SD | ||
| ZBTB44 | SNV | Missense_Mutation | novel | c.1357C>T | p.Arg453Cys | p.R453C | protein_coding | deleterious(0) | probably_damaging(0.944) | TCGA-AA-3947-01 | Colorectum | colon adenocarcinoma | Female | <65 | I/II | Unknown | Unknown | SD | |
| ZBTB44 | SNV | Missense_Mutation | c.1198C>A | p.Gln400Lys | p.Q400K | protein_coding | tolerated(0.26) | benign(0.396) | TCGA-CA-6718-01 | Colorectum | colon adenocarcinoma | Male | <65 | I/II | Unknown | Unknown | PD | ||
| ZBTB44 | SNV | Missense_Mutation | c.393N>A | p.Asn131Lys | p.N131K | protein_coding | deleterious(0.02) | benign(0.373) | TCGA-G4-6304-01 | Colorectum | colon adenocarcinoma | Female | >=65 | I/II | Chemotherapy | fluorouracil | PD | ||
| ZBTB44 | SNV | Missense_Mutation | c.446N>A | p.Ser149Tyr | p.S149Y | protein_coding | deleterious(0.01) | possibly_damaging(0.674) | TCGA-AG-3892-01 | Colorectum | rectum adenocarcinoma | Female | <65 | I/II | Unknown | Unknown | SD |
| Page: 1 2 3 4 |
Top |
Related drugs of malignant transformation related genes |
| Identification of chemicals and drugs interact with genes involved in malignant transfromation |
| (DGIdb 4.0) |
| Entrez ID | Symbol | Category | Interaction Types | Drug Claim Name | Drug Name | PMIDs |
| Page: 1 |

Copyright 2023-Present -The University of Texas Health Science Center at Houston |