
|
|||||
|
 | |
| |
| |
| |
| |
| |
|
Gene: ZBTB38 |
Gene summary for ZBTB38 |
| Gene information | Species | Human | Gene symbol | ZBTB38 | Gene ID | 253461 |
| Gene name | zinc finger and BTB domain containing 38 | |
| Gene Alias | CIBZ | |
| Cytomap | 3q23 | |
| Gene Type | protein-coding | GO ID | GO:0006139 | UniProtAcc | Q8NAP3 |
Top |
Malignant transformation analysis |
| Identification of the aberrant gene expression in precancerous and cancerous lesions by comparing the gene expression of stem-like cells in diseased tissues with normal stem cells |
| Entrez ID | Symbol | Replicates | Species | Organ | Tissue | Adj P-value | Log2FC | Malignancy |
| 253461 | ZBTB38 | HTA11_3410_2000001011 | Human | Colorectum | AD | 1.28e-04 | -3.68e-01 | 0.0155 |
| 253461 | ZBTB38 | HTA11_2487_2000001011 | Human | Colorectum | SER | 1.88e-07 | -4.71e-01 | -0.1808 |
| 253461 | ZBTB38 | HTA11_3361_2000001011 | Human | Colorectum | AD | 2.28e-11 | -7.45e-01 | -0.1207 |
| 253461 | ZBTB38 | HTA11_5212_2000001011 | Human | Colorectum | AD | 2.17e-04 | -5.40e-01 | -0.2061 |
| 253461 | ZBTB38 | HTA11_5216_2000001011 | Human | Colorectum | SER | 1.79e-04 | -8.45e-01 | -0.1462 |
| 253461 | ZBTB38 | HTA11_866_3004761011 | Human | Colorectum | AD | 1.23e-02 | -3.65e-01 | 0.096 |
| 253461 | ZBTB38 | HTA11_8622_2000001021 | Human | Colorectum | SER | 2.94e-04 | -6.32e-01 | 0.0528 |
| 253461 | ZBTB38 | HTA11_10711_2000001011 | Human | Colorectum | AD | 4.93e-02 | -3.10e-01 | 0.0338 |
| 253461 | ZBTB38 | HTA11_99999970781_79442 | Human | Colorectum | MSS | 9.07e-26 | -6.83e-01 | 0.294 |
| 253461 | ZBTB38 | HTA11_99999973899_84307 | Human | Colorectum | MSS | 3.81e-05 | -4.24e-01 | 0.2585 |
| 253461 | ZBTB38 | HTA11_99999974143_84620 | Human | Colorectum | MSS | 1.53e-37 | -8.73e-01 | 0.3005 |
| 253461 | ZBTB38 | A015-C-203 | Human | Colorectum | FAP | 4.20e-32 | -1.76e-01 | -0.1294 |
| 253461 | ZBTB38 | A015-C-204 | Human | Colorectum | FAP | 1.53e-04 | -1.22e-01 | -0.0228 |
| 253461 | ZBTB38 | A014-C-040 | Human | Colorectum | FAP | 2.99e-03 | -3.05e-02 | -0.1184 |
| 253461 | ZBTB38 | A002-C-201 | Human | Colorectum | FAP | 3.49e-09 | 3.51e-02 | 0.0324 |
| 253461 | ZBTB38 | A001-C-119 | Human | Colorectum | FAP | 2.29e-08 | -4.60e-01 | -0.1557 |
| 253461 | ZBTB38 | A001-C-108 | Human | Colorectum | FAP | 1.45e-15 | -1.53e-01 | -0.0272 |
| 253461 | ZBTB38 | A002-C-205 | Human | Colorectum | FAP | 2.33e-22 | -1.47e-01 | -0.1236 |
| 253461 | ZBTB38 | A015-C-005 | Human | Colorectum | FAP | 3.20e-02 | 1.71e-01 | -0.0336 |
| 253461 | ZBTB38 | A015-C-006 | Human | Colorectum | FAP | 1.43e-17 | -4.79e-01 | -0.0994 |
| Page: 1 2 3 4 5 6 7 8 9 10 |
| Tissue | Expression Dynamics | Abbreviation |
| Colorectum (GSE201348) |  | FAP: Familial adenomatous polyposis |
| CRC: Colorectal cancer | ||
| Colorectum (HTA11) |  | AD: Adenomas |
| SER: Sessile serrated lesions | ||
| MSI-H: Microsatellite-high colorectal cancer | ||
| MSS: Microsatellite stable colorectal cancer | ||
| Endometrium |  | AEH: Atypical endometrial hyperplasia |
| EEC: Endometrioid Cancer | ||
| Esophagus |  | ESCC: Esophageal squamous cell carcinoma |
| HGIN: High-grade intraepithelial neoplasias | ||
| LGIN: Low-grade intraepithelial neoplasias | ||
| Liver |  | HCC: Hepatocellular carcinoma |
| NAFLD: Non-alcoholic fatty liver disease | ||
| Oral Cavity |  | EOLP: Erosive Oral lichen planus |
| LP: leukoplakia | ||
| NEOLP: Non-erosive oral lichen planus | ||
| OSCC: Oral squamous cell carcinoma | ||
| Prostate |  | BPH: Benign Prostatic Hyperplasia |
| Thyroid | 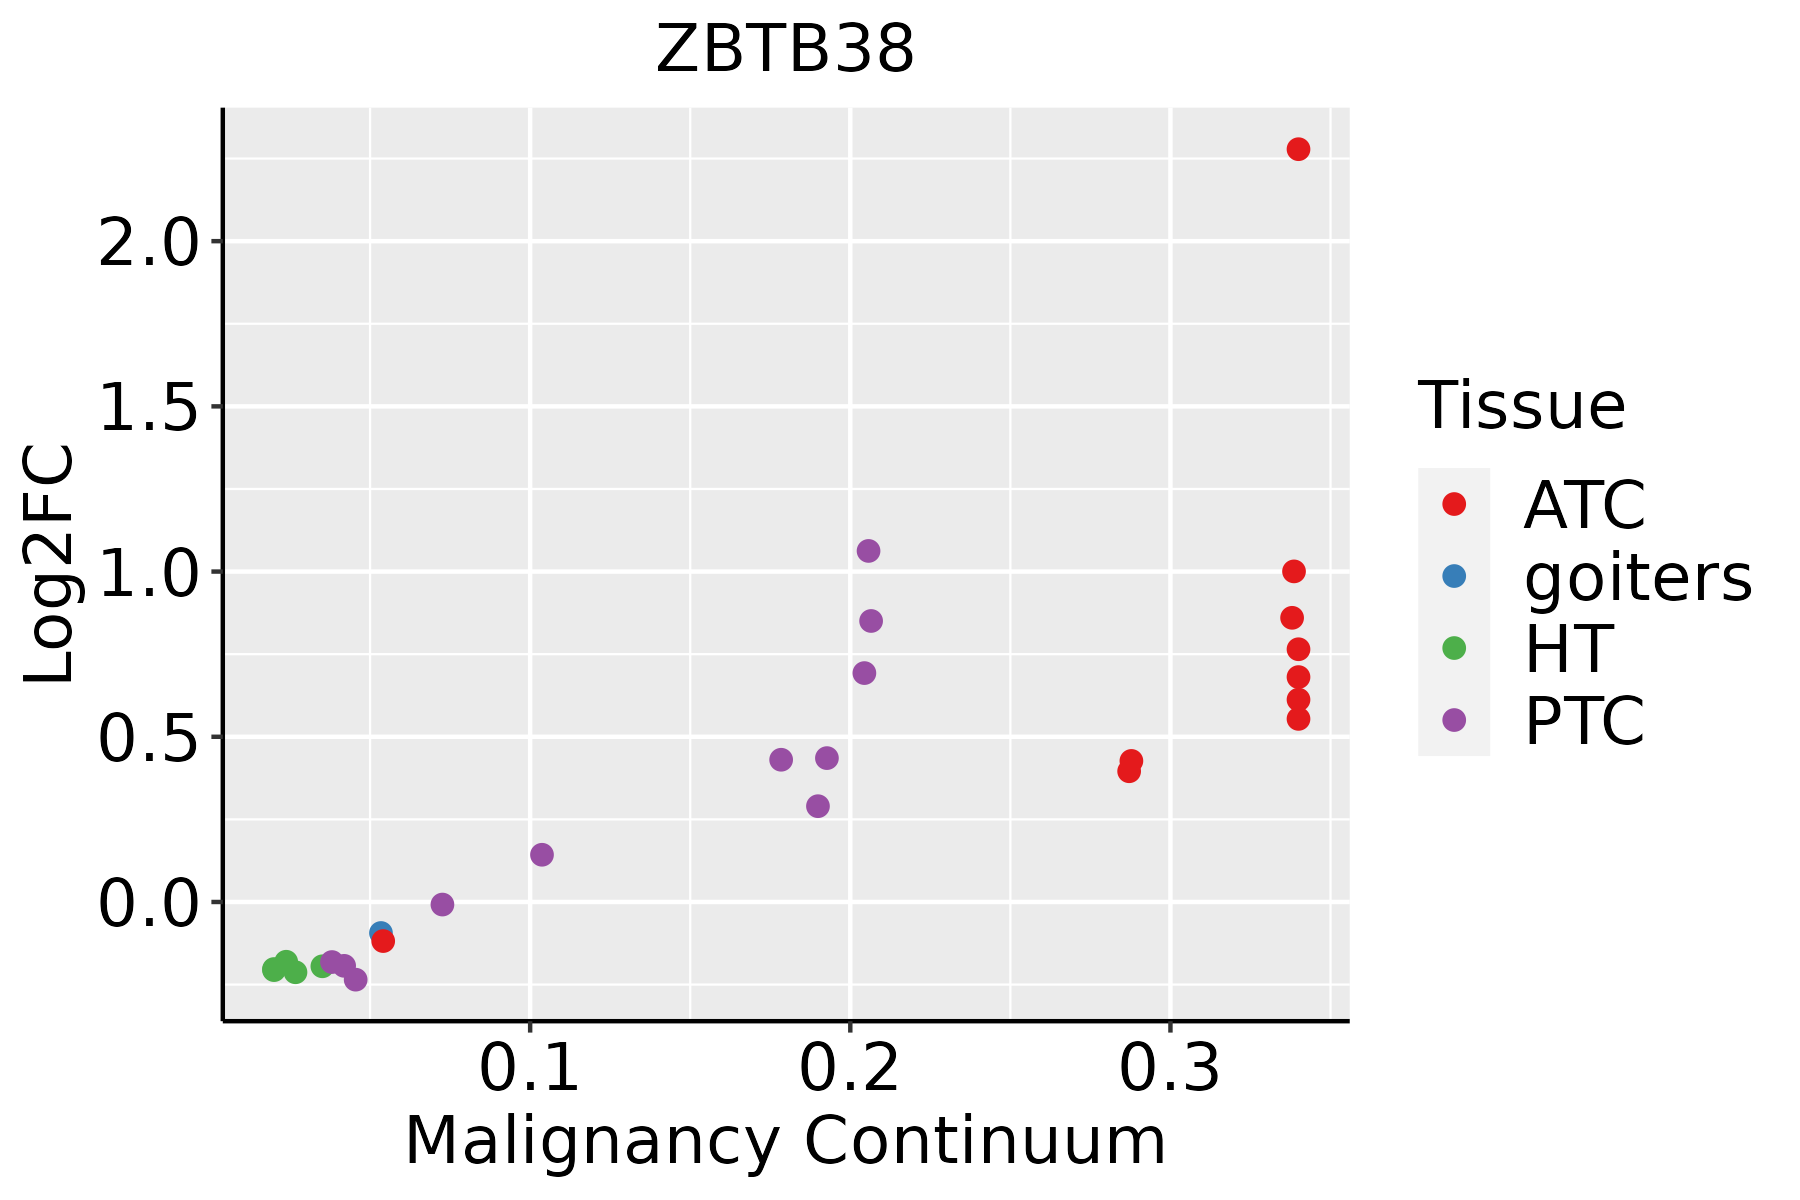 | ATC: Anaplastic thyroid cancer |
| HT: Hashimoto's thyroiditis | ||
| PTC: Papillary thyroid cancer |
| ∗log2FC in expression of this searched gene in stem-like cells from each diseased tissue sample relative to stem-like cells in normal samples in each tissue plotted against the malignancy continuum. Samples are colored based on if they are from different disease stage. |
Top |
Malignant transformation related pathway analysis |
| Find out the enriched GO biological processes and KEGG pathways involved in transition from healthy to precancer to cancer |
| Tissue | Disease Stage | Enriched GO biological Processes |
| Colorectum | AD |  |
| Colorectum | SER |  |
| Colorectum | MSS |  |
| Colorectum | MSI-H |  |
| Colorectum | FAP |  |
| ∗Top 15 enriched GO BP terms are showed in the bar plot of each disease state in each tissue. Each row represents a significant GO biological process which is colored according to the -log10(p.adjust). |
| Page: 1 2 3 4 5 6 7 8 9 |
| GO ID | Tissue | Disease Stage | Description | Gene Ratio | Bg Ratio | pvalue | p.adjust | Count |
| GO:0006275 | Colorectum | CRC | regulation of DNA replication | 21/2078 | 107/18723 | 6.56e-03 | 4.70e-02 | 21 |
| GO:00062752 | Endometrium | AEH | regulation of DNA replication | 21/2100 | 107/18723 | 7.38e-03 | 4.20e-02 | 21 |
| GO:000627511 | Endometrium | EEC | regulation of DNA replication | 22/2168 | 107/18723 | 5.09e-03 | 3.20e-02 | 22 |
| GO:00062604 | Esophagus | ESCC | DNA replication | 181/8552 | 260/18723 | 3.55e-15 | 2.05e-13 | 181 |
| GO:00062754 | Esophagus | ESCC | regulation of DNA replication | 73/8552 | 107/18723 | 1.97e-06 | 2.28e-05 | 73 |
| GO:00062601 | Liver | HCC | DNA replication | 146/7958 | 260/18723 | 5.68e-06 | 7.02e-05 | 146 |
| GO:00062751 | Liver | HCC | regulation of DNA replication | 60/7958 | 107/18723 | 3.15e-03 | 1.46e-02 | 60 |
| GO:00062603 | Oral cavity | OSCC | DNA replication | 159/7305 | 260/18723 | 3.25e-13 | 1.59e-11 | 159 |
| GO:00062753 | Oral cavity | OSCC | regulation of DNA replication | 62/7305 | 107/18723 | 5.49e-05 | 4.54e-04 | 62 |
| GO:00062606 | Thyroid | PTC | DNA replication | 114/5968 | 260/18723 | 3.09e-05 | 2.95e-04 | 114 |
| GO:000626013 | Thyroid | ATC | DNA replication | 124/6293 | 260/18723 | 1.58e-06 | 1.93e-05 | 124 |
| GO:00062756 | Thyroid | ATC | regulation of DNA replication | 50/6293 | 107/18723 | 3.25e-03 | 1.46e-02 | 50 |
| Page: 1 |
| Pathway ID | Tissue | Disease Stage | Description | Gene Ratio | Bg Ratio | pvalue | p.adjust | qvalue | Count |
| Page: 1 |
Top |
Cell-cell communication analysis |
| Identification of potential cell-cell interactions between two cell types and their ligand-receptor pairs for different disease states |
| Ligand | Receptor | LRpair | Pathway | Tissue | Disease Stage |
| Page: 1 |
Top |
Single-cell gene regulatory network inference analysis |
| Find out the significant the regulons (TFs) and the target genes of each regulon across cell types for different disease states |
| TF | Cell Type | Tissue | Disease Stage | Target Gene | RSS | Regulon Activity |
| ZBTB38 | ASC | Colorectum | AD | GPR160,XACT,MECOM, etc. | 2.49e-01 |  |
| ZBTB38 | ASC | Colorectum | SER | GPR160,XACT,MECOM, etc. | 1.21e-01 |  |
| ZBTB38 | PERI | Liver | Healthy | CELF4,PNRC1,SPON1, etc. | 8.26e-03 |  |
| ZBTB38 | HSC | Liver | Healthy | CELF4,PNRC1,SPON1, etc. | 6.72e-03 | |
| ∗The dot plots of a searched regulon are shown for all cell subpopulations in each disease state of each tissue based on the regulon specific score inferred using pySCENIC and by calculating the average expression. |
| Page: 1 |
Top |
Somatic mutation of malignant transformation related genes |
| Annotation of somatic variants for genes involved in malignant transformation |
| Hugo Symbol | Variant Class | Variant Classification | dbSNP RS | HGVSc | HGVSp | HGVSp Short | SWISSPROT | BIOTYPE | SIFT | PolyPhen | Tumor Sample Barcode | Tissue | Histology | Sex | Age | Stage | Therapy Types | Drugs | Outcome |
| ZBTB38 | SNV | Missense_Mutation | novel | c.304G>A | p.Glu102Lys | p.E102K | Q8NAP3 | protein_coding | deleterious(0.01) | probably_damaging(0.927) | TCGA-5L-AAT0-01 | Breast | breast invasive carcinoma | Female | <65 | I/II | Hormone Therapy | tamoxiphen | SD |
| ZBTB38 | SNV | Missense_Mutation | novel | c.3103N>A | p.Glu1035Lys | p.E1035K | Q8NAP3 | protein_coding | deleterious(0.04) | probably_damaging(0.999) | TCGA-A2-A1FX-01 | Breast | breast invasive carcinoma | Female | <65 | III/IV | Chemotherapy | taxotere | SD |
| ZBTB38 | SNV | Missense_Mutation | novel | c.3397N>C | p.Ile1133Leu | p.I1133L | Q8NAP3 | protein_coding | deleterious(0.02) | benign(0.138) | TCGA-BH-A0HF-01 | Breast | breast invasive carcinoma | Female | >=65 | I/II | Hormone Therapy | arimidex | SD |
| ZBTB38 | SNV | Missense_Mutation | novel | c.3508G>A | p.Glu1170Lys | p.E1170K | Q8NAP3 | protein_coding | tolerated_low_confidence(0.07) | benign(0.241) | TCGA-BH-A42T-01 | Breast | breast invasive carcinoma | Female | >=65 | I/II | Unknown | Unknown | SD |
| ZBTB38 | SNV | Missense_Mutation | c.812N>G | p.Ile271Arg | p.I271R | Q8NAP3 | protein_coding | tolerated(0.68) | benign(0) | TCGA-GM-A2DB-01 | Breast | breast invasive carcinoma | Female | <65 | I/II | Chemotherapy | taxol | CR | |
| ZBTB38 | insertion | Frame_Shift_Ins | novel | c.1034_1035insAGTCACTGATCTCGCAGCTGCAGGAAAAAAGCTGGGAATAT | p.Ser345ArgfsTer41 | p.S345Rfs*41 | Q8NAP3 | protein_coding | TCGA-AO-A0J9-01 | Breast | breast invasive carcinoma | Female | <65 | III/IV | Chemotherapy | cyclophosphamide | PD | ||
| ZBTB38 | insertion | In_Frame_Ins | novel | c.2000_2001insTGTACTGTGTATCTCTTACTGTGGGAAGTATGAAAG | p.Asn667_Phe668insValLeuCysIleSerTyrCysGlyLysTyrGluSer | p.N667_F668insVLCISYCGKYES | Q8NAP3 | protein_coding | TCGA-AO-A0JB-01 | Breast | breast invasive carcinoma | Female | <65 | III/IV | Chemotherapy | cyclophosphamide | SD | ||
| ZBTB38 | insertion | Nonsense_Mutation | novel | c.3399_3400insGAAGCCTAGTGTCTATCCGTATAAACTTTATAGGCTAC | p.Cys1134GlufsTer3 | p.C1134Efs*3 | Q8NAP3 | protein_coding | TCGA-BH-A0HF-01 | Breast | breast invasive carcinoma | Female | >=65 | I/II | Hormone Therapy | arimidex | SD | ||
| ZBTB38 | deletion | Frame_Shift_Del | novel | c.1056delN | p.Asp352GlufsTer20 | p.D352Efs*20 | Q8NAP3 | protein_coding | TCGA-D8-A27V-01 | Breast | breast invasive carcinoma | Female | <65 | I/II | Hormone Therapy | tamoxiphen | SD | ||
| ZBTB38 | SNV | Missense_Mutation | c.1661N>A | p.Gly554Glu | p.G554E | Q8NAP3 | protein_coding | deleterious(0) | possibly_damaging(0.893) | TCGA-C5-A1MH-01 | Cervix | cervical & endocervical cancer | Female | >=65 | III/IV | Chemotherapy | cisplatin | PD |
| Page: 1 2 3 4 5 6 7 8 9 10 11 |
Top |
Related drugs of malignant transformation related genes |
| Identification of chemicals and drugs interact with genes involved in malignant transfromation |
| (DGIdb 4.0) |
| Entrez ID | Symbol | Category | Interaction Types | Drug Claim Name | Drug Name | PMIDs |
| Page: 1 |

Copyright 2023-Present -The University of Texas Health Science Center at Houston |