
|
|||||
|
 | |
| |
| |
| |
| |
| |
|
Gene: ZBTB24 |
Gene summary for ZBTB24 |
| Gene information | Species | Human | Gene symbol | ZBTB24 | Gene ID | 9841 |
| Gene name | zinc finger and BTB domain containing 24 | |
| Gene Alias | BIF1 | |
| Cytomap | 6q21 | |
| Gene Type | protein-coding | GO ID | GO:0002244 | UniProtAcc | O43167 |
Top |
Malignant transformation analysis |
| Identification of the aberrant gene expression in precancerous and cancerous lesions by comparing the gene expression of stem-like cells in diseased tissues with normal stem cells |
| Entrez ID | Symbol | Replicates | Species | Organ | Tissue | Adj P-value | Log2FC | Malignancy |
| 9841 | ZBTB24 | LZE4T | Human | Esophagus | ESCC | 3.26e-06 | 1.57e-01 | 0.0811 |
| 9841 | ZBTB24 | LZE7T | Human | Esophagus | ESCC | 8.52e-04 | 1.80e-01 | 0.0667 |
| 9841 | ZBTB24 | LZE24T | Human | Esophagus | ESCC | 2.78e-05 | 2.30e-01 | 0.0596 |
| 9841 | ZBTB24 | P1T-E | Human | Esophagus | ESCC | 6.85e-06 | 2.98e-01 | 0.0875 |
| 9841 | ZBTB24 | P2T-E | Human | Esophagus | ESCC | 1.09e-20 | 3.70e-01 | 0.1177 |
| 9841 | ZBTB24 | P4T-E | Human | Esophagus | ESCC | 7.22e-11 | 3.01e-01 | 0.1323 |
| 9841 | ZBTB24 | P5T-E | Human | Esophagus | ESCC | 8.33e-12 | 2.46e-01 | 0.1327 |
| 9841 | ZBTB24 | P8T-E | Human | Esophagus | ESCC | 3.25e-02 | 8.84e-02 | 0.0889 |
| 9841 | ZBTB24 | P9T-E | Human | Esophagus | ESCC | 2.57e-02 | 1.20e-01 | 0.1131 |
| 9841 | ZBTB24 | P10T-E | Human | Esophagus | ESCC | 2.92e-06 | 2.06e-01 | 0.116 |
| 9841 | ZBTB24 | P12T-E | Human | Esophagus | ESCC | 4.12e-08 | 1.95e-01 | 0.1122 |
| 9841 | ZBTB24 | P15T-E | Human | Esophagus | ESCC | 6.37e-09 | 2.42e-01 | 0.1149 |
| 9841 | ZBTB24 | P16T-E | Human | Esophagus | ESCC | 4.75e-35 | 6.30e-01 | 0.1153 |
| 9841 | ZBTB24 | P20T-E | Human | Esophagus | ESCC | 2.44e-03 | 1.37e-01 | 0.1124 |
| 9841 | ZBTB24 | P21T-E | Human | Esophagus | ESCC | 2.71e-10 | 2.73e-01 | 0.1617 |
| 9841 | ZBTB24 | P22T-E | Human | Esophagus | ESCC | 1.18e-06 | 1.70e-01 | 0.1236 |
| 9841 | ZBTB24 | P23T-E | Human | Esophagus | ESCC | 1.40e-14 | 3.79e-01 | 0.108 |
| 9841 | ZBTB24 | P24T-E | Human | Esophagus | ESCC | 1.37e-05 | 1.80e-01 | 0.1287 |
| 9841 | ZBTB24 | P26T-E | Human | Esophagus | ESCC | 3.25e-11 | 2.32e-01 | 0.1276 |
| 9841 | ZBTB24 | P27T-E | Human | Esophagus | ESCC | 3.66e-10 | 1.96e-01 | 0.1055 |
| Page: 1 2 3 4 |
| Tissue | Expression Dynamics | Abbreviation |
| Esophagus |  | ESCC: Esophageal squamous cell carcinoma |
| HGIN: High-grade intraepithelial neoplasias | ||
| LGIN: Low-grade intraepithelial neoplasias | ||
| Liver |  | HCC: Hepatocellular carcinoma |
| NAFLD: Non-alcoholic fatty liver disease | ||
| Thyroid | 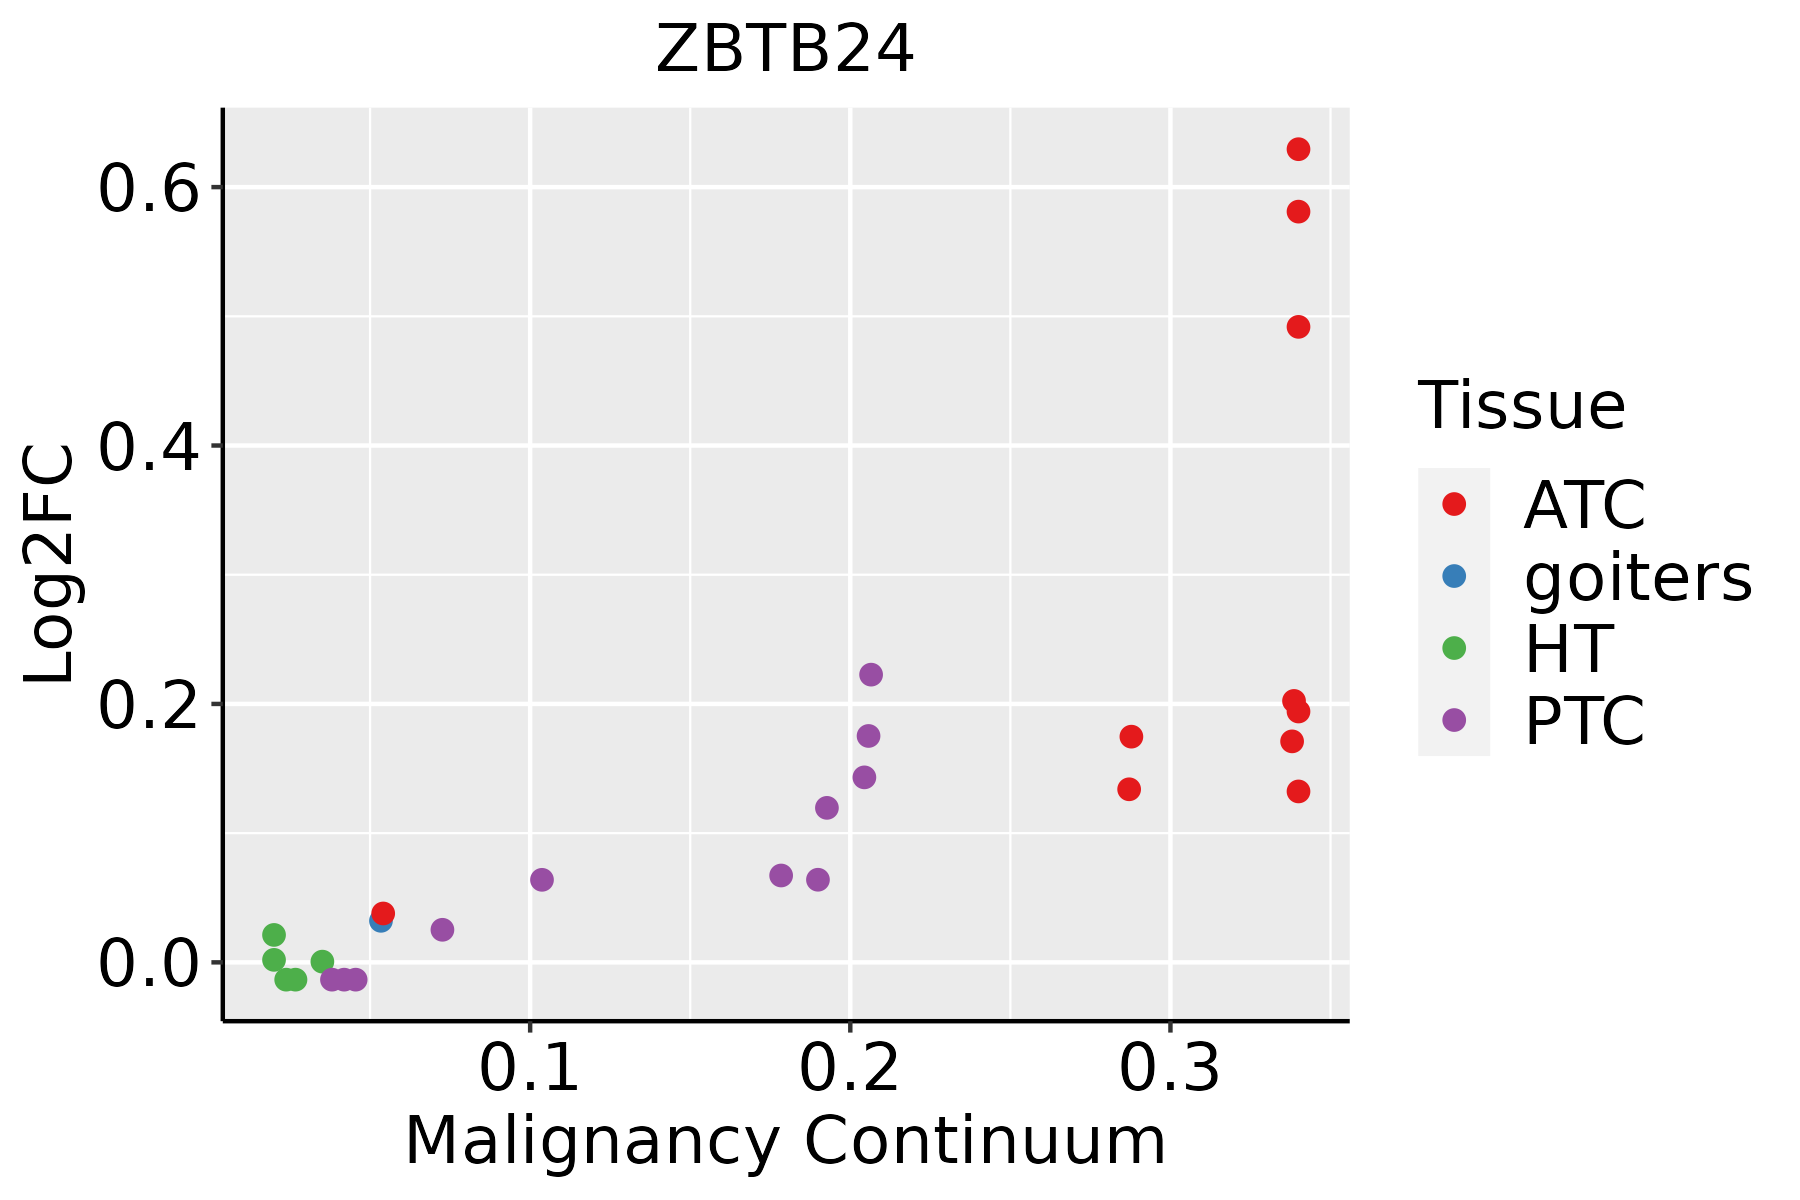 | ATC: Anaplastic thyroid cancer |
| HT: Hashimoto's thyroiditis | ||
| PTC: Papillary thyroid cancer |
| ∗log2FC in expression of this searched gene in stem-like cells from each diseased tissue sample relative to stem-like cells in normal samples in each tissue plotted against the malignancy continuum. Samples are colored based on if they are from different disease stage. |
Top |
Malignant transformation related pathway analysis |
| Find out the enriched GO biological processes and KEGG pathways involved in transition from healthy to precancer to cancer |
| Tissue | Disease Stage | Enriched GO biological Processes |
| Colorectum | AD |  |
| Colorectum | SER |  |
| Colorectum | MSS |  |
| Colorectum | MSI-H |  |
| Colorectum | FAP |  |
| ∗Top 15 enriched GO BP terms are showed in the bar plot of each disease state in each tissue. Each row represents a significant GO biological process which is colored according to the -log10(p.adjust). |
| Page: 1 2 3 4 5 6 7 8 9 |
| GO ID | Tissue | Disease Stage | Description | Gene Ratio | Bg Ratio | pvalue | p.adjust | Count |
| GO:00022446 | Esophagus | ESCC | hematopoietic progenitor cell differentiation | 66/8552 | 114/18723 | 5.74e-03 | 2.13e-02 | 66 |
| GO:00022448 | Thyroid | ATC | hematopoietic progenitor cell differentiation | 51/6293 | 114/18723 | 8.62e-03 | 3.28e-02 | 51 |
| Page: 1 |
| Pathway ID | Tissue | Disease Stage | Description | Gene Ratio | Bg Ratio | pvalue | p.adjust | qvalue | Count |
| Page: 1 |
Top |
Cell-cell communication analysis |
| Identification of potential cell-cell interactions between two cell types and their ligand-receptor pairs for different disease states |
| Ligand | Receptor | LRpair | Pathway | Tissue | Disease Stage |
| Page: 1 |
Top |
Single-cell gene regulatory network inference analysis |
| Find out the significant the regulons (TFs) and the target genes of each regulon across cell types for different disease states |
| TF | Cell Type | Tissue | Disease Stage | Target Gene | RSS | Regulon Activity |
| ∗The dot plots of a searched regulon are shown for all cell subpopulations in each disease state of each tissue based on the regulon specific score inferred using pySCENIC and by calculating the average expression. |
| Page: 1 |
Top |
Somatic mutation of malignant transformation related genes |
| Annotation of somatic variants for genes involved in malignant transformation |
| Hugo Symbol | Variant Class | Variant Classification | dbSNP RS | HGVSc | HGVSp | HGVSp Short | SWISSPROT | BIOTYPE | SIFT | PolyPhen | Tumor Sample Barcode | Tissue | Histology | Sex | Age | Stage | Therapy Types | Drugs | Outcome |
| ZBTB24 | SNV | Missense_Mutation | c.195G>C | p.Met65Ile | p.M65I | O43167 | protein_coding | deleterious(0.04) | probably_damaging(0.933) | TCGA-A8-A07W-01 | Breast | breast invasive carcinoma | Female | >=65 | III/IV | Hormone Therapy | exemestane | SD | |
| ZBTB24 | SNV | Missense_Mutation | novel | c.2003N>T | p.Ala668Val | p.A668V | O43167 | protein_coding | tolerated(0.09) | benign(0.001) | TCGA-A8-A093-01 | Breast | breast invasive carcinoma | Female | <65 | I/II | Hormone Therapy | tamoxiphen | SD |
| ZBTB24 | SNV | Missense_Mutation | novel | c.1300T>G | p.Phe434Val | p.F434V | O43167 | protein_coding | deleterious(0) | probably_damaging(0.996) | TCGA-AN-A046-01 | Breast | breast invasive carcinoma | Female | >=65 | I/II | Unknown | Unknown | SD |
| ZBTB24 | SNV | Missense_Mutation | c.1676C>A | p.Ser559Tyr | p.S559Y | O43167 | protein_coding | deleterious(0.01) | possibly_damaging(0.656) | TCGA-BH-A0DK-01 | Breast | breast invasive carcinoma | Female | <65 | I/II | Hormone Therapy | tamoxiphen | SD | |
| ZBTB24 | deletion | Frame_Shift_Del | c.151delC | p.His51ThrfsTer14 | p.H51Tfs*14 | O43167 | protein_coding | TCGA-BH-A1FN-01 | Breast | breast invasive carcinoma | Female | <65 | I/II | Unknown | Unknown | PD | |||
| ZBTB24 | SNV | Missense_Mutation | rs541870286 | c.485G>A | p.Arg162Gln | p.R162Q | O43167 | protein_coding | deleterious(0.01) | probably_damaging(0.978) | TCGA-2W-A8YY-01 | Cervix | cervical & endocervical cancer | Female | <65 | I/II | Chemotherapy | cisplatin | CR |
| ZBTB24 | SNV | Missense_Mutation | novel | c.767G>A | p.Arg256Gln | p.R256Q | O43167 | protein_coding | deleterious(0.01) | probably_damaging(0.978) | TCGA-EA-A410-01 | Cervix | cervical & endocervical cancer | Female | <65 | I/II | Unknown | Unknown | SD |
| ZBTB24 | SNV | Missense_Mutation | rs554644990 | c.1819N>A | p.Leu607Ile | p.L607I | O43167 | protein_coding | deleterious(0.01) | possibly_damaging(0.541) | TCGA-AA-A010-01 | Colorectum | colon adenocarcinoma | Female | <65 | I/II | Chemotherapy | folinic | CR |
| ZBTB24 | SNV | Missense_Mutation | c.842N>A | p.Arg281Lys | p.R281K | O43167 | protein_coding | tolerated(0.22) | benign(0.003) | TCGA-AA-A010-01 | Colorectum | colon adenocarcinoma | Female | <65 | I/II | Chemotherapy | folinic | CR | |
| ZBTB24 | SNV | Missense_Mutation | c.1470N>A | p.Phe490Leu | p.F490L | O43167 | protein_coding | deleterious(0.03) | probably_damaging(0.998) | TCGA-CA-6718-01 | Colorectum | colon adenocarcinoma | Male | <65 | I/II | Unknown | Unknown | PD |
| Page: 1 2 3 4 5 6 7 8 |
Top |
Related drugs of malignant transformation related genes |
| Identification of chemicals and drugs interact with genes involved in malignant transfromation |
| (DGIdb 4.0) |
| Entrez ID | Symbol | Category | Interaction Types | Drug Claim Name | Drug Name | PMIDs |
| Page: 1 |

Copyright 2023-Present -The University of Texas Health Science Center at Houston |