
|
|||||
|
 | |
| |
| |
| |
| |
| |
|
Gene: ZBTB17 |
Gene summary for ZBTB17 |
| Gene information | Species | Human | Gene symbol | ZBTB17 | Gene ID | 7709 |
| Gene name | zinc finger and BTB domain containing 17 | |
| Gene Alias | MIZ-1 | |
| Cytomap | 1p36.13 | |
| Gene Type | protein-coding | GO ID | GO:0000122 | UniProtAcc | Q13105 |
Top |
Malignant transformation analysis |
| Identification of the aberrant gene expression in precancerous and cancerous lesions by comparing the gene expression of stem-like cells in diseased tissues with normal stem cells |
| Entrez ID | Symbol | Replicates | Species | Organ | Tissue | Adj P-value | Log2FC | Malignancy |
| 7709 | ZBTB17 | LZE4T | Human | Esophagus | ESCC | 2.28e-05 | 1.62e-01 | 0.0811 |
| 7709 | ZBTB17 | LZE7T | Human | Esophagus | ESCC | 6.67e-09 | 3.36e-01 | 0.0667 |
| 7709 | ZBTB17 | LZE8T | Human | Esophagus | ESCC | 1.25e-03 | 2.13e-01 | 0.067 |
| 7709 | ZBTB17 | LZE24T | Human | Esophagus | ESCC | 9.79e-14 | 2.35e-01 | 0.0596 |
| 7709 | ZBTB17 | LZE6T | Human | Esophagus | ESCC | 2.90e-02 | 1.89e-01 | 0.0845 |
| 7709 | ZBTB17 | P1T-E | Human | Esophagus | ESCC | 7.46e-04 | 1.72e-01 | 0.0875 |
| 7709 | ZBTB17 | P2T-E | Human | Esophagus | ESCC | 1.49e-22 | 3.47e-01 | 0.1177 |
| 7709 | ZBTB17 | P4T-E | Human | Esophagus | ESCC | 8.96e-05 | 1.78e-01 | 0.1323 |
| 7709 | ZBTB17 | P5T-E | Human | Esophagus | ESCC | 3.95e-08 | 1.28e-01 | 0.1327 |
| 7709 | ZBTB17 | P8T-E | Human | Esophagus | ESCC | 2.90e-05 | 1.55e-01 | 0.0889 |
| 7709 | ZBTB17 | P9T-E | Human | Esophagus | ESCC | 2.95e-08 | 1.11e-01 | 0.1131 |
| 7709 | ZBTB17 | P10T-E | Human | Esophagus | ESCC | 2.08e-18 | 3.34e-01 | 0.116 |
| 7709 | ZBTB17 | P12T-E | Human | Esophagus | ESCC | 2.64e-11 | 2.06e-01 | 0.1122 |
| 7709 | ZBTB17 | P15T-E | Human | Esophagus | ESCC | 3.96e-19 | 2.27e-01 | 0.1149 |
| 7709 | ZBTB17 | P16T-E | Human | Esophagus | ESCC | 1.26e-15 | 1.66e-01 | 0.1153 |
| 7709 | ZBTB17 | P17T-E | Human | Esophagus | ESCC | 8.51e-08 | 3.27e-01 | 0.1278 |
| 7709 | ZBTB17 | P20T-E | Human | Esophagus | ESCC | 4.54e-16 | 2.13e-01 | 0.1124 |
| 7709 | ZBTB17 | P21T-E | Human | Esophagus | ESCC | 6.33e-15 | 3.74e-01 | 0.1617 |
| 7709 | ZBTB17 | P22T-E | Human | Esophagus | ESCC | 5.32e-07 | 1.09e-01 | 0.1236 |
| 7709 | ZBTB17 | P23T-E | Human | Esophagus | ESCC | 1.56e-09 | 2.11e-01 | 0.108 |
| Page: 1 2 3 4 |
| Tissue | Expression Dynamics | Abbreviation |
| Esophagus | 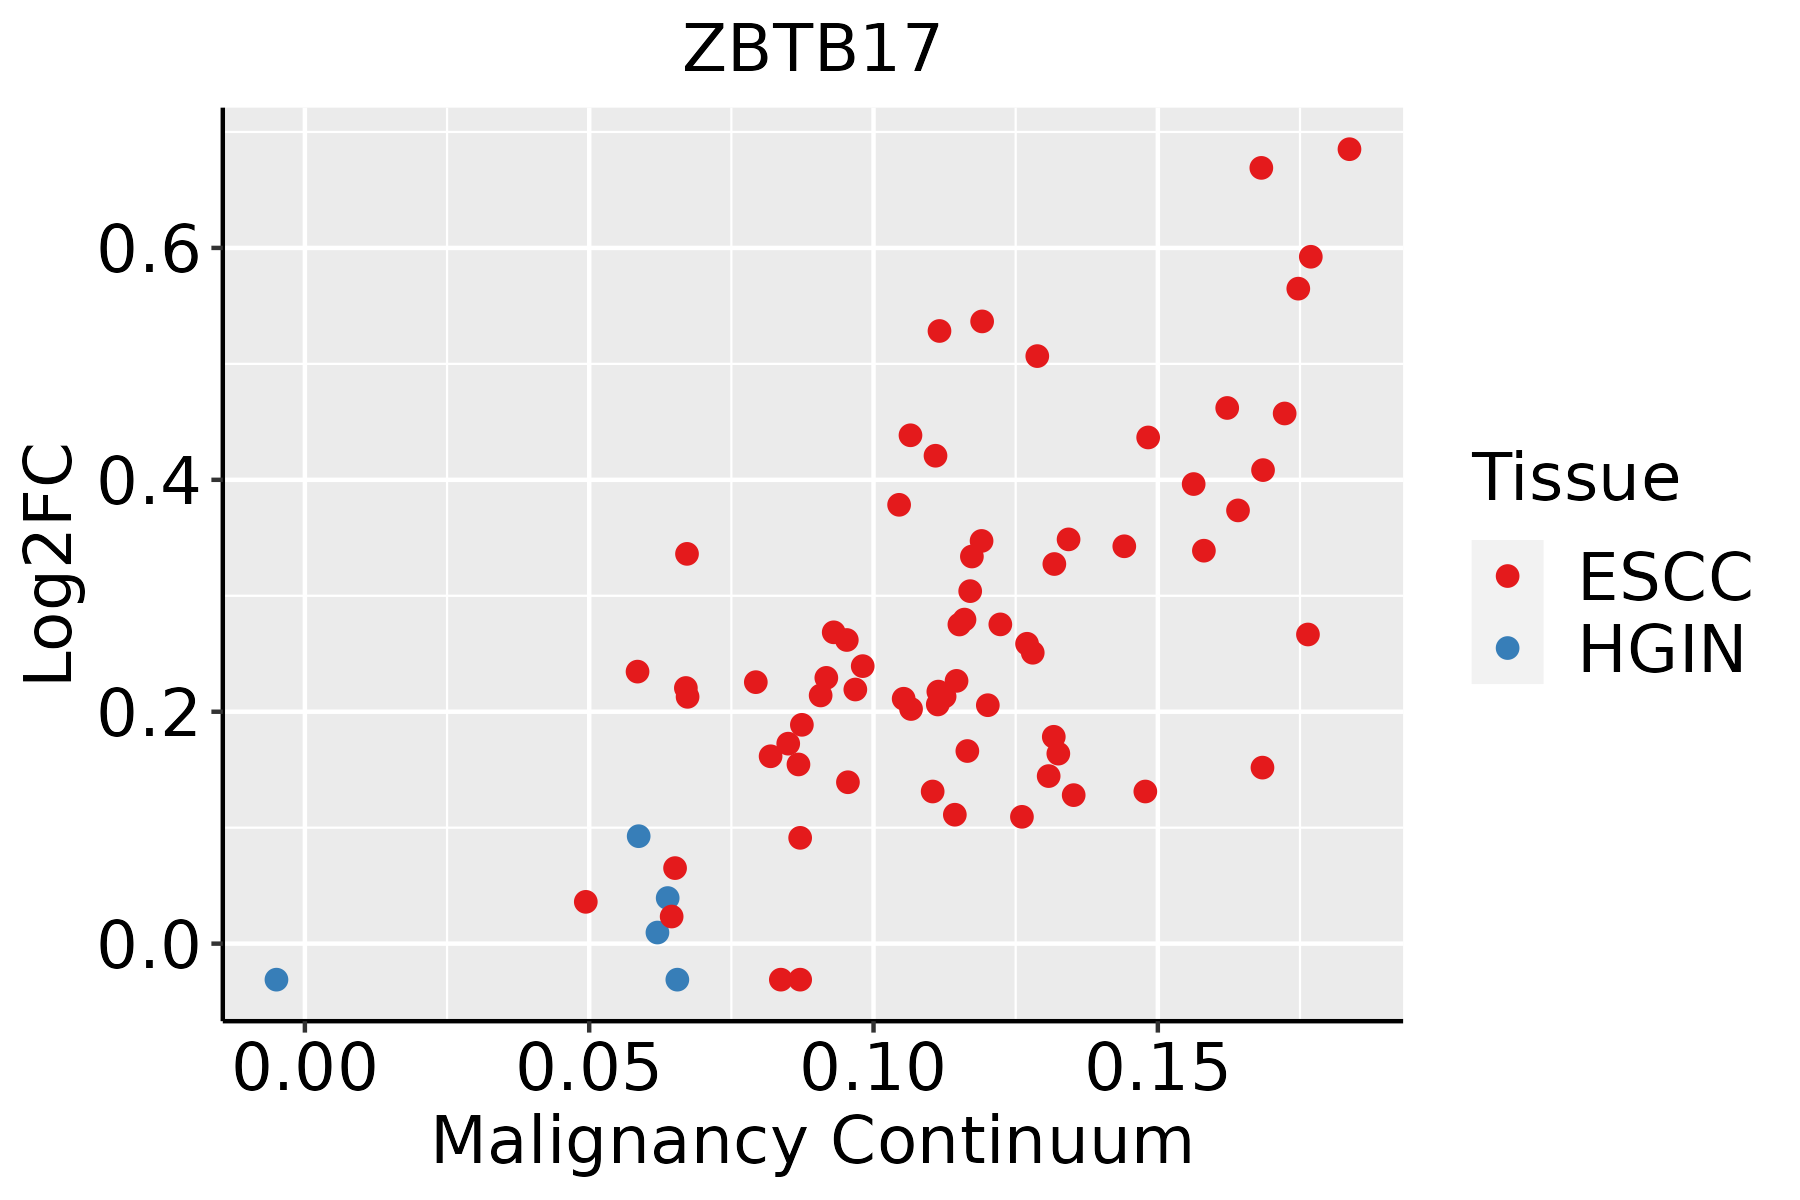 | ESCC: Esophageal squamous cell carcinoma |
| HGIN: High-grade intraepithelial neoplasias | ||
| LGIN: Low-grade intraepithelial neoplasias | ||
| Liver | 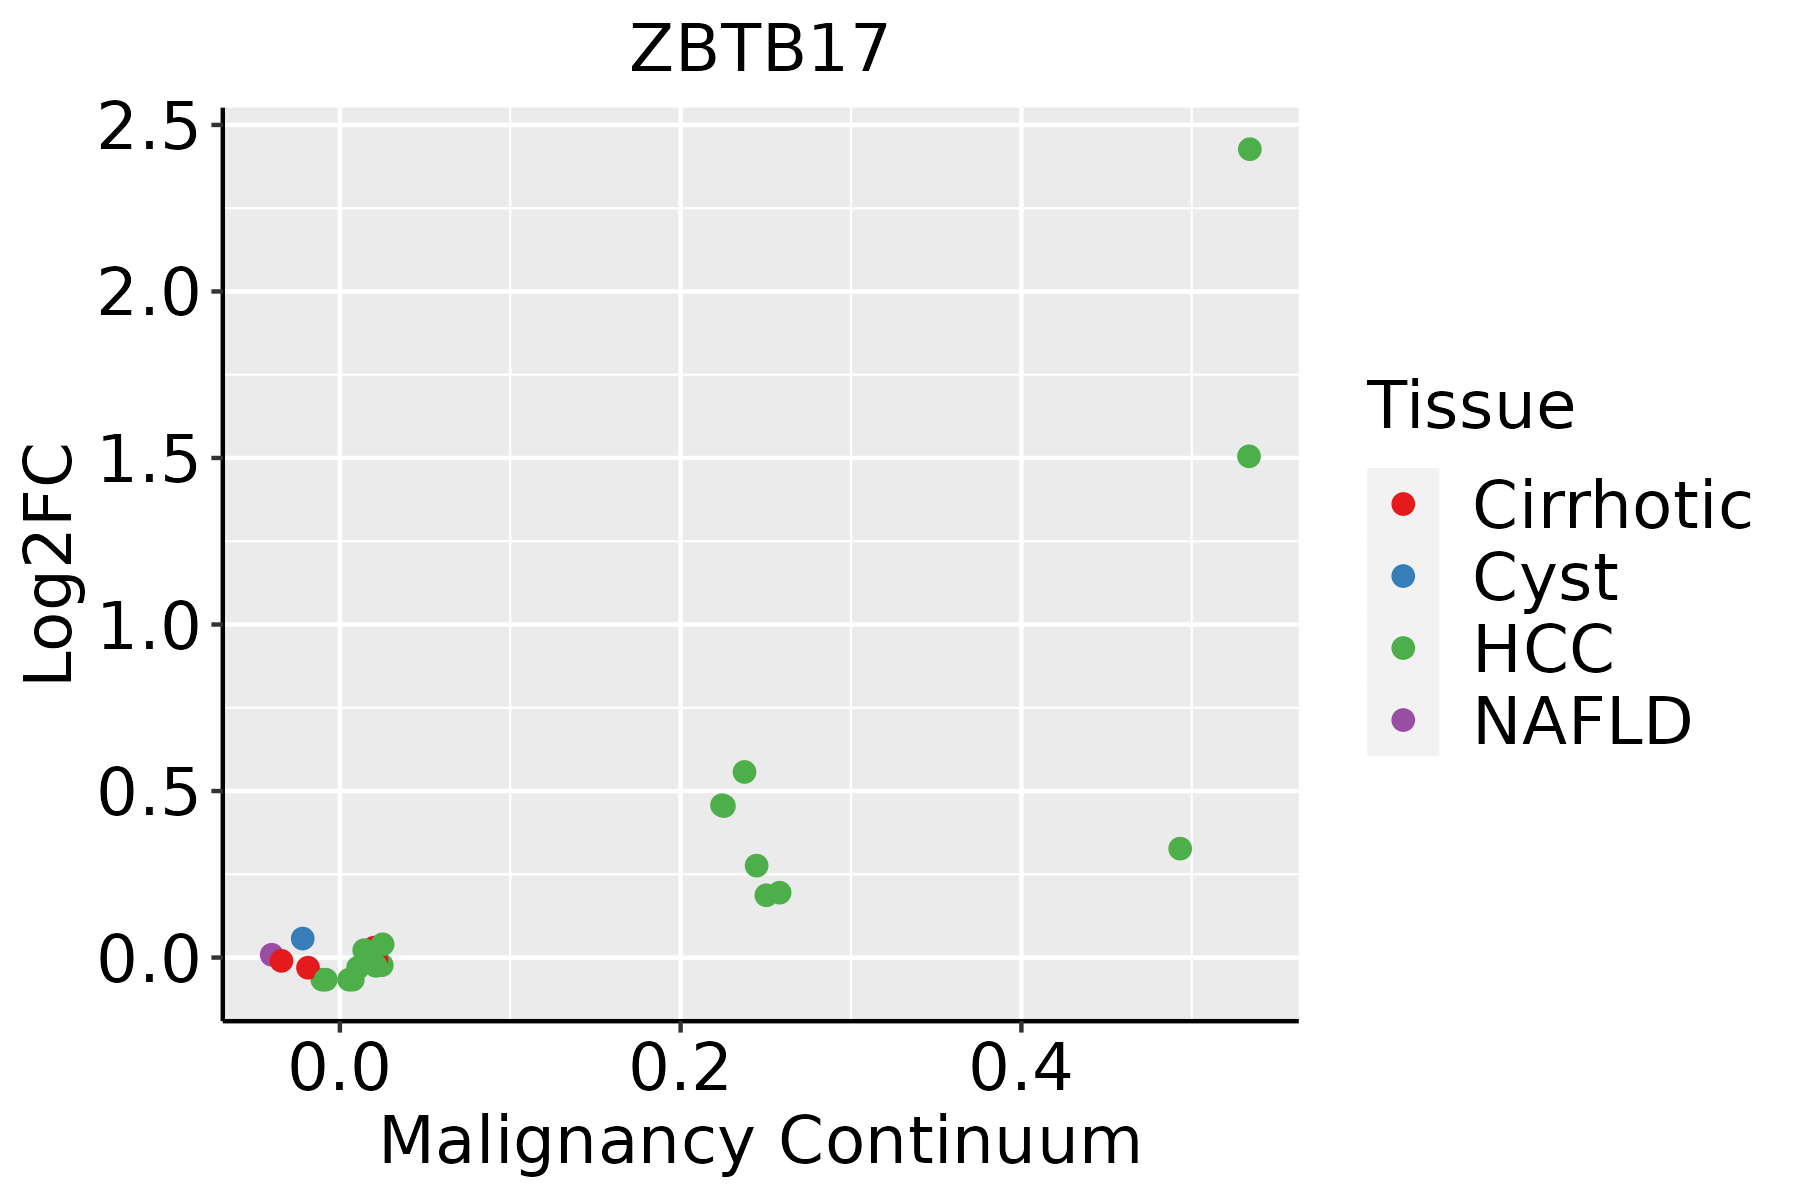 | HCC: Hepatocellular carcinoma |
| NAFLD: Non-alcoholic fatty liver disease | ||
| Oral Cavity | 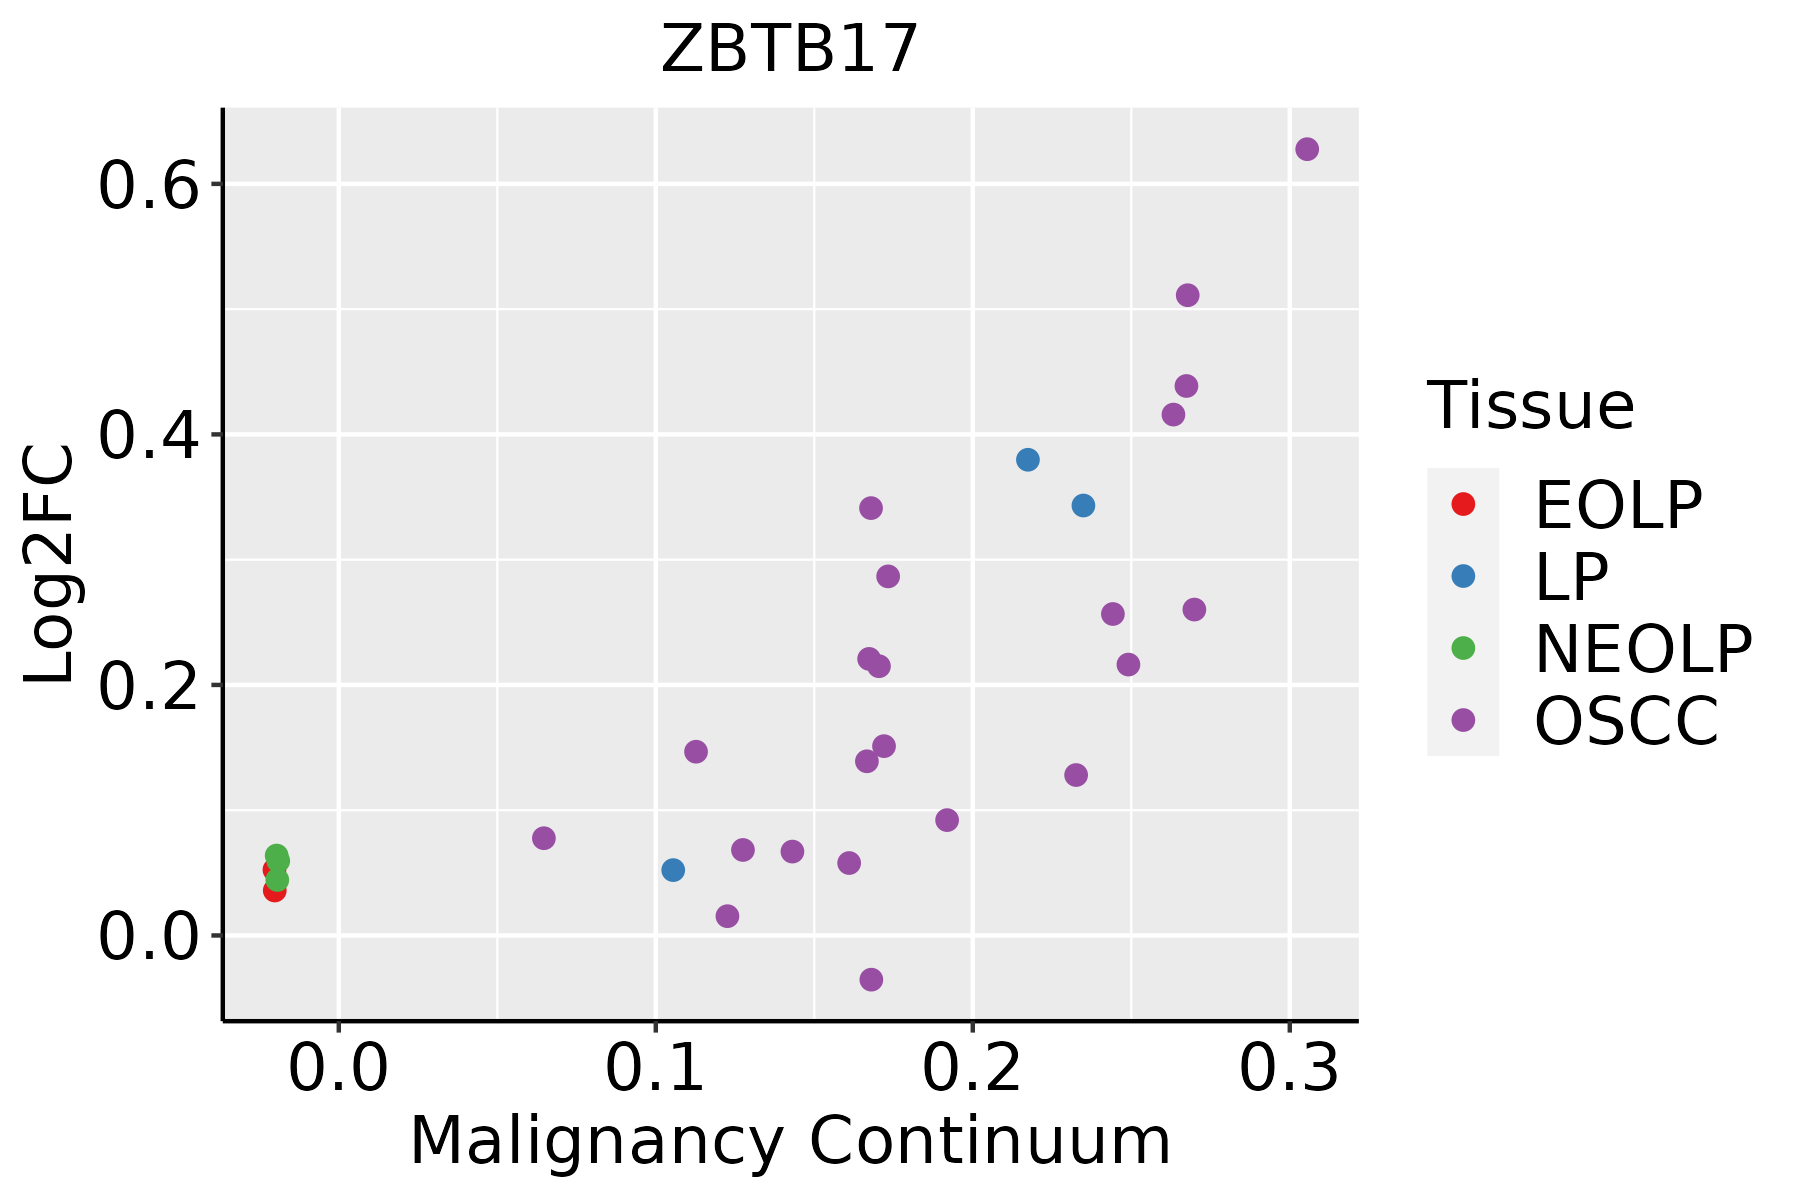 | EOLP: Erosive Oral lichen planus |
| LP: leukoplakia | ||
| NEOLP: Non-erosive oral lichen planus | ||
| OSCC: Oral squamous cell carcinoma |
| ∗log2FC in expression of this searched gene in stem-like cells from each diseased tissue sample relative to stem-like cells in normal samples in each tissue plotted against the malignancy continuum. Samples are colored based on if they are from different disease stage. |
Top |
Malignant transformation related pathway analysis |
| Find out the enriched GO biological processes and KEGG pathways involved in transition from healthy to precancer to cancer |
| Tissue | Disease Stage | Enriched GO biological Processes |
| Colorectum | AD |  |
| Colorectum | SER |  |
| Colorectum | MSS |  |
| Colorectum | MSI-H |  |
| Colorectum | FAP |  |
| ∗Top 15 enriched GO BP terms are showed in the bar plot of each disease state in each tissue. Each row represents a significant GO biological process which is colored according to the -log10(p.adjust). |
| Page: 1 2 3 4 5 6 7 8 9 |
| GO ID | Tissue | Disease Stage | Description | Gene Ratio | Bg Ratio | pvalue | p.adjust | Count |
| GO:00457865 | Esophagus | ESCC | negative regulation of cell cycle | 236/8552 | 385/18723 | 3.62e-10 | 9.93e-09 | 236 |
| GO:00073698 | Esophagus | ESCC | gastrulation | 115/8552 | 185/18723 | 4.35e-06 | 4.64e-05 | 115 |
| GO:0045786 | Liver | HCC | negative regulation of cell cycle | 204/7958 | 385/18723 | 1.84e-05 | 1.99e-04 | 204 |
| GO:00457864 | Oral cavity | OSCC | negative regulation of cell cycle | 206/7305 | 385/18723 | 4.28e-09 | 9.55e-08 | 206 |
| GO:00073697 | Oral cavity | OSCC | gastrulation | 95/7305 | 185/18723 | 4.17e-04 | 2.54e-03 | 95 |
| Page: 1 |
| Pathway ID | Tissue | Disease Stage | Description | Gene Ratio | Bg Ratio | pvalue | p.adjust | qvalue | Count |
| hsa0411023 | Esophagus | ESCC | Cell cycle | 126/4205 | 157/8465 | 1.34e-15 | 5.60e-14 | 2.87e-14 | 126 |
| hsa052229 | Esophagus | ESCC | Small cell lung cancer | 69/4205 | 92/8465 | 5.40e-07 | 3.85e-06 | 1.97e-06 | 69 |
| hsa052028 | Esophagus | ESCC | Transcriptional misregulation in cancer | 116/4205 | 193/8465 | 2.08e-03 | 5.95e-03 | 3.05e-03 | 116 |
| hsa0411033 | Esophagus | ESCC | Cell cycle | 126/4205 | 157/8465 | 1.34e-15 | 5.60e-14 | 2.87e-14 | 126 |
| hsa0522216 | Esophagus | ESCC | Small cell lung cancer | 69/4205 | 92/8465 | 5.40e-07 | 3.85e-06 | 1.97e-06 | 69 |
| hsa0520213 | Esophagus | ESCC | Transcriptional misregulation in cancer | 116/4205 | 193/8465 | 2.08e-03 | 5.95e-03 | 3.05e-03 | 116 |
| hsa041102 | Liver | HCC | Cell cycle | 106/4020 | 157/8465 | 2.54e-07 | 3.04e-06 | 1.69e-06 | 106 |
| hsa052224 | Liver | HCC | Small cell lung cancer | 57/4020 | 92/8465 | 3.54e-03 | 1.12e-02 | 6.22e-03 | 57 |
| hsa041103 | Liver | HCC | Cell cycle | 106/4020 | 157/8465 | 2.54e-07 | 3.04e-06 | 1.69e-06 | 106 |
| hsa0522211 | Liver | HCC | Small cell lung cancer | 57/4020 | 92/8465 | 3.54e-03 | 1.12e-02 | 6.22e-03 | 57 |
| hsa041108 | Oral cavity | OSCC | Cell cycle | 118/3704 | 157/8465 | 7.15e-16 | 2.66e-14 | 1.35e-14 | 118 |
| hsa052228 | Oral cavity | OSCC | Small cell lung cancer | 66/3704 | 92/8465 | 4.43e-08 | 3.38e-07 | 1.72e-07 | 66 |
| hsa0411015 | Oral cavity | OSCC | Cell cycle | 118/3704 | 157/8465 | 7.15e-16 | 2.66e-14 | 1.35e-14 | 118 |
| hsa0522215 | Oral cavity | OSCC | Small cell lung cancer | 66/3704 | 92/8465 | 4.43e-08 | 3.38e-07 | 1.72e-07 | 66 |
| Page: 1 |
Top |
Cell-cell communication analysis |
| Identification of potential cell-cell interactions between two cell types and their ligand-receptor pairs for different disease states |
| Ligand | Receptor | LRpair | Pathway | Tissue | Disease Stage |
| Page: 1 |
Top |
Single-cell gene regulatory network inference analysis |
| Find out the significant the regulons (TFs) and the target genes of each regulon across cell types for different disease states |
| TF | Cell Type | Tissue | Disease Stage | Target Gene | RSS | Regulon Activity |
| ZBTB17 | CD8TCM | Breast | Healthy | PDGFA,ABCE1,GEN1, etc. | 1.72e-01 |  |
| ZBTB17 | ICAF | Cervix | ADJ | IGLL5,PPP1R3C,IL17D, etc. | 6.33e-02 |  |
| ZBTB17 | MON | Colorectum | AD | RHOBTB3,FAM120C,CDK5R1, etc. | 1.07e-01 |  |
| ZBTB17 | GC | Colorectum | ADJ | RHOBTB3,FAM120C,CDK5R1, etc. | 2.73e-01 |  |
| ZBTB17 | ILC | Colorectum | ADJ | RHOBTB3,FAM120C,CDK5R1, etc. | 1.04e-02 | |
| ZBTB17 | GC | Colorectum | CRC | RHOBTB3,FAM120C,CDK5R1, etc. | 6.41e-02 |  |
| ZBTB17 | MAST | Colorectum | CRC | RHOBTB3,FAM120C,CDK5R1, etc. | 3.57e-02 | |
| ZBTB17 | GC | Colorectum | FAP | RHOBTB3,FAM120C,CDK5R1, etc. | 1.40e-01 |  |
| ZBTB17 | MON | Colorectum | FAP | RHOBTB3,FAM120C,CDK5R1, etc. | 2.40e-02 | |
| ZBTB17 | CD8TCM | Colorectum | FAP | RHOBTB3,FAM120C,CDK5R1, etc. | 4.54e-02 | |
| ∗The dot plots of a searched regulon are shown for all cell subpopulations in each disease state of each tissue based on the regulon specific score inferred using pySCENIC and by calculating the average expression. |
| Page: 1 2 |
Top |
Somatic mutation of malignant transformation related genes |
| Annotation of somatic variants for genes involved in malignant transformation |
| Hugo Symbol | Variant Class | Variant Classification | dbSNP RS | HGVSc | HGVSp | HGVSp Short | SWISSPROT | BIOTYPE | SIFT | PolyPhen | Tumor Sample Barcode | Tissue | Histology | Sex | Age | Stage | Therapy Types | Drugs | Outcome |
| ZBTB17 | SNV | Missense_Mutation | c.1879G>C | p.Asp627His | p.D627H | Q13105 | protein_coding | deleterious(0.01) | probably_damaging(0.999) | TCGA-AC-A23H-01 | Breast | breast invasive carcinoma | Female | >=65 | I/II | Unknown | Unknown | PD | |
| ZBTB17 | SNV | Missense_Mutation | rs749217418 | c.1093G>A | p.Glu365Lys | p.E365K | Q13105 | protein_coding | tolerated(0.14) | possibly_damaging(0.848) | TCGA-AC-A23H-01 | Breast | breast invasive carcinoma | Female | >=65 | I/II | Unknown | Unknown | PD |
| ZBTB17 | SNV | Missense_Mutation | c.590T>G | p.Leu197Arg | p.L197R | Q13105 | protein_coding | tolerated_low_confidence(0.36) | benign(0.246) | TCGA-AR-A0TV-01 | Breast | breast invasive carcinoma | Female | >=65 | I/II | Unknown | Unknown | SD | |
| ZBTB17 | insertion | In_Frame_Ins | novel | c.2071_2072insCTGCTTTGCCCCAAGTTGAGGAGTGGGCAGTACACTCAGGCTGGA | p.Gly691delinsAlaAlaLeuProGlnValGluGluTrpAlaValHisSerGlyTrpArg | p.G691delinsAALPQVEEWAVHSGWR | Q13105 | protein_coding | TCGA-BH-A0B1-01 | Breast | breast invasive carcinoma | Female | >=65 | I/II | Chemotherapy | adriamycin | SD | ||
| ZBTB17 | SNV | Missense_Mutation | rs369859088 | c.200C>T | p.Ala67Val | p.A67V | Q13105 | protein_coding | deleterious_low_confidence(0.02) | benign(0.029) | TCGA-2W-A8YY-01 | Cervix | cervical & endocervical cancer | Female | <65 | I/II | Chemotherapy | cisplatin | CR |
| ZBTB17 | SNV | Missense_Mutation | rs762057725 | c.2231G>A | p.Arg744Gln | p.R744Q | Q13105 | protein_coding | deleterious(0.01) | possibly_damaging(0.56) | TCGA-EA-A1QS-01 | Cervix | cervical & endocervical cancer | Female | <65 | I/II | Unknown | Unknown | SD |
| ZBTB17 | SNV | Missense_Mutation | c.502N>C | p.Glu168Gln | p.E168Q | Q13105 | protein_coding | tolerated_low_confidence(0.14) | benign(0.015) | TCGA-IR-A3LH-01 | Cervix | cervical & endocervical cancer | Female | <65 | I/II | Chemotherapy | cisplatin | CR | |
| ZBTB17 | SNV | Missense_Mutation | c.1299G>C | p.Lys433Asn | p.K433N | Q13105 | protein_coding | deleterious(0.03) | probably_damaging(0.996) | TCGA-Q1-A73O-01 | Cervix | cervical & endocervical cancer | Female | <65 | I/II | Chemotherapy | cisplatin | CR | |
| ZBTB17 | SNV | Missense_Mutation | c.4G>T | p.Asp2Tyr | p.D2Y | Q13105 | protein_coding | deleterious_low_confidence(0) | probably_damaging(0.965) | TCGA-Q1-A73O-01 | Cervix | cervical & endocervical cancer | Female | <65 | I/II | Chemotherapy | cisplatin | CR | |
| ZBTB17 | insertion | Frame_Shift_Ins | novel | c.998_999insG | p.Phe334LeufsTer20 | p.F334Lfs*20 | Q13105 | protein_coding | TCGA-DS-A1OB-01 | Cervix | cervical & endocervical cancer | Female | <65 | I/II | Chemotherapy | carboplatin | PD |
| Page: 1 2 3 4 5 6 |
Top |
Related drugs of malignant transformation related genes |
| Identification of chemicals and drugs interact with genes involved in malignant transfromation |
| (DGIdb 4.0) |
| Entrez ID | Symbol | Category | Interaction Types | Drug Claim Name | Drug Name | PMIDs |
| Page: 1 |

Copyright 2023-Present -The University of Texas Health Science Center at Houston |