| Tissue | Expression Dynamics | Abbreviation |
| Colorectum (GSE201348) |  | FAP: Familial adenomatous polyposis |
| CRC: Colorectal cancer |
| Colorectum (HTA11) |  | AD: Adenomas |
| SER: Sessile serrated lesions |
| MSI-H: Microsatellite-high colorectal cancer |
| MSS: Microsatellite stable colorectal cancer |
| Liver | 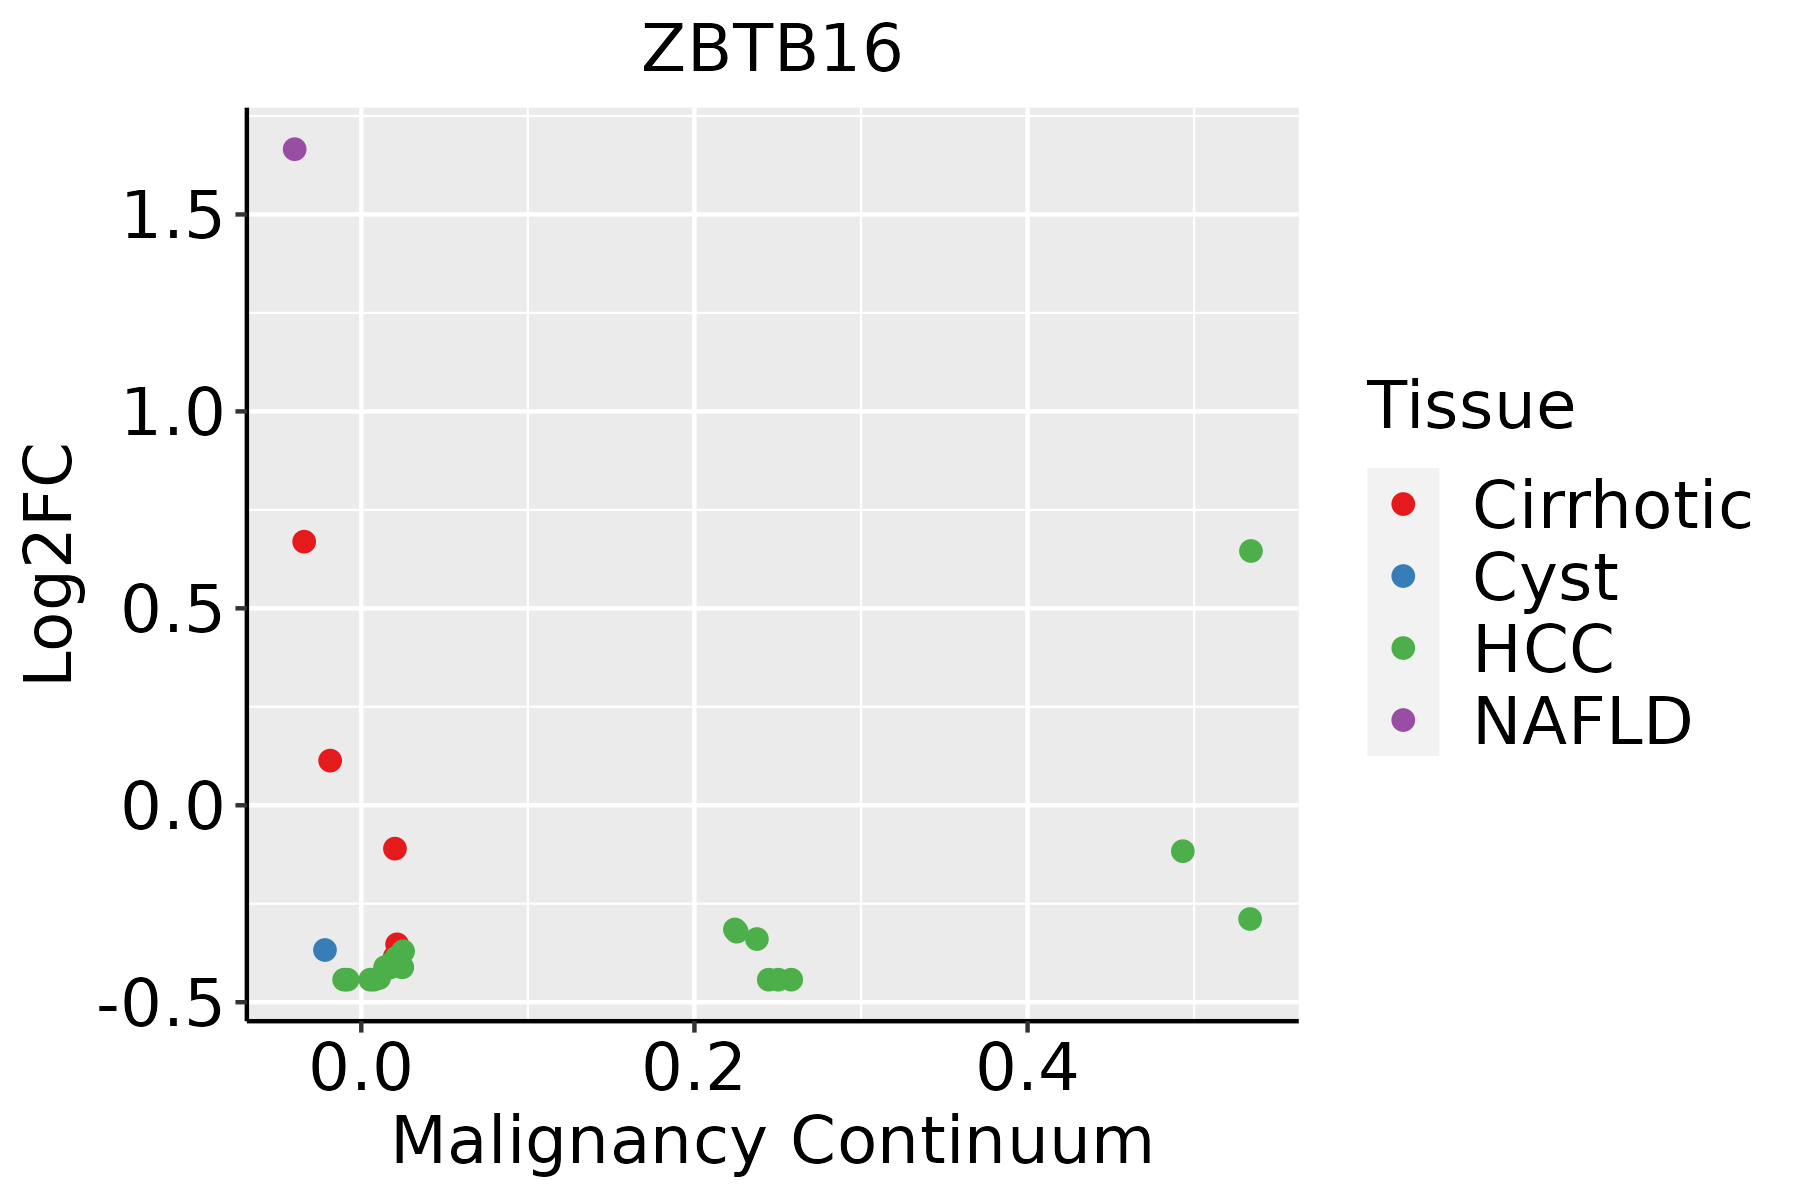 | HCC: Hepatocellular carcinoma |
| NAFLD: Non-alcoholic fatty liver disease |
| Lung |  | AAH: Atypical adenomatous hyperplasia |
| AIS: Adenocarcinoma in situ |
| IAC: Invasive lung adenocarcinoma |
| MIA: Minimally invasive adenocarcinoma |
| Prostate |  | BPH: Benign Prostatic Hyperplasia |
| Thyroid | 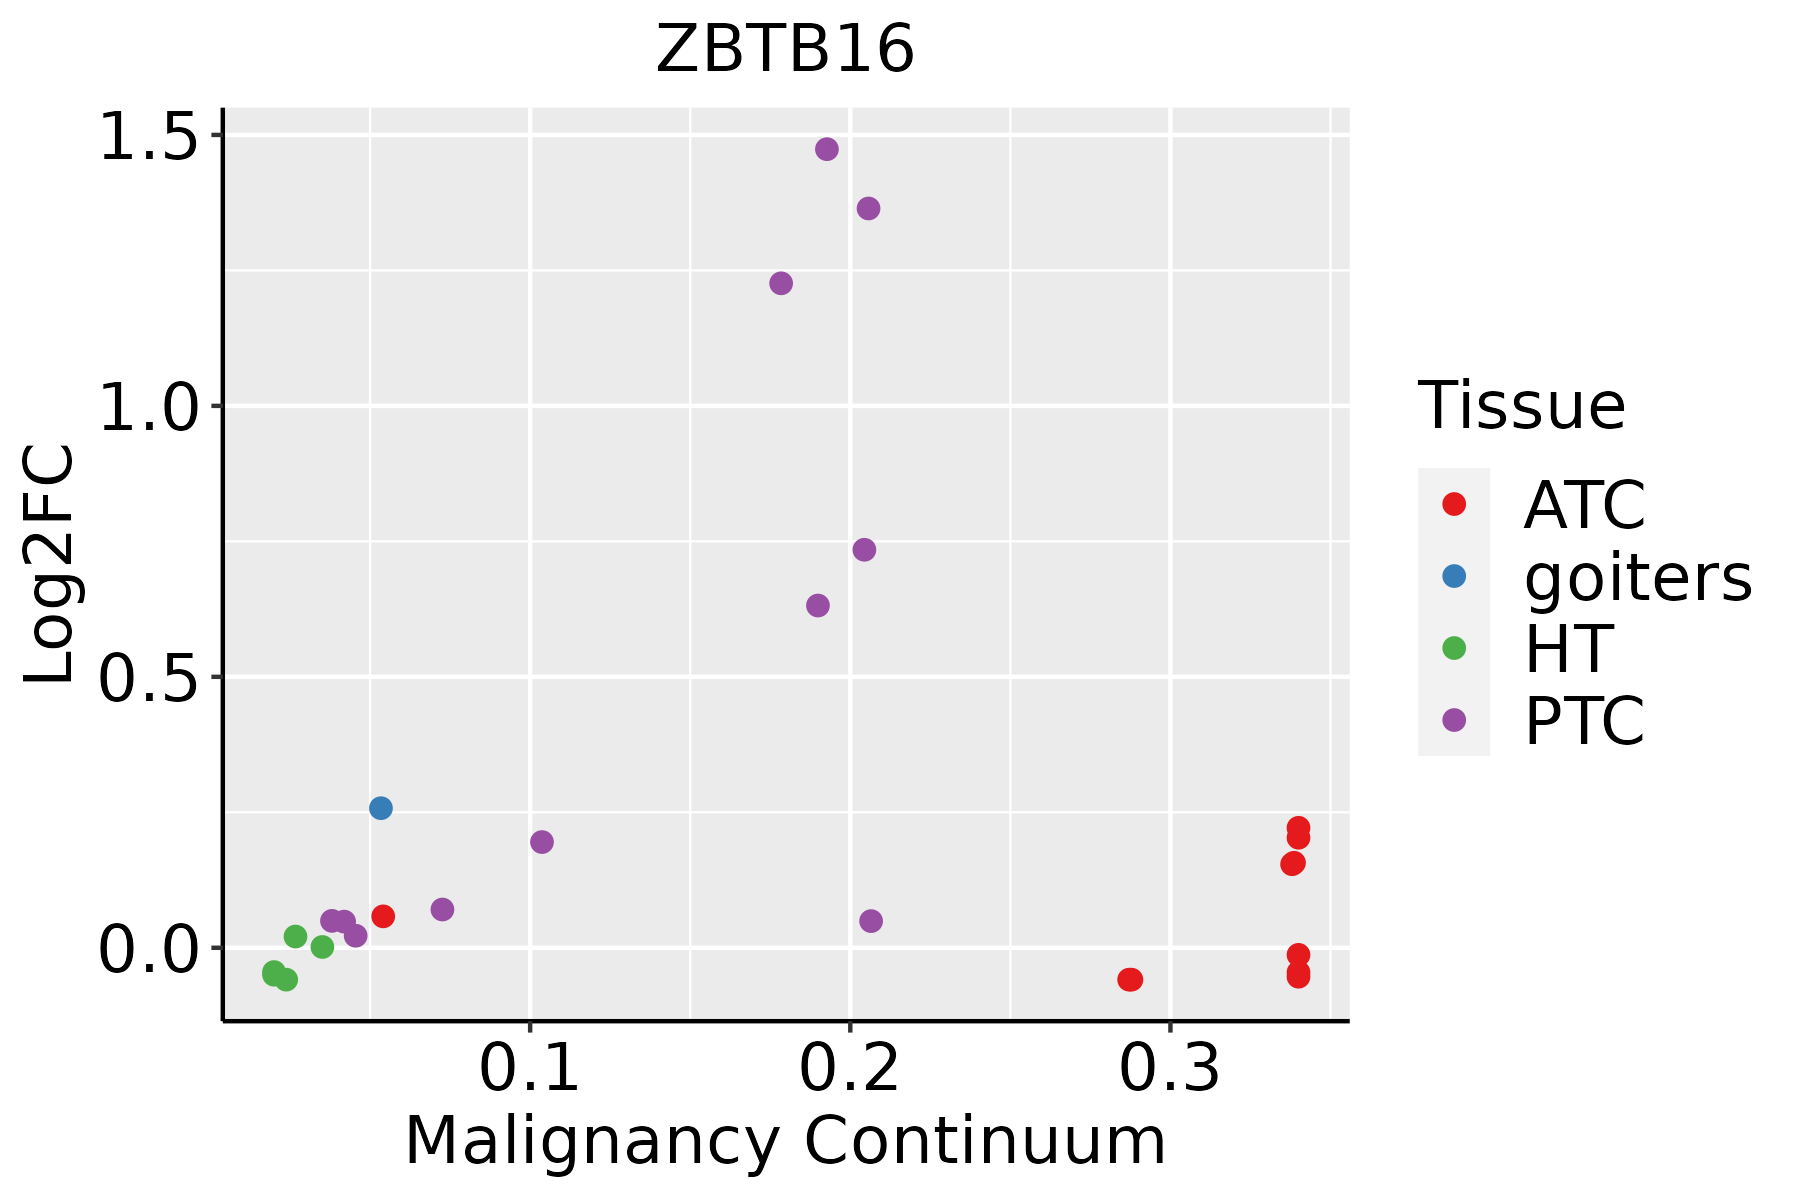 | ATC: Anaplastic thyroid cancer |
| HT: Hashimoto's thyroiditis |
| PTC: Papillary thyroid cancer |
| GO ID | Tissue | Disease Stage | Description | Gene Ratio | Bg Ratio | pvalue | p.adjust | Count |
| GO:0030099 | Colorectum | AD | myeloid cell differentiation | 119/3918 | 381/18723 | 1.24e-06 | 4.01e-05 | 119 |
| GO:0034504 | Colorectum | AD | protein localization to nucleus | 94/3918 | 290/18723 | 2.83e-06 | 8.09e-05 | 94 |
| GO:0045785 | Colorectum | AD | positive regulation of cell adhesion | 122/3918 | 437/18723 | 2.65e-04 | 3.28e-03 | 122 |
| GO:1903706 | Colorectum | AD | regulation of hemopoiesis | 99/3918 | 367/18723 | 3.08e-03 | 2.28e-02 | 99 |
| GO:0045637 | Colorectum | AD | regulation of myeloid cell differentiation | 61/3918 | 210/18723 | 3.17e-03 | 2.35e-02 | 61 |
| GO:0048736 | Colorectum | AD | appendage development | 51/3918 | 172/18723 | 4.20e-03 | 2.89e-02 | 51 |
| GO:0060173 | Colorectum | AD | limb development | 51/3918 | 172/18723 | 4.20e-03 | 2.89e-02 | 51 |
| GO:0001503 | Colorectum | AD | ossification | 106/3918 | 408/18723 | 7.68e-03 | 4.64e-02 | 106 |
| GO:0001865 | Colorectum | AD | NK T cell differentiation | 6/3918 | 10/18723 | 8.03e-03 | 4.73e-02 | 6 |
| GO:00345041 | Colorectum | SER | protein localization to nucleus | 74/2897 | 290/18723 | 5.74e-06 | 2.05e-04 | 74 |
| GO:00457851 | Colorectum | SER | positive regulation of cell adhesion | 93/2897 | 437/18723 | 6.78e-04 | 9.04e-03 | 93 |
| GO:00487361 | Colorectum | SER | appendage development | 42/2897 | 172/18723 | 1.43e-03 | 1.55e-02 | 42 |
| GO:00601731 | Colorectum | SER | limb development | 42/2897 | 172/18723 | 1.43e-03 | 1.55e-02 | 42 |
| GO:00300991 | Colorectum | SER | myeloid cell differentiation | 80/2897 | 381/18723 | 2.28e-03 | 2.18e-02 | 80 |
| GO:0045444 | Colorectum | SER | fat cell differentiation | 51/2897 | 229/18723 | 3.96e-03 | 3.26e-02 | 51 |
| GO:0045600 | Colorectum | SER | positive regulation of fat cell differentiation | 19/2897 | 66/18723 | 4.29e-03 | 3.45e-02 | 19 |
| GO:0035107 | Colorectum | SER | appendage morphogenesis | 33/2897 | 138/18723 | 6.10e-03 | 4.42e-02 | 33 |
| GO:0035108 | Colorectum | SER | limb morphogenesis | 33/2897 | 138/18723 | 6.10e-03 | 4.42e-02 | 33 |
| GO:00015031 | Colorectum | SER | ossification | 82/2897 | 408/18723 | 6.76e-03 | 4.78e-02 | 82 |
| GO:00345042 | Colorectum | MSS | protein localization to nucleus | 92/3467 | 290/18723 | 3.66e-08 | 1.98e-06 | 92 |
| Pathway ID | Tissue | Disease Stage | Description | Gene Ratio | Bg Ratio | pvalue | p.adjust | qvalue | Count |
| hsa05202 | Colorectum | FAP | Transcriptional misregulation in cancer | 45/1404 | 193/8465 | 9.19e-03 | 3.33e-02 | 2.03e-02 | 45 |
| hsa052021 | Colorectum | FAP | Transcriptional misregulation in cancer | 45/1404 | 193/8465 | 9.19e-03 | 3.33e-02 | 2.03e-02 | 45 |
| hsa052026 | Lung | IAC | Transcriptional misregulation in cancer | 40/1053 | 193/8465 | 6.90e-04 | 5.90e-03 | 3.92e-03 | 40 |
| hsa0520211 | Lung | IAC | Transcriptional misregulation in cancer | 40/1053 | 193/8465 | 6.90e-04 | 5.90e-03 | 3.92e-03 | 40 |
| hsa052022 | Lung | AIS | Transcriptional misregulation in cancer | 39/961 | 193/8465 | 2.15e-04 | 2.41e-03 | 1.54e-03 | 39 |
| hsa052023 | Lung | AIS | Transcriptional misregulation in cancer | 39/961 | 193/8465 | 2.15e-04 | 2.41e-03 | 1.54e-03 | 39 |
| hsa052024 | Lung | MIAC | Transcriptional misregulation in cancer | 22/507 | 193/8465 | 2.64e-03 | 2.26e-02 | 1.64e-02 | 22 |
| hsa052025 | Lung | MIAC | Transcriptional misregulation in cancer | 22/507 | 193/8465 | 2.64e-03 | 2.26e-02 | 1.64e-02 | 22 |
| hsa052027 | Prostate | BPH | Transcriptional misregulation in cancer | 53/1718 | 193/8465 | 9.56e-03 | 2.92e-02 | 1.81e-02 | 53 |
| hsa0520212 | Prostate | BPH | Transcriptional misregulation in cancer | 53/1718 | 193/8465 | 9.56e-03 | 2.92e-02 | 1.81e-02 | 53 |
| hsa0520221 | Prostate | Tumor | Transcriptional misregulation in cancer | 59/1791 | 193/8465 | 1.22e-03 | 5.26e-03 | 3.26e-03 | 59 |
| hsa0520231 | Prostate | Tumor | Transcriptional misregulation in cancer | 59/1791 | 193/8465 | 1.22e-03 | 5.26e-03 | 3.26e-03 | 59 |
| Hugo Symbol | Variant Class | Variant Classification | dbSNP RS | HGVSc | HGVSp | HGVSp Short | SWISSPROT | BIOTYPE | SIFT | PolyPhen | Tumor Sample Barcode | Tissue | Histology | Sex | Age | Stage | Therapy Types | Drugs | Outcome |
| ZBTB16 | SNV | Missense_Mutation | | c.701G>T | p.Arg234Leu | p.R234L | Q05516 | protein_coding | tolerated(0.71) | benign(0.007) | TCGA-A2-A25A-01 | Breast | breast invasive carcinoma | Female | <65 | I/II | Unspecific | Cytoxan | SD |
| ZBTB16 | SNV | Missense_Mutation | rs779712380 | c.1234G>A | p.Glu412Lys | p.E412K | Q05516 | protein_coding | tolerated(0.19) | benign(0.089) | TCGA-A8-A06Q-01 | Breast | breast invasive carcinoma | Female | <65 | III/IV | Unknown | Unknown | SD |
| ZBTB16 | SNV | Missense_Mutation | | c.1009N>G | p.Leu337Val | p.L337V | Q05516 | protein_coding | tolerated(0.53) | benign(0.05) | TCGA-A8-A09I-01 | Breast | breast invasive carcinoma | Female | >=65 | I/II | Hormone Therapy | anastrozole | SD |
| ZBTB16 | SNV | Missense_Mutation | | c.272N>T | p.Thr91Met | p.T91M | Q05516 | protein_coding | deleterious(0) | probably_damaging(0.933) | TCGA-C8-A12T-01 | Breast | breast invasive carcinoma | Female | <65 | I/II | Unknown | Unknown | SD |
| ZBTB16 | SNV | Missense_Mutation | novel | c.363N>T | p.Met121Ile | p.M121I | Q05516 | protein_coding | tolerated(1) | benign(0) | TCGA-UU-A93S-01 | Breast | breast invasive carcinoma | Female | <65 | III/IV | Unknown | Unknown | PD |
| ZBTB16 | insertion | Frame_Shift_Ins | novel | c.1567_1568insTGATCAATGTCTATCCTTTA | p.Cys523LeufsTer102 | p.C523Lfs*102 | Q05516 | protein_coding | | | TCGA-B6-A0IC-01 | Breast | breast invasive carcinoma | Female | >=65 | I/II | Unknown | Unknown | SD |
| ZBTB16 | SNV | Missense_Mutation | rs747010083 | c.1337N>A | p.Arg446Gln | p.R446Q | Q05516 | protein_coding | deleterious(0) | probably_damaging(0.988) | TCGA-2W-A8YY-01 | Cervix | cervical & endocervical cancer | Female | <65 | I/II | Chemotherapy | cisplatin | CR |
| ZBTB16 | SNV | Missense_Mutation | novel | c.901N>A | p.Glu301Lys | p.E301K | Q05516 | protein_coding | tolerated(0.12) | benign(0.037) | TCGA-C5-A7CG-01 | Cervix | cervical & endocervical cancer | Female | <65 | I/II | Unknown | Unknown | SD |
| ZBTB16 | SNV | Missense_Mutation | novel | c.765C>A | p.Asp255Glu | p.D255E | Q05516 | protein_coding | tolerated(1) | benign(0) | TCGA-C5-A8YQ-01 | Cervix | cervical & endocervical cancer | Female | >=65 | I/II | Chemotherapy | cisplatin | PD |
| ZBTB16 | SNV | Missense_Mutation | | c.995N>T | p.Gly332Val | p.G332V | Q05516 | protein_coding | tolerated(0.06) | benign(0.154) | TCGA-EK-A2PM-01 | Cervix | cervical & endocervical cancer | Female | >=65 | I/II | Unknown | Unknown | SD |


