
|
|||||
|
 | |
| |
| |
| |
| |
| |
|
Gene: ZBTB11 |
Gene summary for ZBTB11 |
| Gene information | Species | Human | Gene symbol | ZBTB11 | Gene ID | 27107 |
| Gene name | zinc finger and BTB domain containing 11 | |
| Gene Alias | MRT69 | |
| Cytomap | 3q12.3 | |
| Gene Type | protein-coding | GO ID | GO:0006139 | UniProtAcc | O95625 |
Top |
Malignant transformation analysis |
| Identification of the aberrant gene expression in precancerous and cancerous lesions by comparing the gene expression of stem-like cells in diseased tissues with normal stem cells |
| Entrez ID | Symbol | Replicates | Species | Organ | Tissue | Adj P-value | Log2FC | Malignancy |
| 27107 | ZBTB11 | LZE2T | Human | Esophagus | ESCC | 3.24e-03 | 3.03e-01 | 0.082 |
| 27107 | ZBTB11 | LZE4T | Human | Esophagus | ESCC | 3.12e-12 | 3.11e-01 | 0.0811 |
| 27107 | ZBTB11 | LZE7T | Human | Esophagus | ESCC | 2.01e-02 | 6.83e-02 | 0.0667 |
| 27107 | ZBTB11 | LZE8T | Human | Esophagus | ESCC | 1.89e-06 | 3.75e-02 | 0.067 |
| 27107 | ZBTB11 | LZE20T | Human | Esophagus | ESCC | 5.58e-06 | 7.70e-02 | 0.0662 |
| 27107 | ZBTB11 | LZE22T | Human | Esophagus | ESCC | 4.94e-03 | 2.00e-01 | 0.068 |
| 27107 | ZBTB11 | LZE24T | Human | Esophagus | ESCC | 3.21e-11 | 2.22e-01 | 0.0596 |
| 27107 | ZBTB11 | P1T-E | Human | Esophagus | ESCC | 1.67e-03 | 2.36e-01 | 0.0875 |
| 27107 | ZBTB11 | P2T-E | Human | Esophagus | ESCC | 6.57e-19 | 3.97e-01 | 0.1177 |
| 27107 | ZBTB11 | P4T-E | Human | Esophagus | ESCC | 4.58e-14 | 2.58e-01 | 0.1323 |
| 27107 | ZBTB11 | P5T-E | Human | Esophagus | ESCC | 5.99e-18 | 4.11e-01 | 0.1327 |
| 27107 | ZBTB11 | P8T-E | Human | Esophagus | ESCC | 1.95e-18 | 3.15e-01 | 0.0889 |
| 27107 | ZBTB11 | P9T-E | Human | Esophagus | ESCC | 2.82e-15 | 2.22e-01 | 0.1131 |
| 27107 | ZBTB11 | P10T-E | Human | Esophagus | ESCC | 5.49e-21 | 3.27e-01 | 0.116 |
| 27107 | ZBTB11 | P11T-E | Human | Esophagus | ESCC | 2.71e-02 | 2.26e-01 | 0.1426 |
| 27107 | ZBTB11 | P12T-E | Human | Esophagus | ESCC | 7.67e-15 | 1.16e-01 | 0.1122 |
| 27107 | ZBTB11 | P15T-E | Human | Esophagus | ESCC | 1.23e-12 | 2.99e-01 | 0.1149 |
| 27107 | ZBTB11 | P16T-E | Human | Esophagus | ESCC | 1.84e-17 | 3.13e-01 | 0.1153 |
| 27107 | ZBTB11 | P17T-E | Human | Esophagus | ESCC | 8.41e-09 | 2.24e-01 | 0.1278 |
| 27107 | ZBTB11 | P19T-E | Human | Esophagus | ESCC | 1.91e-06 | 1.82e-01 | 0.1662 |
| Page: 1 2 3 |
| Tissue | Expression Dynamics | Abbreviation |
| Esophagus | 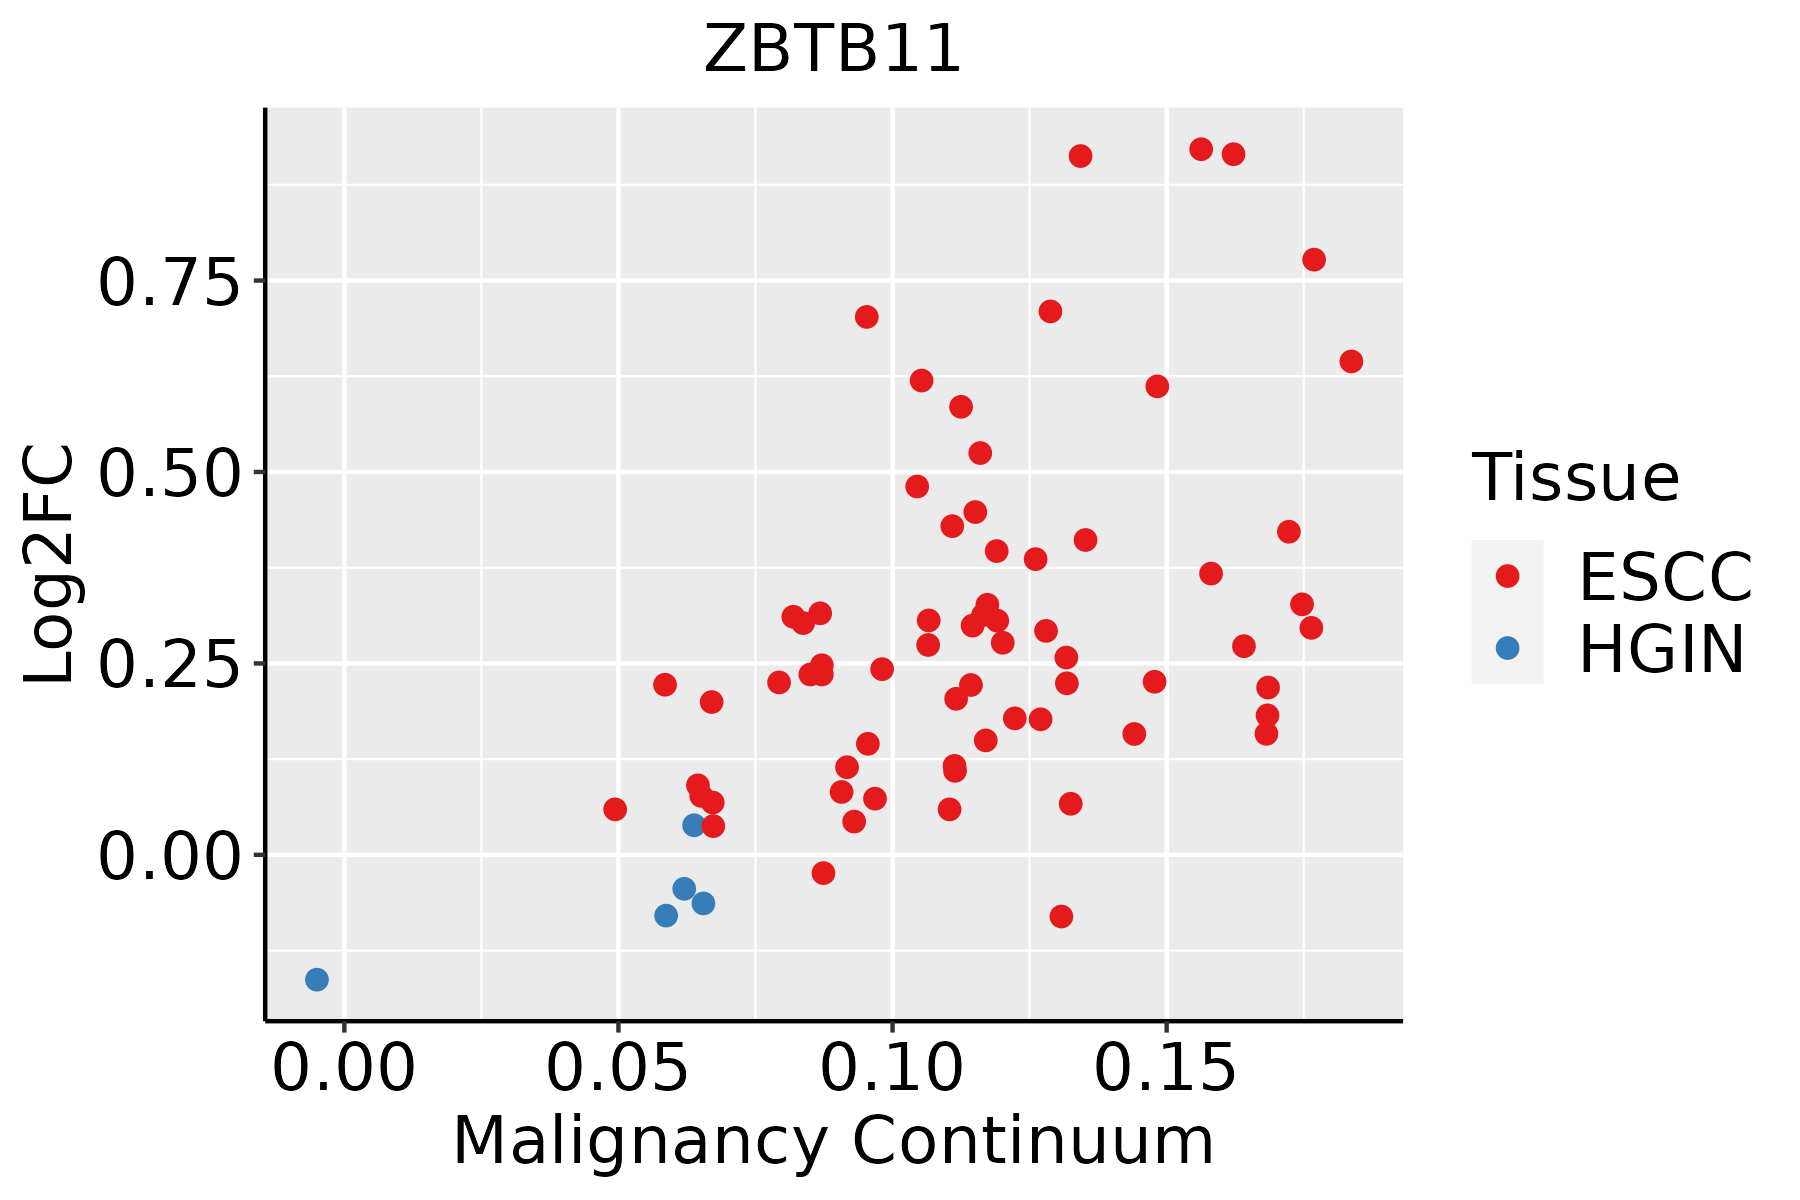 | ESCC: Esophageal squamous cell carcinoma |
| HGIN: High-grade intraepithelial neoplasias | ||
| LGIN: Low-grade intraepithelial neoplasias |
| ∗log2FC in expression of this searched gene in stem-like cells from each diseased tissue sample relative to stem-like cells in normal samples in each tissue plotted against the malignancy continuum. Samples are colored based on if they are from different disease stage. |
Top |
Malignant transformation related pathway analysis |
| Find out the enriched GO biological processes and KEGG pathways involved in transition from healthy to precancer to cancer |
| Tissue | Disease Stage | Enriched GO biological Processes |
| Colorectum | AD |  |
| Colorectum | SER |  |
| Colorectum | MSS |  |
| Colorectum | MSI-H |  |
| Colorectum | FAP |  |
| ∗Top 15 enriched GO BP terms are showed in the bar plot of each disease state in each tissue. Each row represents a significant GO biological process which is colored according to the -log10(p.adjust). |
| Page: 1 2 3 4 5 6 7 8 9 |
| GO ID | Tissue | Disease Stage | Description | Gene Ratio | Bg Ratio | pvalue | p.adjust | Count |
| Page: 1 |
| Pathway ID | Tissue | Disease Stage | Description | Gene Ratio | Bg Ratio | pvalue | p.adjust | qvalue | Count |
| Page: 1 |
Top |
Cell-cell communication analysis |
| Identification of potential cell-cell interactions between two cell types and their ligand-receptor pairs for different disease states |
| Ligand | Receptor | LRpair | Pathway | Tissue | Disease Stage |
| Page: 1 |
Top |
Single-cell gene regulatory network inference analysis |
| Find out the significant the regulons (TFs) and the target genes of each regulon across cell types for different disease states |
| TF | Cell Type | Tissue | Disease Stage | Target Gene | RSS | Regulon Activity |
| ZBTB11 | PLA | Lung | ADJ | CADM1,ZBTB16,C2CD2, etc. | 1.25e-02 |  |
| ZBTB11 | M1MAC | Lung | ADJ | CADM1,ZBTB16,C2CD2, etc. | 1.60e-03 | |
| ZBTB11 | TFH | Lung | ADJ | CADM1,ZBTB16,C2CD2, etc. | -8.88e-16 | |
| ZBTB11 | MALTB | Lung | ADJ | CADM1,ZBTB16,C2CD2, etc. | 0.00e+00 | |
| ZBTB11 | BMEM | Lung | ADJ | CADM1,ZBTB16,C2CD2, etc. | 0.00e+00 | |
| ZBTB11 | GC | Lung | ADJ | CADM1,ZBTB16,C2CD2, etc. | 2.19e-03 | |
| ZBTB11 | MDSC | Lung | ADJ | CADM1,ZBTB16,C2CD2, etc. | 0.00e+00 | |
| ZBTB11 | MSC.MVA | Oral cavity | LP | NMD3,OPA3,SOX17, etc. | 3.52e-02 |  |
| ZBTB11 | FIB | Oral cavity | OSCC | NMD3,OPA3,SOX17, etc. | 0.00e+00 |  |
| ∗The dot plots of a searched regulon are shown for all cell subpopulations in each disease state of each tissue based on the regulon specific score inferred using pySCENIC and by calculating the average expression. |
| Page: 1 |
Top |
Somatic mutation of malignant transformation related genes |
| Annotation of somatic variants for genes involved in malignant transformation |
| Hugo Symbol | Variant Class | Variant Classification | dbSNP RS | HGVSc | HGVSp | HGVSp Short | SWISSPROT | BIOTYPE | SIFT | PolyPhen | Tumor Sample Barcode | Tissue | Histology | Sex | Age | Stage | Therapy Types | Drugs | Outcome |
| ZBTB11 | SNV | Missense_Mutation | novel | c.2780N>A | p.Arg927Gln | p.R927Q | O95625 | protein_coding | deleterious(0.05) | possibly_damaging(0.632) | TCGA-AN-A046-01 | Breast | breast invasive carcinoma | Female | >=65 | I/II | Unknown | Unknown | SD |
| ZBTB11 | SNV | Missense_Mutation | rs76876070 | c.1747N>A | p.Ala583Thr | p.A583T | O95625 | protein_coding | tolerated(0.28) | benign(0.049) | TCGA-AO-A128-01 | Breast | breast invasive carcinoma | Female | <65 | I/II | Chemotherapy | doxorubicin | SD |
| ZBTB11 | SNV | Missense_Mutation | c.2067C>G | p.Ile689Met | p.I689M | O95625 | protein_coding | deleterious(0.03) | possibly_damaging(0.832) | TCGA-B6-A1KN-01 | Breast | breast invasive carcinoma | Female | <65 | III/IV | Unknown | Unknown | SD | |
| ZBTB11 | insertion | Frame_Shift_Ins | novel | c.2320_2321insA | p.Ser774LysfsTer4 | p.S774Kfs*4 | O95625 | protein_coding | TCGA-BH-A209-01 | Breast | breast invasive carcinoma | Female | >=65 | I/II | Unknown | Unknown | SD | ||
| ZBTB11 | deletion | Frame_Shift_Del | novel | c.2758delN | p.Ser920AlafsTer5 | p.S920Afs*5 | O95625 | protein_coding | TCGA-D8-A27V-01 | Breast | breast invasive carcinoma | Female | <65 | I/II | Hormone Therapy | tamoxiphen | SD | ||
| ZBTB11 | SNV | Missense_Mutation | novel | c.2833A>C | p.Ile945Leu | p.I945L | O95625 | protein_coding | deleterious(0) | probably_damaging(0.952) | TCGA-2W-A8YY-01 | Cervix | cervical & endocervical cancer | Female | <65 | I/II | Chemotherapy | cisplatin | CR |
| ZBTB11 | SNV | Missense_Mutation | c.1286N>C | p.Arg429Thr | p.R429T | O95625 | protein_coding | tolerated_low_confidence(0.56) | benign(0) | TCGA-C5-A1BQ-01 | Cervix | cervical & endocervical cancer | Female | >=65 | III/IV | Chemotherapy | cisplatin | CR | |
| ZBTB11 | SNV | Missense_Mutation | c.2178G>C | p.Met726Ile | p.M726I | O95625 | protein_coding | tolerated(0.14) | benign(0.001) | TCGA-IR-A3LK-01 | Cervix | cervical & endocervical cancer | Female | >=65 | I/II | Chemotherapy | cisplatin | PD | |
| ZBTB11 | SNV | Missense_Mutation | novel | c.2078N>A | p.Gly693Asp | p.G693D | O95625 | protein_coding | tolerated(0.19) | probably_damaging(0.947) | TCGA-A6-2672-01 | Colorectum | colon adenocarcinoma | Female | >=65 | III/IV | Unknown | Unknown | SD |
| ZBTB11 | SNV | Missense_Mutation | c.191N>C | p.Val64Ala | p.V64A | O95625 | protein_coding | deleterious_low_confidence(0) | probably_damaging(0.978) | TCGA-A6-2686-01 | Colorectum | colon adenocarcinoma | Female | >=65 | I/II | Unknown | Unknown | SD |
| Page: 1 2 3 4 5 6 7 8 9 10 11 |
Top |
Related drugs of malignant transformation related genes |
| Identification of chemicals and drugs interact with genes involved in malignant transfromation |
| (DGIdb 4.0) |
| Entrez ID | Symbol | Category | Interaction Types | Drug Claim Name | Drug Name | PMIDs |
| Page: 1 |

Copyright 2023-Present -The University of Texas Health Science Center at Houston |