
|
|||||
|
 | |
| |
| |
| |
| |
| |
|
Gene: ZBED3 |
Gene summary for ZBED3 |
| Gene information | Species | Human | Gene symbol | ZBED3 | Gene ID | 84327 |
| Gene name | zinc finger BED-type containing 3 | |
| Gene Alias | ZBED3 | |
| Cytomap | 5q13.3 | |
| Gene Type | protein-coding | GO ID | GO:0000226 | UniProtAcc | Q96IU2 |
Top |
Malignant transformation analysis |
| Identification of the aberrant gene expression in precancerous and cancerous lesions by comparing the gene expression of stem-like cells in diseased tissues with normal stem cells |
| Entrez ID | Symbol | Replicates | Species | Organ | Tissue | Adj P-value | Log2FC | Malignancy |
| 84327 | ZBED3 | HCC1_Meng | Human | Liver | HCC | 5.93e-52 | 9.40e-02 | 0.0246 |
| 84327 | ZBED3 | HCC2 | Human | Liver | HCC | 6.51e-06 | 3.49e+00 | 0.5341 |
| 84327 | ZBED3 | S016 | Human | Liver | HCC | 9.80e-03 | 1.99e-01 | 0.2243 |
| 84327 | ZBED3 | S027 | Human | Liver | HCC | 1.32e-02 | 4.18e-01 | 0.2446 |
| 84327 | ZBED3 | S028 | Human | Liver | HCC | 2.56e-12 | 5.65e-01 | 0.2503 |
| 84327 | ZBED3 | S029 | Human | Liver | HCC | 2.53e-07 | 3.98e-01 | 0.2581 |
| 84327 | ZBED3 | male-WTA | Human | Thyroid | PTC | 2.01e-15 | 1.59e-01 | 0.1037 |
| 84327 | ZBED3 | PTC01 | Human | Thyroid | PTC | 2.96e-08 | 1.12e-01 | 0.1899 |
| 84327 | ZBED3 | PTC04 | Human | Thyroid | PTC | 1.07e-08 | 1.33e-01 | 0.1927 |
| 84327 | ZBED3 | PTC05 | Human | Thyroid | PTC | 4.27e-12 | 4.30e-01 | 0.2065 |
| 84327 | ZBED3 | PTC06 | Human | Thyroid | PTC | 1.39e-07 | 2.17e-01 | 0.2057 |
| 84327 | ZBED3 | PTC07 | Human | Thyroid | PTC | 1.88e-16 | 3.33e-01 | 0.2044 |
| 84327 | ZBED3 | ATC13 | Human | Thyroid | ATC | 1.33e-10 | 1.95e-01 | 0.34 |
| 84327 | ZBED3 | ATC4 | Human | Thyroid | ATC | 1.20e-03 | -2.11e-02 | 0.34 |
| 84327 | ZBED3 | ATC5 | Human | Thyroid | ATC | 3.23e-12 | 2.07e-01 | 0.34 |
| Page: 1 |
| Tissue | Expression Dynamics | Abbreviation |
| Liver | 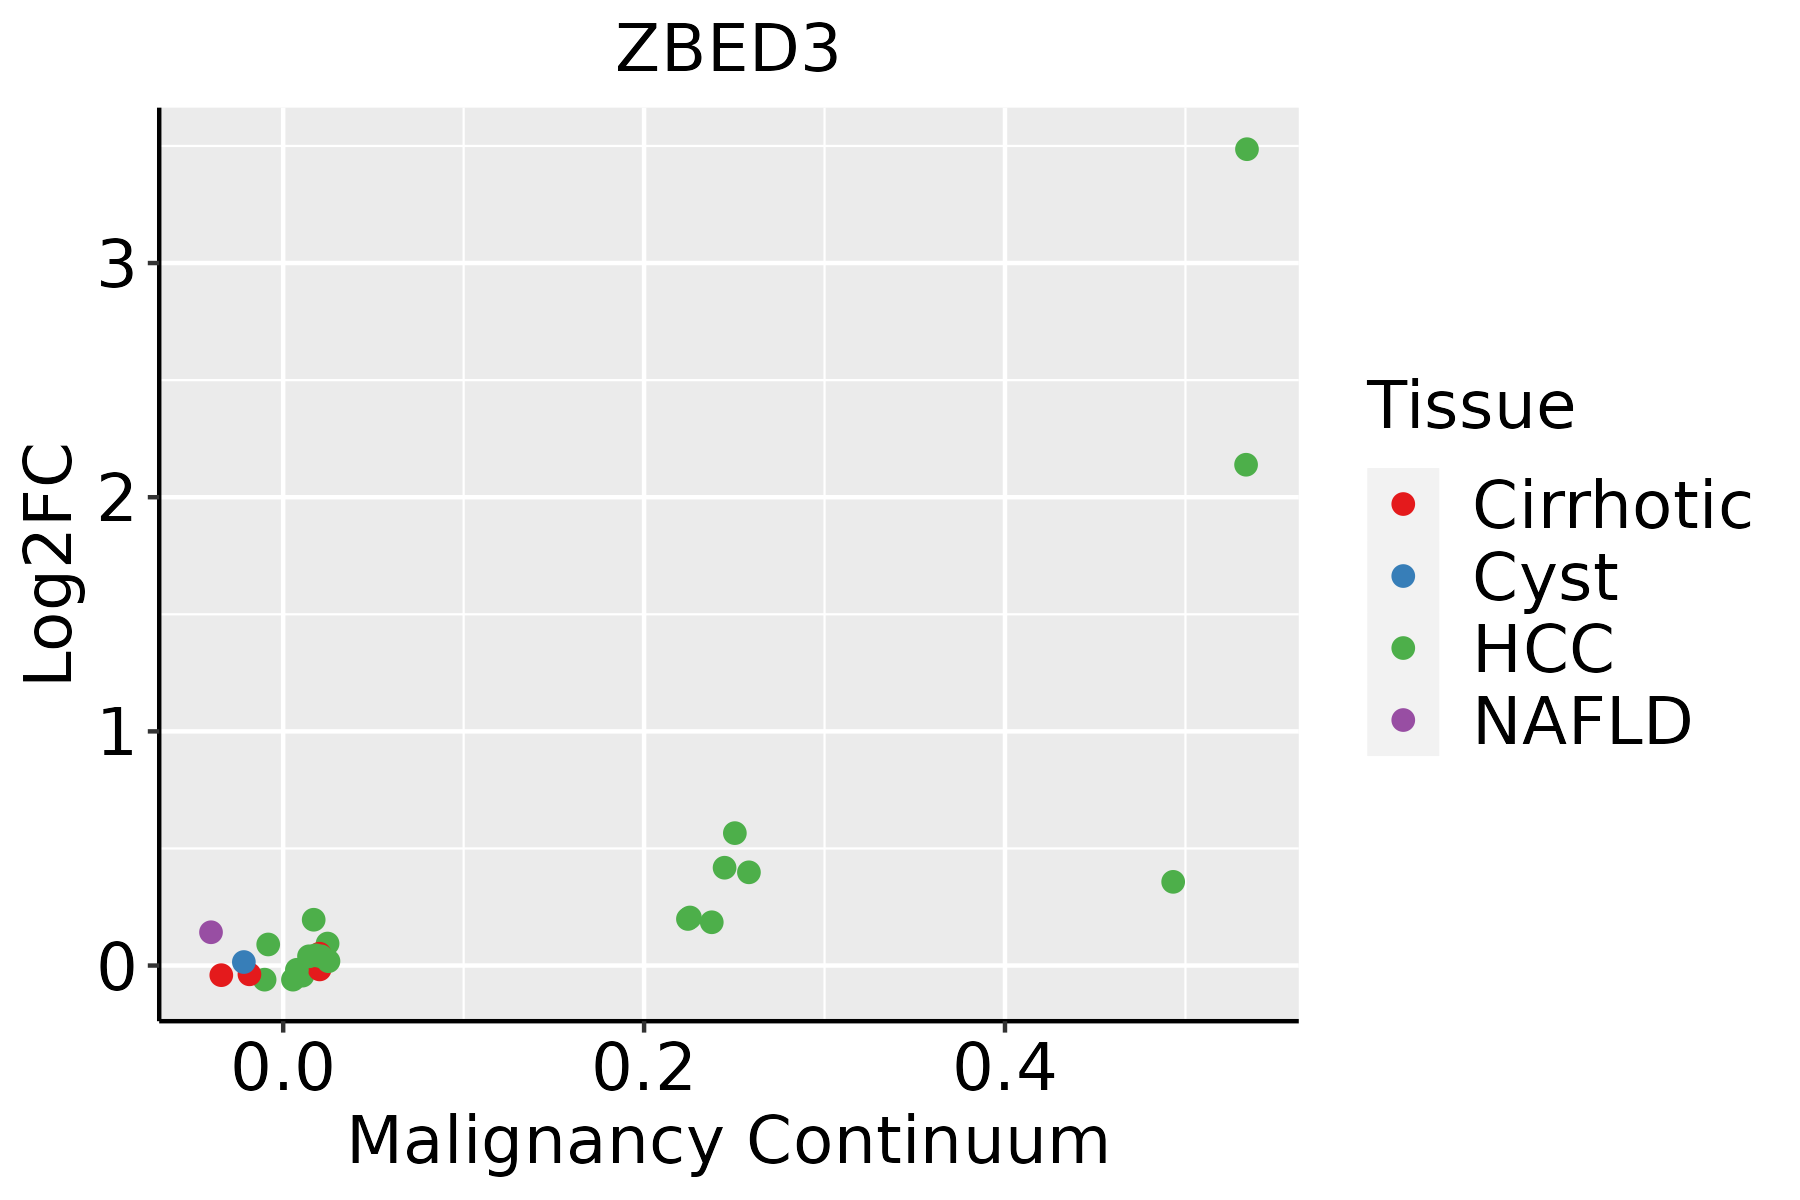 | HCC: Hepatocellular carcinoma |
| NAFLD: Non-alcoholic fatty liver disease | ||
| Thyroid | 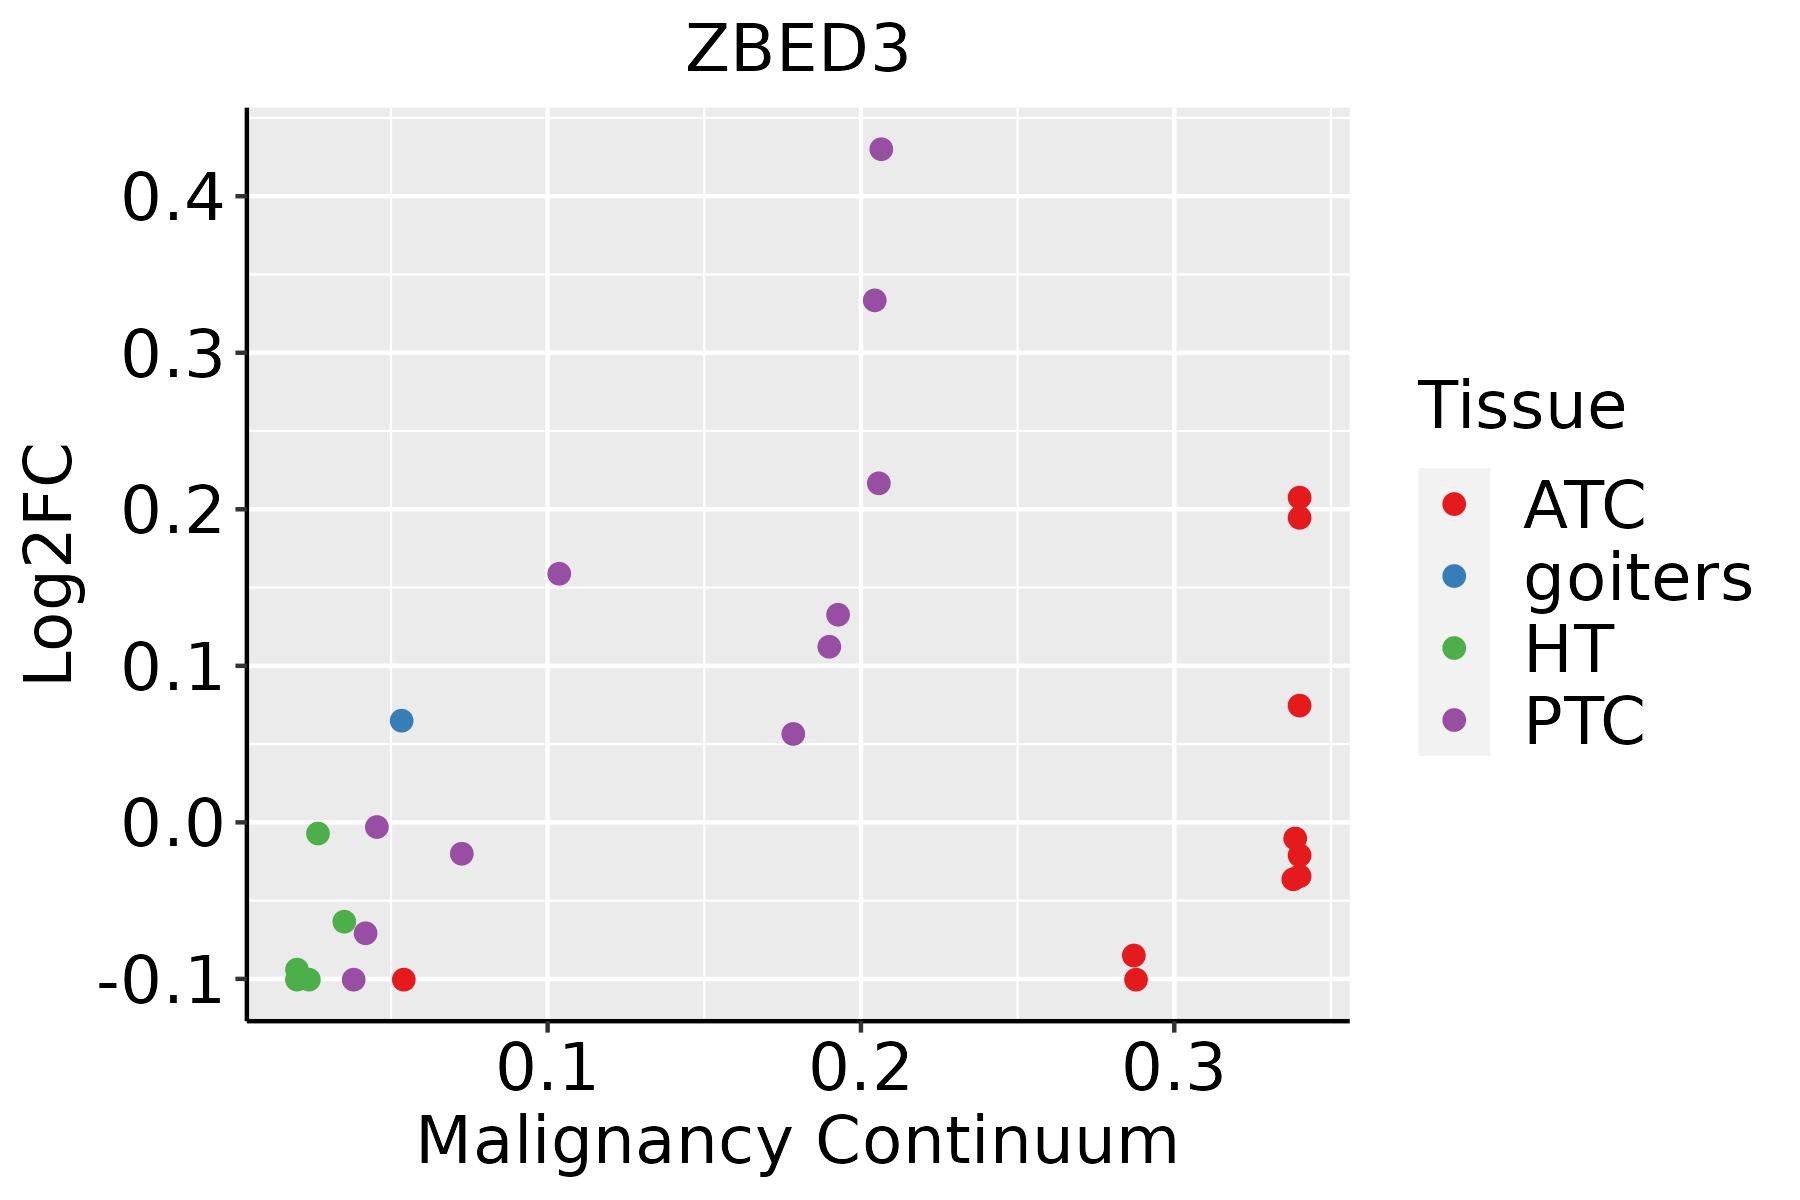 | ATC: Anaplastic thyroid cancer |
| HT: Hashimoto's thyroiditis | ||
| PTC: Papillary thyroid cancer |
| ∗log2FC in expression of this searched gene in stem-like cells from each diseased tissue sample relative to stem-like cells in normal samples in each tissue plotted against the malignancy continuum. Samples are colored based on if they are from different disease stage. |
Top |
Malignant transformation related pathway analysis |
| Find out the enriched GO biological processes and KEGG pathways involved in transition from healthy to precancer to cancer |
| Tissue | Disease Stage | Enriched GO biological Processes |
| Colorectum | AD |  |
| Colorectum | SER |  |
| Colorectum | MSS |  |
| Colorectum | MSI-H |  |
| Colorectum | FAP |  |
| ∗Top 15 enriched GO BP terms are showed in the bar plot of each disease state in each tissue. Each row represents a significant GO biological process which is colored according to the -log10(p.adjust). |
| Page: 1 2 3 4 5 6 7 8 9 |
| GO ID | Tissue | Disease Stage | Description | Gene Ratio | Bg Ratio | pvalue | p.adjust | Count |
| GO:003164722 | Liver | HCC | regulation of protein stability | 211/7958 | 298/18723 | 2.29e-23 | 5.01e-21 | 211 |
| GO:005082122 | Liver | HCC | protein stabilization | 139/7958 | 191/18723 | 1.61e-17 | 1.71e-15 | 139 |
| GO:003286821 | Liver | HCC | response to insulin | 172/7958 | 264/18723 | 7.14e-14 | 4.23e-12 | 172 |
| GO:004343422 | Liver | HCC | response to peptide hormone | 247/7958 | 414/18723 | 9.55e-13 | 4.77e-11 | 247 |
| GO:001056322 | Liver | HCC | negative regulation of phosphorus metabolic process | 259/7958 | 442/18723 | 4.29e-12 | 1.92e-10 | 259 |
| GO:004593622 | Liver | HCC | negative regulation of phosphate metabolic process | 258/7958 | 441/18723 | 6.00e-12 | 2.60e-10 | 258 |
| GO:004232622 | Liver | HCC | negative regulation of phosphorylation | 227/7958 | 385/18723 | 3.98e-11 | 1.52e-09 | 227 |
| GO:000701522 | Liver | HCC | actin filament organization | 252/7958 | 442/18723 | 3.83e-10 | 1.25e-08 | 252 |
| GO:005165621 | Liver | HCC | establishment of organelle localization | 226/7958 | 390/18723 | 4.15e-10 | 1.34e-08 | 226 |
| GO:000702911 | Liver | HCC | endoplasmic reticulum organization | 64/7958 | 87/18723 | 3.92e-09 | 1.04e-07 | 64 |
| GO:000193322 | Liver | HCC | negative regulation of protein phosphorylation | 196/7958 | 342/18723 | 1.95e-08 | 4.63e-07 | 196 |
| GO:019873821 | Liver | HCC | cell-cell signaling by wnt | 247/7958 | 446/18723 | 2.11e-08 | 4.96e-07 | 247 |
| GO:001605521 | Liver | HCC | Wnt signaling pathway | 245/7958 | 444/18723 | 3.68e-08 | 8.09e-07 | 245 |
| GO:000974322 | Liver | HCC | response to carbohydrate | 149/7958 | 253/18723 | 9.55e-08 | 1.89e-06 | 149 |
| GO:003428422 | Liver | HCC | response to monosaccharide | 131/7958 | 225/18723 | 1.32e-06 | 1.91e-05 | 131 |
| GO:003011121 | Liver | HCC | regulation of Wnt signaling pathway | 180/7958 | 328/18723 | 3.62e-06 | 4.72e-05 | 180 |
| GO:000974622 | Liver | HCC | response to hexose | 126/7958 | 219/18723 | 4.81e-06 | 6.06e-05 | 126 |
| GO:000974912 | Liver | HCC | response to glucose | 121/7958 | 212/18723 | 1.24e-05 | 1.39e-04 | 121 |
| GO:006007021 | Liver | HCC | canonical Wnt signaling pathway | 162/7958 | 303/18723 | 7.00e-05 | 6.32e-04 | 162 |
| GO:006082821 | Liver | HCC | regulation of canonical Wnt signaling pathway | 137/7958 | 253/18723 | 1.15e-04 | 9.70e-04 | 137 |
| Page: 1 2 3 4 |
| Pathway ID | Tissue | Disease Stage | Description | Gene Ratio | Bg Ratio | pvalue | p.adjust | qvalue | Count |
| Page: 1 |
Top |
Cell-cell communication analysis |
| Identification of potential cell-cell interactions between two cell types and their ligand-receptor pairs for different disease states |
| Ligand | Receptor | LRpair | Pathway | Tissue | Disease Stage |
| Page: 1 |
Top |
Single-cell gene regulatory network inference analysis |
| Find out the significant the regulons (TFs) and the target genes of each regulon across cell types for different disease states |
| TF | Cell Type | Tissue | Disease Stage | Target Gene | RSS | Regulon Activity |
| ∗The dot plots of a searched regulon are shown for all cell subpopulations in each disease state of each tissue based on the regulon specific score inferred using pySCENIC and by calculating the average expression. |
| Page: 1 |
Top |
Somatic mutation of malignant transformation related genes |
| Annotation of somatic variants for genes involved in malignant transformation |
| Hugo Symbol | Variant Class | Variant Classification | dbSNP RS | HGVSc | HGVSp | HGVSp Short | SWISSPROT | BIOTYPE | SIFT | PolyPhen | Tumor Sample Barcode | Tissue | Histology | Sex | Age | Stage | Therapy Types | Drugs | Outcome |
| ZBED3 | SNV | Missense_Mutation | novel | c.676G>A | p.Gly226Ser | p.G226S | Q96IU2 | protein_coding | tolerated_low_confidence(0.16) | benign(0) | TCGA-BG-A221-01 | Endometrium | uterine corpus endometrioid carcinoma | Female | >=65 | I/II | Unknown | Unknown | SD |
| Page: 1 |
Top |
Related drugs of malignant transformation related genes |
| Identification of chemicals and drugs interact with genes involved in malignant transfromation |
| (DGIdb 4.0) |
| Entrez ID | Symbol | Category | Interaction Types | Drug Claim Name | Drug Name | PMIDs |
| Page: 1 |

Copyright 2023-Present -The University of Texas Health Science Center at Houston |