
|
|||||
|
 | |
| |
| |
| |
| |
| |
|
Gene: YY1AP1 |
Gene summary for YY1AP1 |
| Gene information | Species | Human | Gene symbol | YY1AP1 | Gene ID | 55249 |
| Gene name | YY1 associated protein 1 | |
| Gene Alias | GRNG | |
| Cytomap | 1q22 | |
| Gene Type | protein-coding | GO ID | GO:0006139 | UniProtAcc | Q9H869 |
Top |
Malignant transformation analysis |
| Identification of the aberrant gene expression in precancerous and cancerous lesions by comparing the gene expression of stem-like cells in diseased tissues with normal stem cells |
| Entrez ID | Symbol | Replicates | Species | Organ | Tissue | Adj P-value | Log2FC | Malignancy |
| 55249 | YY1AP1 | CCI_1 | Human | Cervix | CC | 1.29e-05 | 6.45e-01 | 0.528 |
| 55249 | YY1AP1 | CCI_2 | Human | Cervix | CC | 1.77e-03 | 5.06e-01 | 0.5249 |
| 55249 | YY1AP1 | CCI_3 | Human | Cervix | CC | 1.33e-04 | 4.35e-01 | 0.516 |
| 55249 | YY1AP1 | HTA11_3410_2000001011 | Human | Colorectum | AD | 3.19e-02 | -1.87e-04 | 0.0155 |
| 55249 | YY1AP1 | HTA11_1938_2000001011 | Human | Colorectum | AD | 5.15e-03 | 3.63e-01 | -0.0811 |
| 55249 | YY1AP1 | HTA11_347_2000001011 | Human | Colorectum | AD | 3.46e-11 | 5.09e-01 | -0.1954 |
| 55249 | YY1AP1 | HTA11_866_3004761011 | Human | Colorectum | AD | 1.55e-03 | 3.16e-01 | 0.096 |
| 55249 | YY1AP1 | HTA11_6818_2000001021 | Human | Colorectum | AD | 2.41e-03 | 3.32e-01 | 0.0588 |
| 55249 | YY1AP1 | HTA11_99999970781_79442 | Human | Colorectum | MSS | 2.10e-02 | 3.95e-01 | 0.294 |
| 55249 | YY1AP1 | A015-C-203 | Human | Colorectum | FAP | 1.35e-12 | -1.50e-01 | -0.1294 |
| 55249 | YY1AP1 | A002-C-203 | Human | Colorectum | FAP | 1.74e-03 | -6.90e-02 | 0.2786 |
| 55249 | YY1AP1 | A001-C-108 | Human | Colorectum | FAP | 2.51e-06 | -1.19e-01 | -0.0272 |
| 55249 | YY1AP1 | A002-C-205 | Human | Colorectum | FAP | 1.17e-04 | -2.59e-02 | -0.1236 |
| 55249 | YY1AP1 | A015-C-006 | Human | Colorectum | FAP | 1.26e-02 | -1.44e-01 | -0.0994 |
| 55249 | YY1AP1 | A015-C-106 | Human | Colorectum | FAP | 4.93e-04 | -4.98e-02 | -0.0511 |
| 55249 | YY1AP1 | A002-C-114 | Human | Colorectum | FAP | 2.59e-04 | -1.03e-01 | -0.1561 |
| 55249 | YY1AP1 | A015-C-104 | Human | Colorectum | FAP | 4.57e-13 | -9.73e-02 | -0.1899 |
| 55249 | YY1AP1 | A001-C-014 | Human | Colorectum | FAP | 5.54e-08 | -1.21e-01 | 0.0135 |
| 55249 | YY1AP1 | A002-C-016 | Human | Colorectum | FAP | 5.24e-08 | -9.97e-02 | 0.0521 |
| 55249 | YY1AP1 | A001-C-203 | Human | Colorectum | FAP | 7.06e-06 | -4.18e-02 | -0.0481 |
| Page: 1 2 3 4 5 6 7 |
| Tissue | Expression Dynamics | Abbreviation |
| Cervix | 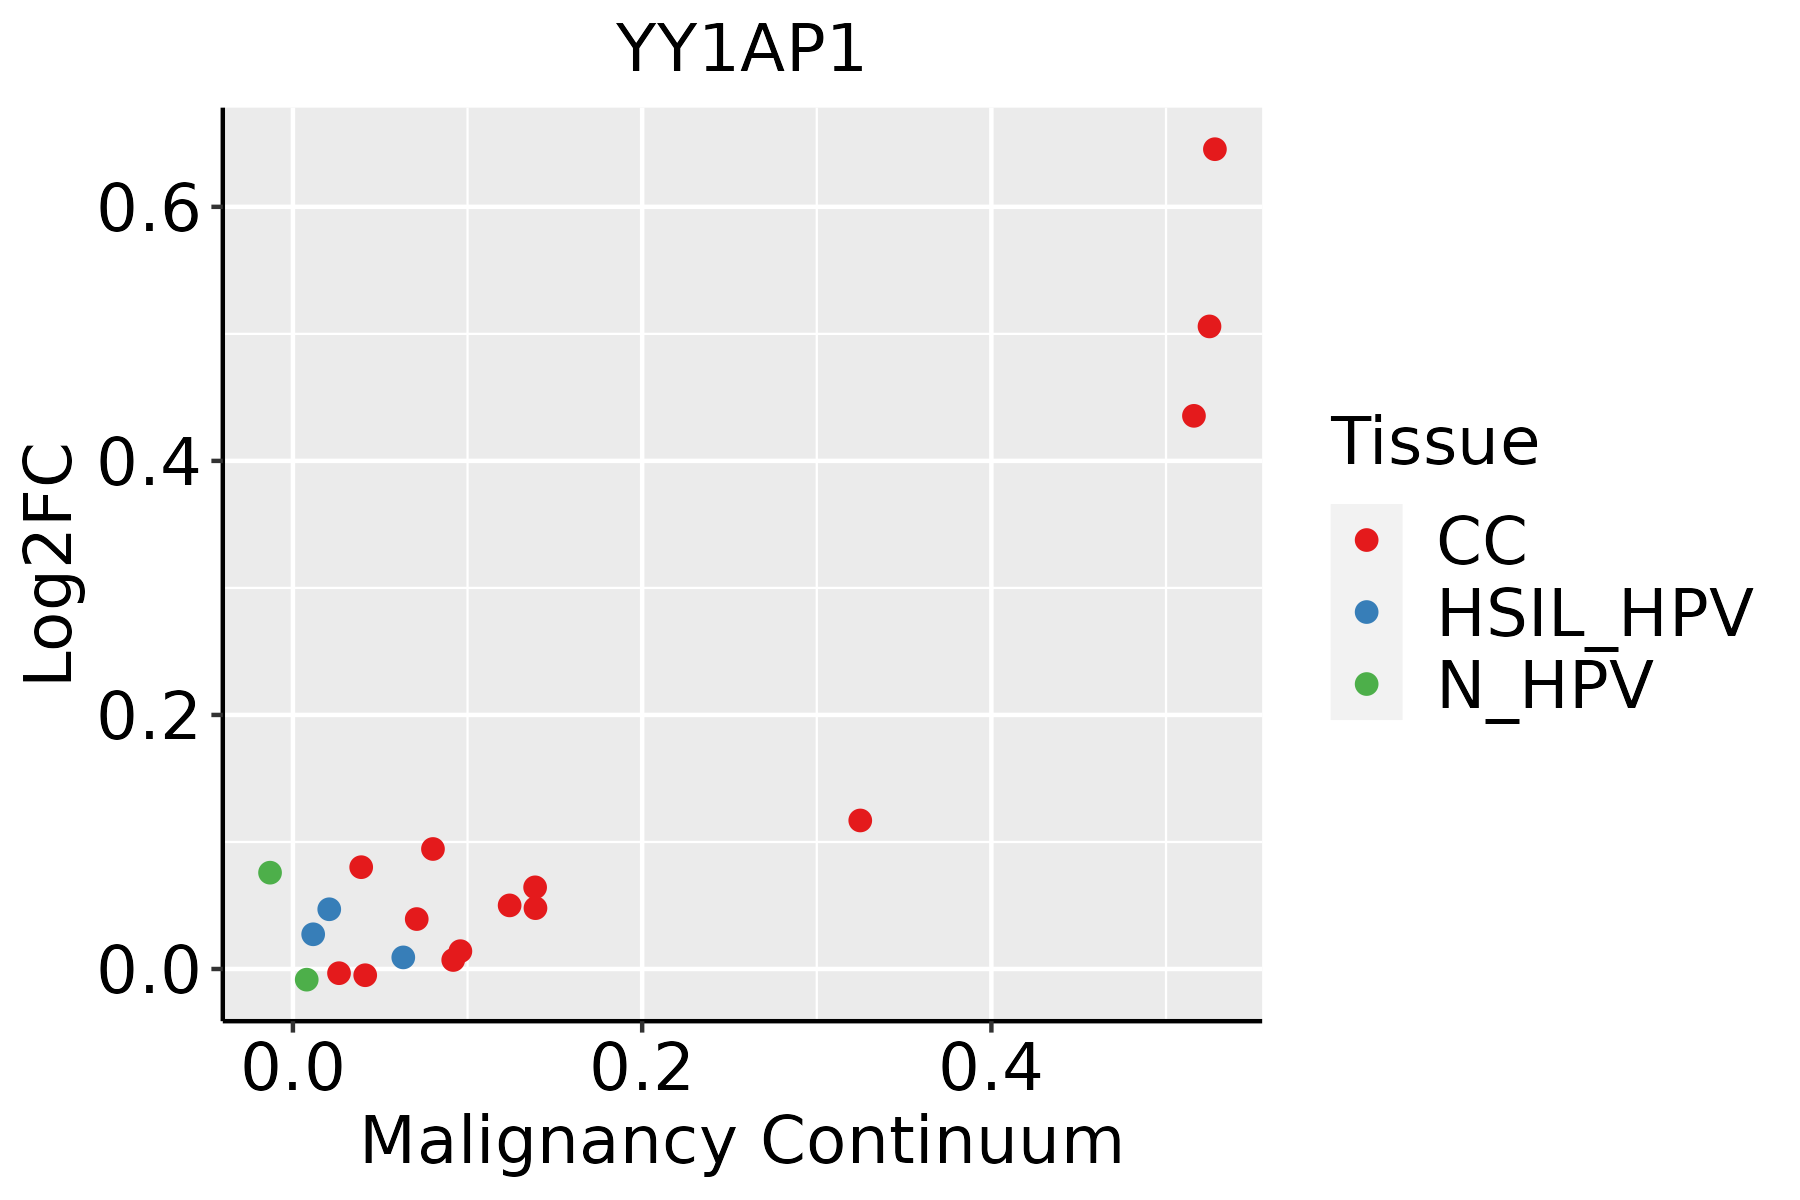 | CC: Cervix cancer |
| HSIL_HPV: HPV-infected high-grade squamous intraepithelial lesions | ||
| N_HPV: HPV-infected normal cervix | ||
| Colorectum (GSE201348) |  | FAP: Familial adenomatous polyposis |
| CRC: Colorectal cancer | ||
| Colorectum (HTA11) |  | AD: Adenomas |
| SER: Sessile serrated lesions | ||
| MSI-H: Microsatellite-high colorectal cancer | ||
| MSS: Microsatellite stable colorectal cancer | ||
| Esophagus |  | ESCC: Esophageal squamous cell carcinoma |
| HGIN: High-grade intraepithelial neoplasias | ||
| LGIN: Low-grade intraepithelial neoplasias | ||
| Liver | 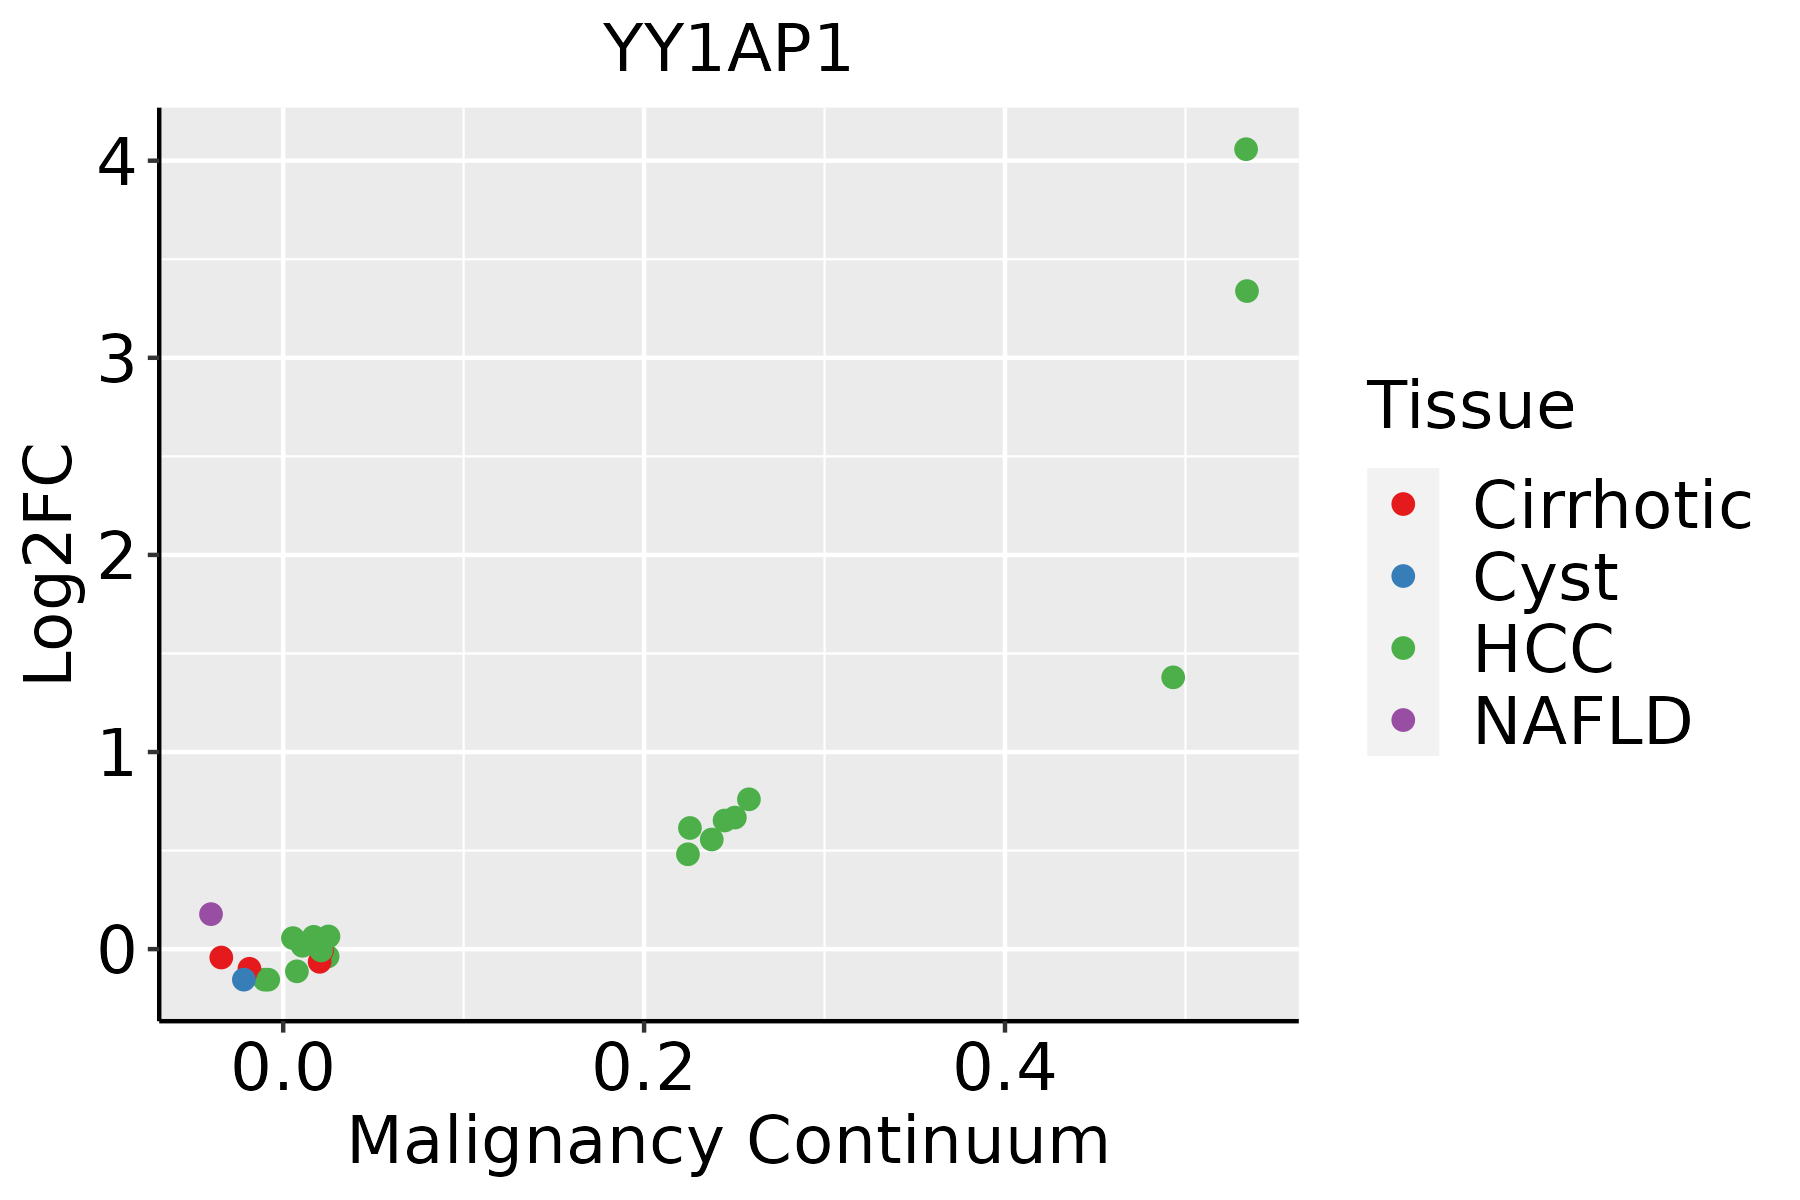 | HCC: Hepatocellular carcinoma |
| NAFLD: Non-alcoholic fatty liver disease | ||
| Oral Cavity | 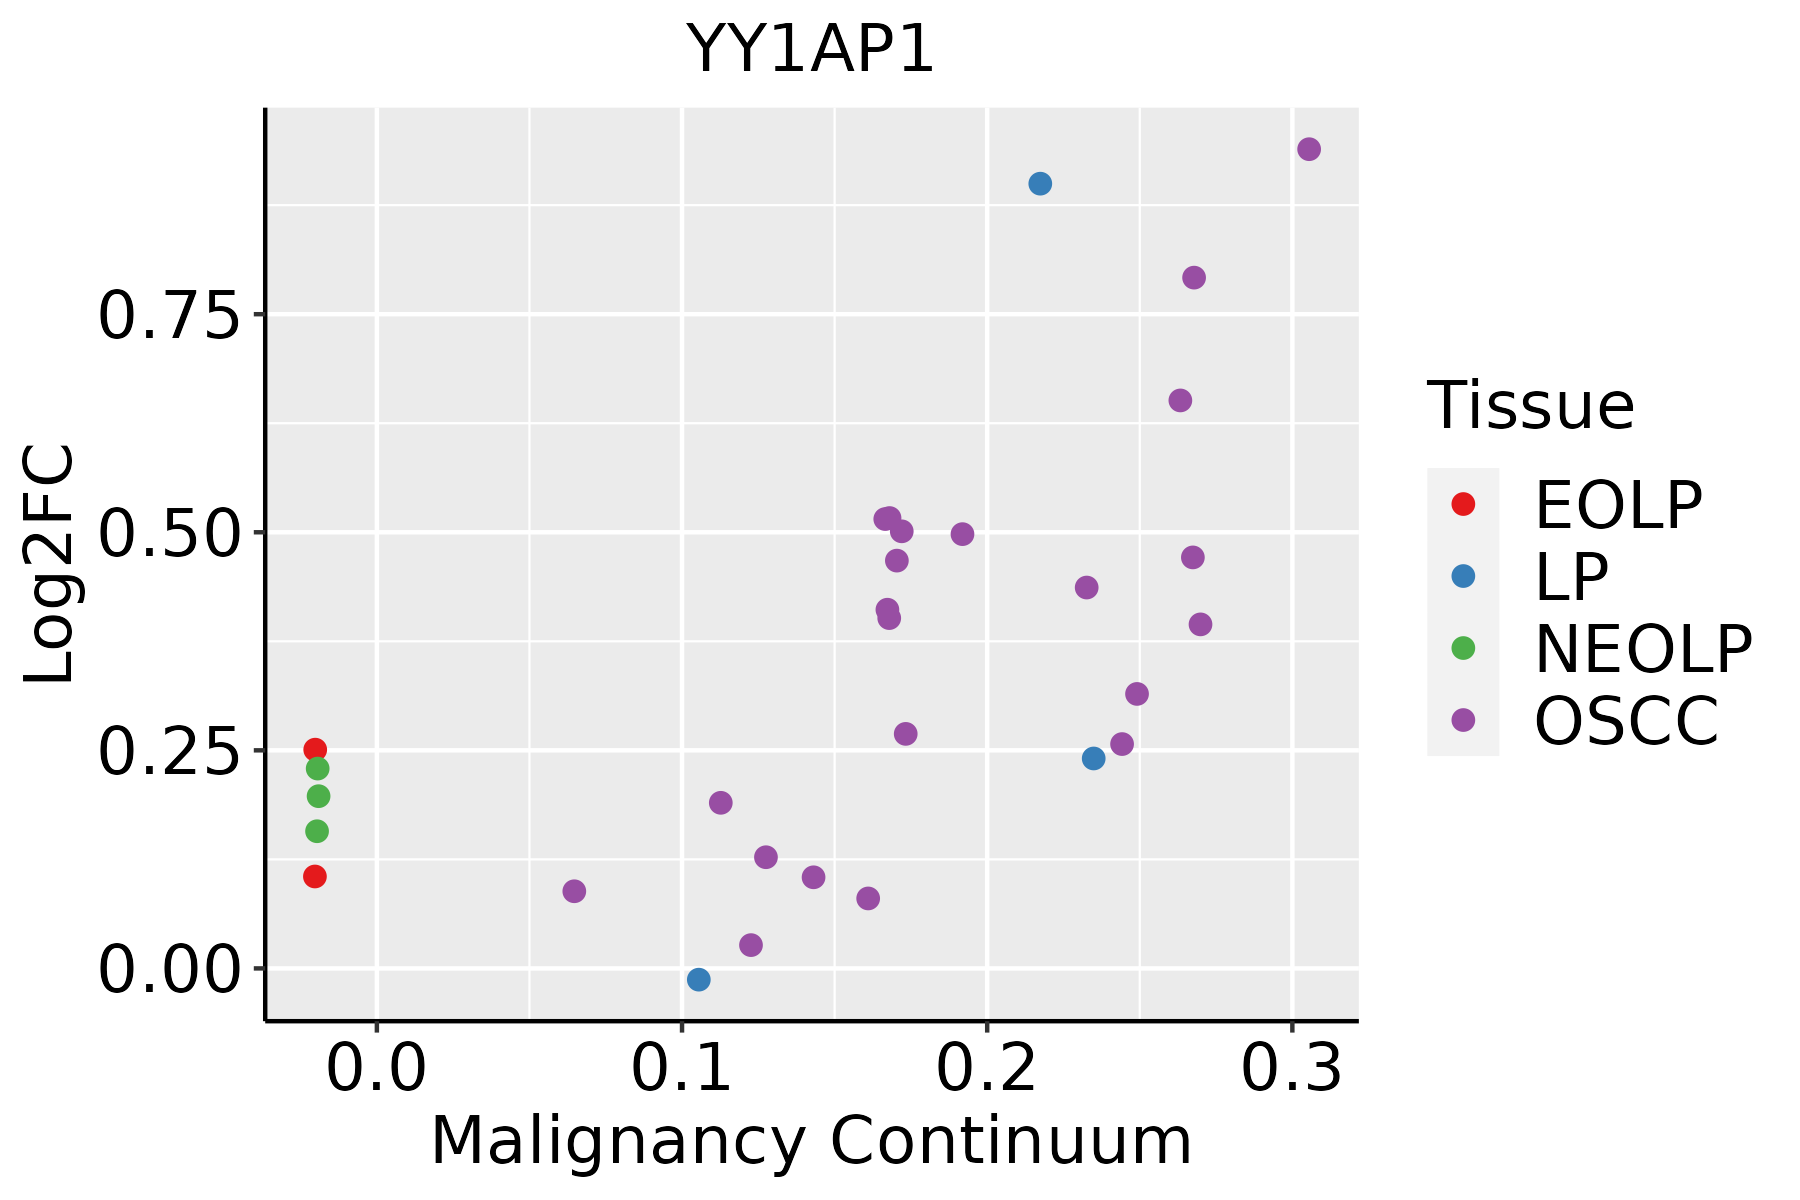 | EOLP: Erosive Oral lichen planus |
| LP: leukoplakia | ||
| NEOLP: Non-erosive oral lichen planus | ||
| OSCC: Oral squamous cell carcinoma |
| ∗log2FC in expression of this searched gene in stem-like cells from each diseased tissue sample relative to stem-like cells in normal samples in each tissue plotted against the malignancy continuum. Samples are colored based on if they are from different disease stage. |
Top |
Malignant transformation related pathway analysis |
| Find out the enriched GO biological processes and KEGG pathways involved in transition from healthy to precancer to cancer |
| Tissue | Disease Stage | Enriched GO biological Processes |
| Colorectum | AD |  |
| Colorectum | SER |  |
| Colorectum | MSS |  |
| Colorectum | MSI-H |  |
| Colorectum | FAP |  |
| ∗Top 15 enriched GO BP terms are showed in the bar plot of each disease state in each tissue. Each row represents a significant GO biological process which is colored according to the -log10(p.adjust). |
| Page: 1 2 3 4 5 6 7 8 9 |
| GO ID | Tissue | Disease Stage | Description | Gene Ratio | Bg Ratio | pvalue | p.adjust | Count |
| Page: 1 |
| Pathway ID | Tissue | Disease Stage | Description | Gene Ratio | Bg Ratio | pvalue | p.adjust | qvalue | Count |
| Page: 1 |
Top |
Cell-cell communication analysis |
| Identification of potential cell-cell interactions between two cell types and their ligand-receptor pairs for different disease states |
| Ligand | Receptor | LRpair | Pathway | Tissue | Disease Stage |
| Page: 1 |
Top |
Single-cell gene regulatory network inference analysis |
| Find out the significant the regulons (TFs) and the target genes of each regulon across cell types for different disease states |
| TF | Cell Type | Tissue | Disease Stage | Target Gene | RSS | Regulon Activity |
| ∗The dot plots of a searched regulon are shown for all cell subpopulations in each disease state of each tissue based on the regulon specific score inferred using pySCENIC and by calculating the average expression. |
| Page: 1 |
Top |
Somatic mutation of malignant transformation related genes |
| Annotation of somatic variants for genes involved in malignant transformation |
| Hugo Symbol | Variant Class | Variant Classification | dbSNP RS | HGVSc | HGVSp | HGVSp Short | SWISSPROT | BIOTYPE | SIFT | PolyPhen | Tumor Sample Barcode | Tissue | Histology | Sex | Age | Stage | Therapy Types | Drugs | Outcome |
| YY1AP1 | SNV | Missense_Mutation | c.2537N>A | p.Gly846Glu | p.G846E | Q9H869 | protein_coding | deleterious_low_confidence(0.01) | possibly_damaging(0.584) | TCGA-A2-A04X-01 | Breast | breast invasive carcinoma | Female | <65 | I/II | Chemotherapy | adriamycin | SD | |
| YY1AP1 | SNV | Missense_Mutation | c.729N>C | p.Gln243His | p.Q243H | Q9H869 | protein_coding | deleterious(0.02) | probably_damaging(1) | TCGA-A2-A0CM-01 | Breast | breast invasive carcinoma | Female | <65 | I/II | Chemotherapy | adriamycin | PD | |
| YY1AP1 | SNV | Missense_Mutation | novel | c.763C>T | p.His255Tyr | p.H255Y | Q9H869 | protein_coding | tolerated(0.17) | benign(0.059) | TCGA-A7-A3J1-01 | Breast | breast invasive carcinoma | Female | <65 | I/II | Hormone Therapy | anastrazole | SD |
| YY1AP1 | SNV | Missense_Mutation | c.1178N>G | p.Thr393Ser | p.T393S | Q9H869 | protein_coding | deleterious(0.04) | benign(0.359) | TCGA-B6-A0I8-01 | Breast | breast invasive carcinoma | Female | <65 | I/II | Unknown | Unknown | PD | |
| YY1AP1 | SNV | Missense_Mutation | c.466G>A | p.Glu156Lys | p.E156K | Q9H869 | protein_coding | deleterious(0.02) | possibly_damaging(0.841) | TCGA-D8-A1JK-01 | Breast | breast invasive carcinoma | Female | >=65 | I/II | Unknown | Unknown | SD | |
| YY1AP1 | SNV | Missense_Mutation | c.1774N>G | p.Ile592Val | p.I592V | Q9H869 | protein_coding | tolerated_low_confidence(0.09) | benign(0.169) | TCGA-D8-A1JM-01 | Breast | breast invasive carcinoma | Female | <65 | I/II | ChemotherapyHormone Therapy | doxorubicine | SD | |
| YY1AP1 | SNV | Missense_Mutation | c.1396N>T | p.Pro466Ser | p.P466S | Q9H869 | protein_coding | deleterious(0) | probably_damaging(0.947) | TCGA-D8-A1XK-01 | Breast | breast invasive carcinoma | Female | <65 | I/II | Chemotherapy | doxorubicine+cyclophosphamide | SD | |
| YY1AP1 | SNV | Missense_Mutation | novel | c.1711N>G | p.Pro571Ala | p.P571A | Q9H869 | protein_coding | tolerated_low_confidence(0.3) | benign(0.036) | TCGA-LL-A73Z-01 | Breast | breast invasive carcinoma | Female | <65 | III/IV | Chemotherapy | adriamycin | PD |
| YY1AP1 | SNV | Missense_Mutation | novel | c.2281G>T | p.Val761Leu | p.V761L | Q9H869 | protein_coding | tolerated_low_confidence(0.13) | benign(0.065) | TCGA-LL-A7SZ-01 | Breast | breast invasive carcinoma | Female | <65 | I/II | Chemotherapy | adriamycin | CR |
| YY1AP1 | insertion | Nonsense_Mutation | novel | c.1497_1498insTACACGTGACACCATTGGCACTGGTAGCTCATTCAGGGCGAATT | p.Asn500TyrfsTer3 | p.N500Yfs*3 | Q9H869 | protein_coding | TCGA-A8-A07R-01 | Breast | breast invasive carcinoma | Female | >=65 | III/IV | Ancillary | zoledronic | SD |
| Page: 1 2 3 4 5 6 7 8 9 10 |
Top |
Related drugs of malignant transformation related genes |
| Identification of chemicals and drugs interact with genes involved in malignant transfromation |
| (DGIdb 4.0) |
| Entrez ID | Symbol | Category | Interaction Types | Drug Claim Name | Drug Name | PMIDs |
| Page: 1 |

Copyright 2023-Present -The University of Texas Health Science Center at Houston |