
|
|||||
|
 | |
| |
| |
| |
| |
| |
|
Gene: YY1 |
Gene summary for YY1 |
| Gene information | Species | Human | Gene symbol | YY1 | Gene ID | 7528 |
| Gene name | YY1 transcription factor | |
| Gene Alias | DELTA | |
| Cytomap | 14q32.2 | |
| Gene Type | protein-coding | GO ID | GO:0000003 | UniProtAcc | P25490 |
Top |
Malignant transformation analysis |
| Identification of the aberrant gene expression in precancerous and cancerous lesions by comparing the gene expression of stem-like cells in diseased tissues with normal stem cells |
| Entrez ID | Symbol | Replicates | Species | Organ | Tissue | Adj P-value | Log2FC | Malignancy |
| 7528 | YY1 | HTA11_1938_2000001011 | Human | Colorectum | AD | 1.26e-05 | 4.61e-01 | -0.0811 |
| 7528 | YY1 | HTA11_78_2000001011 | Human | Colorectum | AD | 1.70e-03 | 3.31e-01 | -0.1088 |
| 7528 | YY1 | HTA11_347_2000001011 | Human | Colorectum | AD | 1.79e-18 | 6.54e-01 | -0.1954 |
| 7528 | YY1 | HTA11_411_2000001011 | Human | Colorectum | SER | 2.28e-03 | 6.48e-01 | -0.2602 |
| 7528 | YY1 | HTA11_83_2000001011 | Human | Colorectum | SER | 3.30e-04 | 3.61e-01 | -0.1526 |
| 7528 | YY1 | HTA11_1391_2000001011 | Human | Colorectum | AD | 1.81e-04 | 4.51e-01 | -0.059 |
| 7528 | YY1 | HTA11_99999965062_69753 | Human | Colorectum | MSI-H | 7.21e-03 | 8.29e-01 | 0.3487 |
| 7528 | YY1 | HTA11_99999965104_69814 | Human | Colorectum | MSS | 9.46e-13 | 6.17e-01 | 0.281 |
| 7528 | YY1 | A015-C-203 | Human | Colorectum | FAP | 3.42e-12 | -1.68e-01 | -0.1294 |
| 7528 | YY1 | A002-C-201 | Human | Colorectum | FAP | 1.25e-03 | -1.51e-01 | 0.0324 |
| 7528 | YY1 | A001-C-108 | Human | Colorectum | FAP | 3.74e-06 | -4.06e-02 | -0.0272 |
| 7528 | YY1 | A002-C-205 | Human | Colorectum | FAP | 2.66e-09 | 1.23e-02 | -0.1236 |
| 7528 | YY1 | A015-C-006 | Human | Colorectum | FAP | 4.18e-05 | -1.02e-01 | -0.0994 |
| 7528 | YY1 | A015-C-106 | Human | Colorectum | FAP | 2.74e-03 | -2.97e-02 | -0.0511 |
| 7528 | YY1 | A002-C-114 | Human | Colorectum | FAP | 7.33e-07 | -1.28e-01 | -0.1561 |
| 7528 | YY1 | A015-C-104 | Human | Colorectum | FAP | 1.82e-12 | -1.78e-01 | -0.1899 |
| 7528 | YY1 | A001-C-014 | Human | Colorectum | FAP | 2.21e-05 | -2.27e-01 | 0.0135 |
| 7528 | YY1 | A002-C-016 | Human | Colorectum | FAP | 3.16e-07 | -2.09e-01 | 0.0521 |
| 7528 | YY1 | A015-C-002 | Human | Colorectum | FAP | 6.12e-03 | -2.02e-01 | -0.0763 |
| 7528 | YY1 | A001-C-203 | Human | Colorectum | FAP | 2.30e-03 | -5.89e-02 | -0.0481 |
| Page: 1 2 3 4 5 6 7 8 9 10 |
| Tissue | Expression Dynamics | Abbreviation |
| Colorectum (GSE201348) |  | FAP: Familial adenomatous polyposis |
| CRC: Colorectal cancer | ||
| Colorectum (HTA11) |  | AD: Adenomas |
| SER: Sessile serrated lesions | ||
| MSI-H: Microsatellite-high colorectal cancer | ||
| MSS: Microsatellite stable colorectal cancer | ||
| Esophagus | 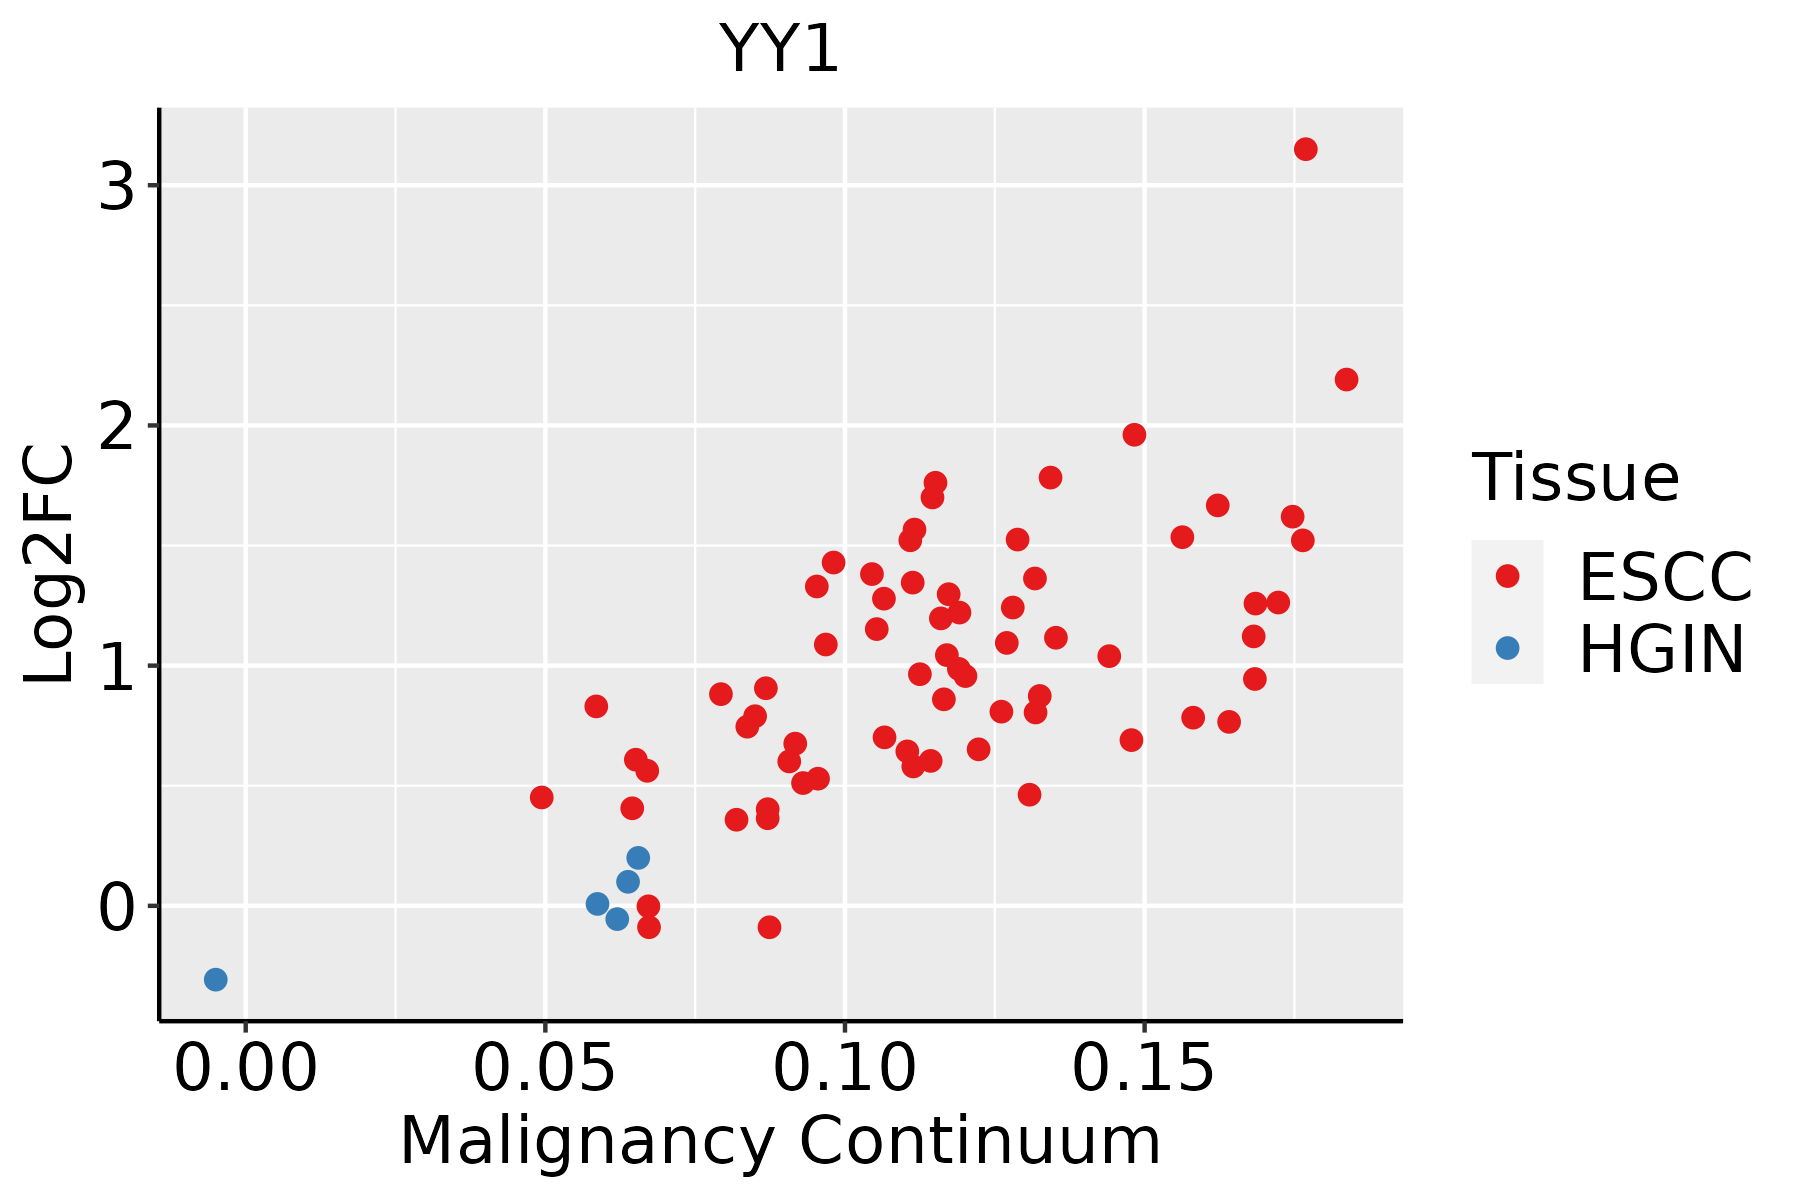 | ESCC: Esophageal squamous cell carcinoma |
| HGIN: High-grade intraepithelial neoplasias | ||
| LGIN: Low-grade intraepithelial neoplasias | ||
| Liver |  | HCC: Hepatocellular carcinoma |
| NAFLD: Non-alcoholic fatty liver disease | ||
| Oral Cavity | 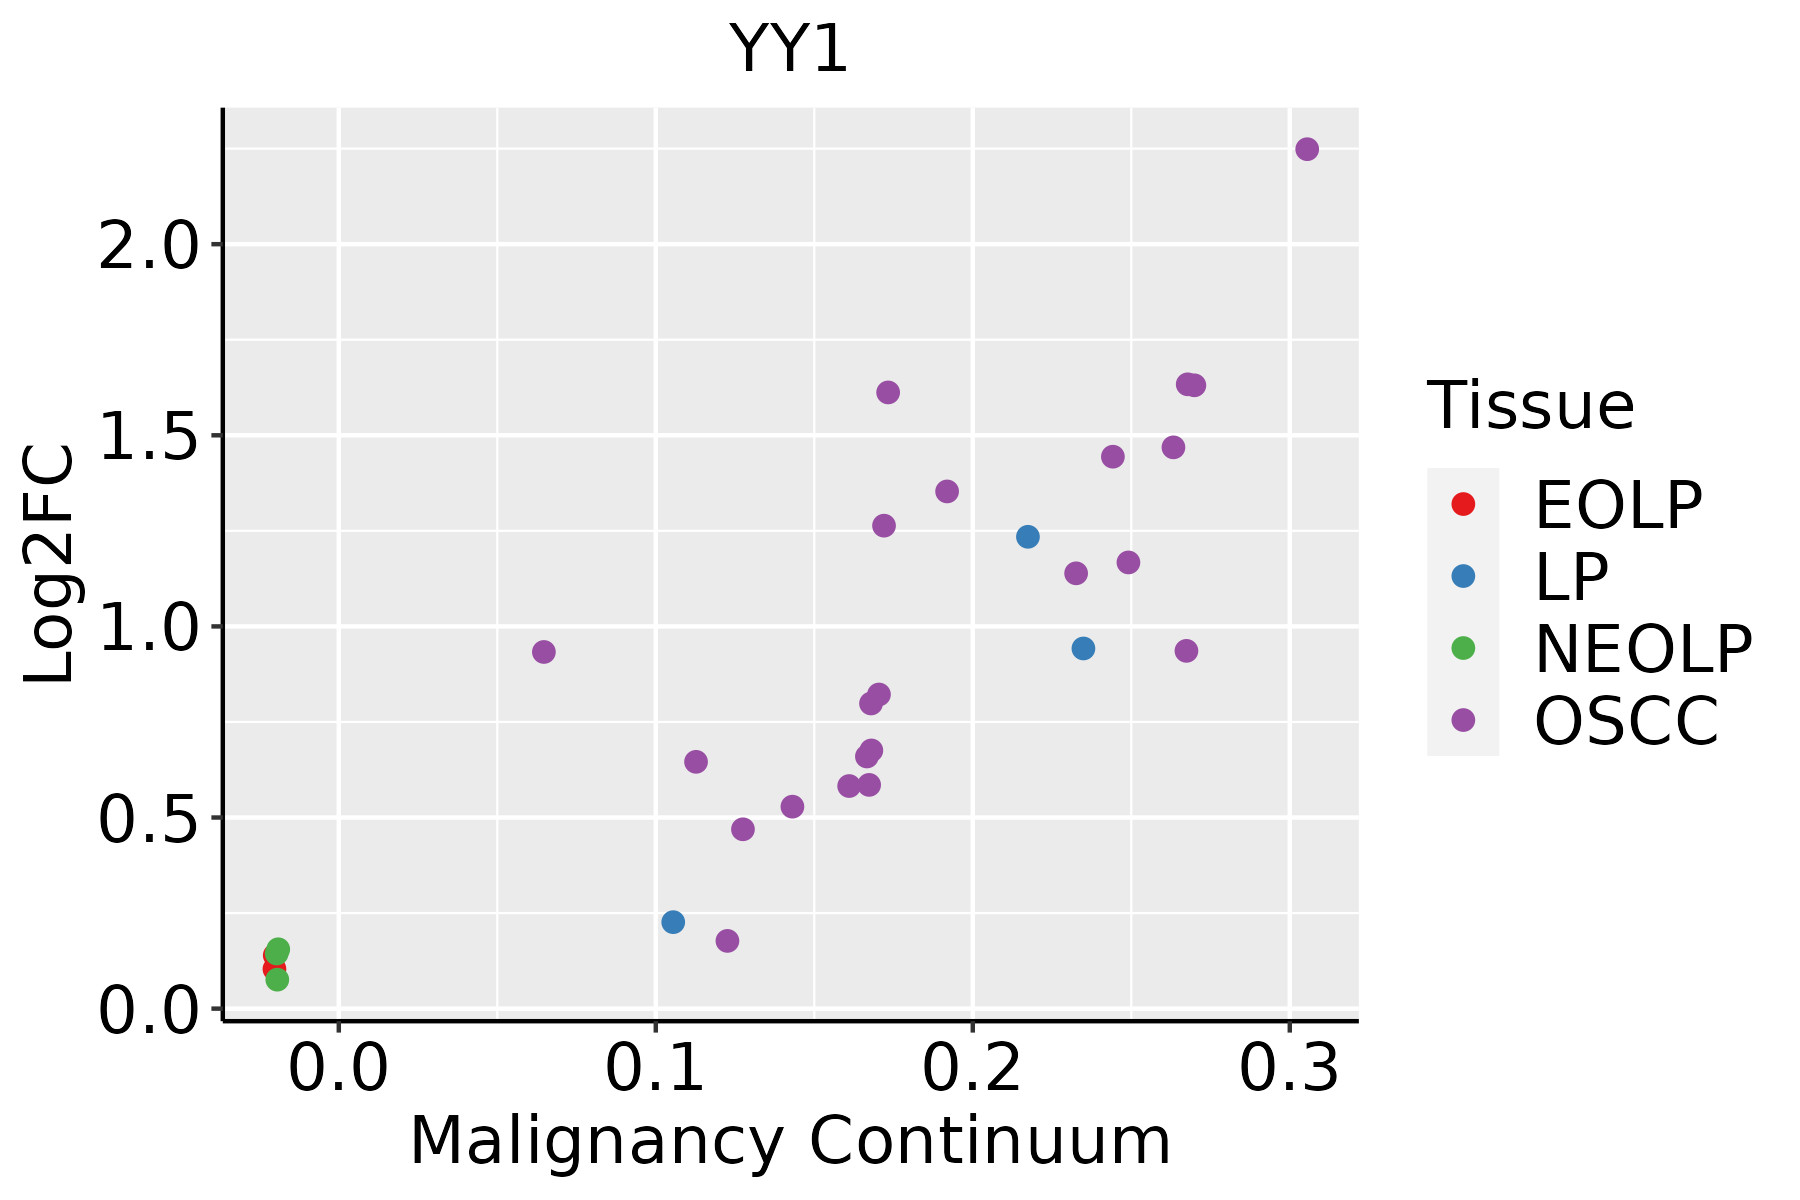 | EOLP: Erosive Oral lichen planus |
| LP: leukoplakia | ||
| NEOLP: Non-erosive oral lichen planus | ||
| OSCC: Oral squamous cell carcinoma | ||
| Prostate | 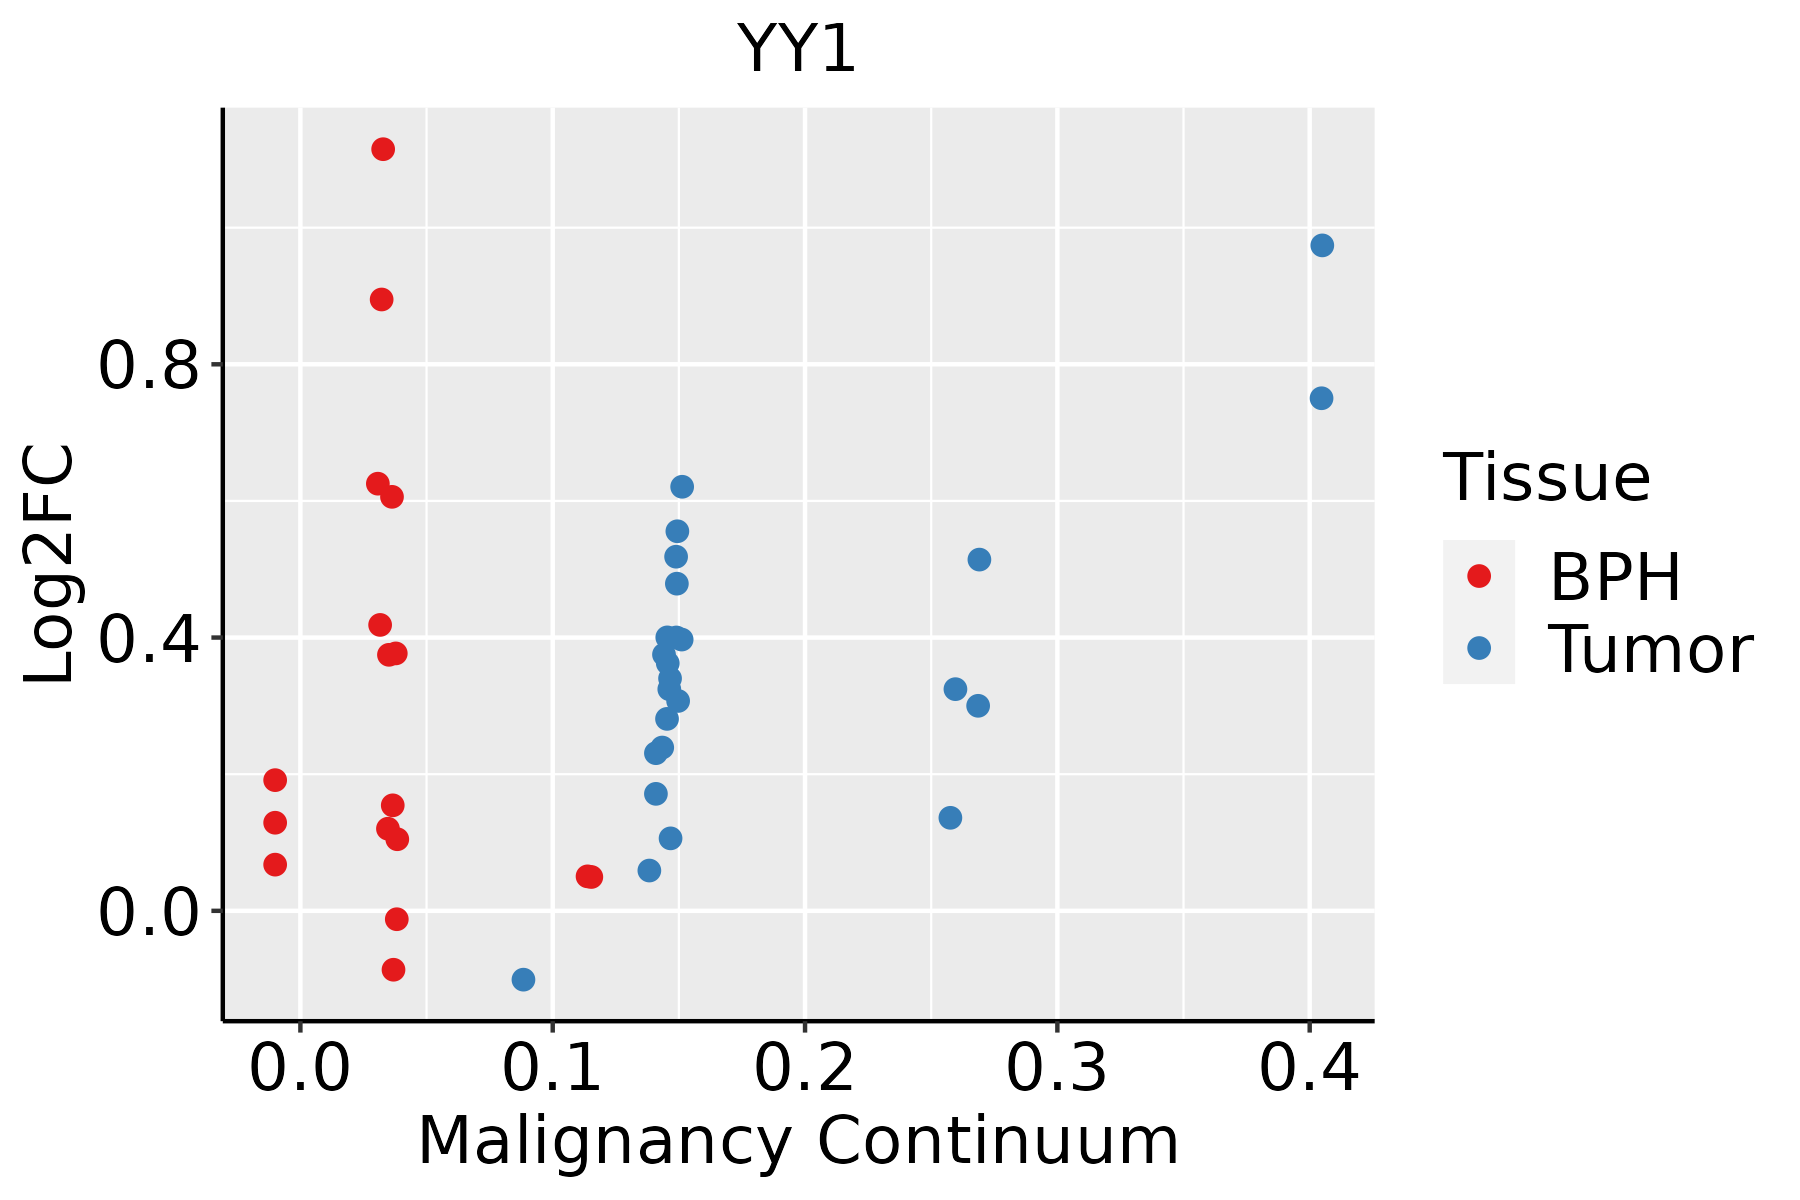 | BPH: Benign Prostatic Hyperplasia |
| Skin | 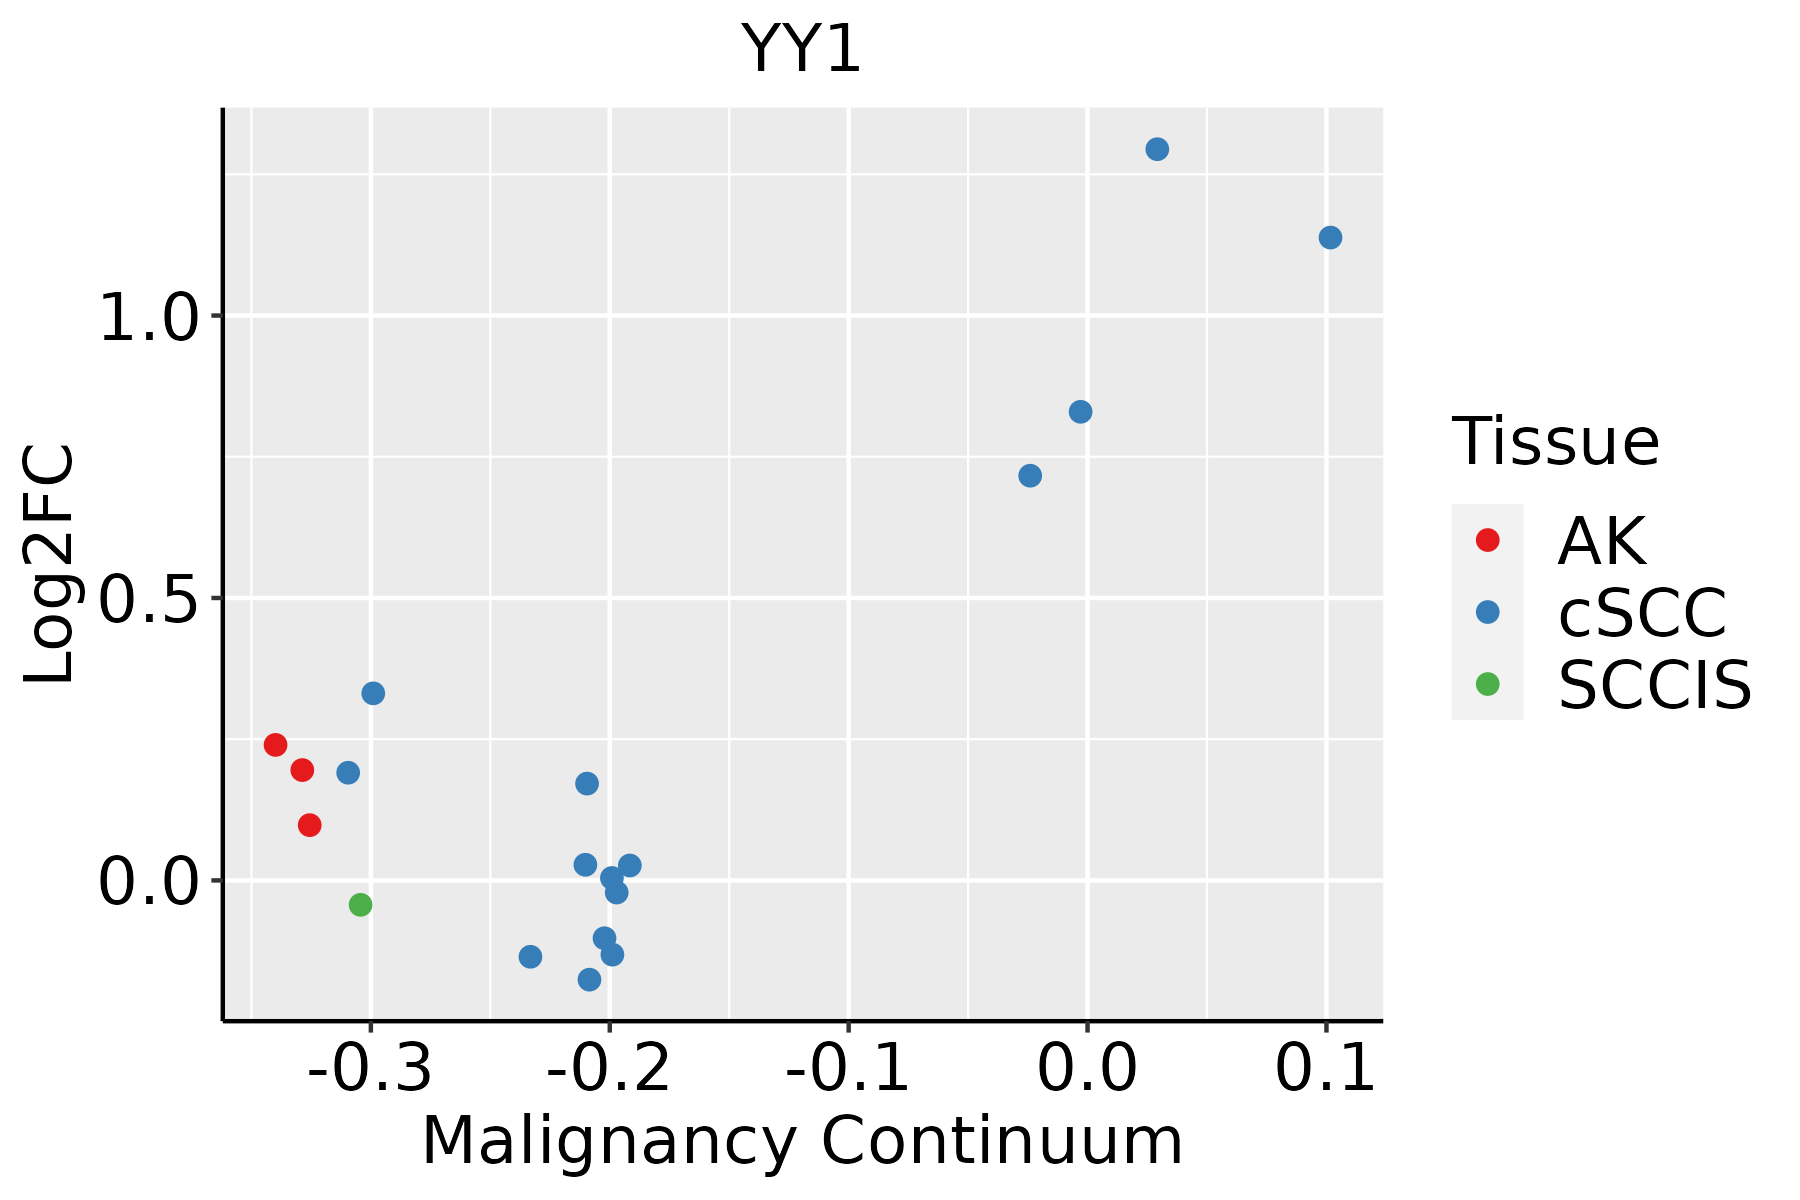 | AK: Actinic keratosis |
| cSCC: Cutaneous squamous cell carcinoma | ||
| SCCIS:squamous cell carcinoma in situ | ||
| Thyroid |  | ATC: Anaplastic thyroid cancer |
| HT: Hashimoto's thyroiditis | ||
| PTC: Papillary thyroid cancer |
| ∗log2FC in expression of this searched gene in stem-like cells from each diseased tissue sample relative to stem-like cells in normal samples in each tissue plotted against the malignancy continuum. Samples are colored based on if they are from different disease stage. |
Top |
Malignant transformation related pathway analysis |
| Find out the enriched GO biological processes and KEGG pathways involved in transition from healthy to precancer to cancer |
| Tissue | Disease Stage | Enriched GO biological Processes |
| Colorectum | AD |  |
| Colorectum | SER |  |
| Colorectum | MSS |  |
| Colorectum | MSI-H |  |
| Colorectum | FAP |  |
| ∗Top 15 enriched GO BP terms are showed in the bar plot of each disease state in each tissue. Each row represents a significant GO biological process which is colored according to the -log10(p.adjust). |
| Page: 1 2 3 4 5 6 7 8 9 |
| GO ID | Tissue | Disease Stage | Description | Gene Ratio | Bg Ratio | pvalue | p.adjust | Count |
| GO:0006403 | Colorectum | AD | RNA localization | 71/3918 | 201/18723 | 1.54e-06 | 4.76e-05 | 71 |
| GO:0016049 | Colorectum | AD | cell growth | 143/3918 | 482/18723 | 2.83e-06 | 8.09e-05 | 143 |
| GO:0001558 | Colorectum | AD | regulation of cell growth | 124/3918 | 414/18723 | 7.67e-06 | 1.86e-04 | 124 |
| GO:0061614 | Colorectum | AD | pri-miRNA transcription by RNA polymerase II | 24/3918 | 55/18723 | 1.22e-04 | 1.78e-03 | 24 |
| GO:1902893 | Colorectum | AD | regulation of pri-miRNA transcription by RNA polymerase II | 23/3918 | 54/18723 | 2.60e-04 | 3.25e-03 | 23 |
| GO:0090257 | Colorectum | AD | regulation of muscle system process | 73/3918 | 252/18723 | 1.46e-03 | 1.24e-02 | 73 |
| GO:0048638 | Colorectum | AD | regulation of developmental growth | 92/3918 | 330/18723 | 1.48e-03 | 1.25e-02 | 92 |
| GO:0048588 | Colorectum | AD | developmental cell growth | 67/3918 | 234/18723 | 3.03e-03 | 2.25e-02 | 67 |
| GO:0045926 | Colorectum | AD | negative regulation of growth | 70/3918 | 249/18723 | 4.07e-03 | 2.83e-02 | 70 |
| GO:0043502 | Colorectum | AD | regulation of muscle adaptation | 31/3918 | 98/18723 | 8.45e-03 | 4.94e-02 | 31 |
| GO:00064031 | Colorectum | SER | RNA localization | 53/2897 | 201/18723 | 4.51e-05 | 1.13e-03 | 53 |
| GO:00902571 | Colorectum | SER | regulation of muscle system process | 60/2897 | 252/18723 | 3.28e-04 | 5.22e-03 | 60 |
| GO:00015581 | Colorectum | SER | regulation of cell growth | 90/2897 | 414/18723 | 4.00e-04 | 6.02e-03 | 90 |
| GO:00160491 | Colorectum | SER | cell growth | 100/2897 | 482/18723 | 1.07e-03 | 1.24e-02 | 100 |
| GO:00616141 | Colorectum | SER | pri-miRNA transcription by RNA polymerase II | 18/2897 | 55/18723 | 1.11e-03 | 1.28e-02 | 18 |
| GO:00435021 | Colorectum | SER | regulation of muscle adaptation | 27/2897 | 98/18723 | 1.54e-03 | 1.65e-02 | 27 |
| GO:19028931 | Colorectum | SER | regulation of pri-miRNA transcription by RNA polymerase II | 17/2897 | 54/18723 | 2.42e-03 | 2.30e-02 | 17 |
| GO:0043500 | Colorectum | SER | muscle adaptation | 31/2897 | 121/18723 | 2.58e-03 | 2.38e-02 | 31 |
| GO:0003012 | Colorectum | SER | muscle system process | 92/2897 | 452/18723 | 2.98e-03 | 2.63e-02 | 92 |
| GO:00459261 | Colorectum | SER | negative regulation of growth | 55/2897 | 249/18723 | 3.44e-03 | 2.92e-02 | 55 |
| Page: 1 2 3 4 5 6 7 8 9 10 11 12 13 14 15 16 17 18 19 20 21 22 23 24 |
| Pathway ID | Tissue | Disease Stage | Description | Gene Ratio | Bg Ratio | pvalue | p.adjust | qvalue | Count |
| Page: 1 |
Top |
Cell-cell communication analysis |
| Identification of potential cell-cell interactions between two cell types and their ligand-receptor pairs for different disease states |
| Ligand | Receptor | LRpair | Pathway | Tissue | Disease Stage |
| Page: 1 |
Top |
Single-cell gene regulatory network inference analysis |
| Find out the significant the regulons (TFs) and the target genes of each regulon across cell types for different disease states |
| TF | Cell Type | Tissue | Disease Stage | Target Gene | RSS | Regulon Activity |
| YY1 | AT2L | Lung | IAC | BATF,AKT1,TMSB4X, etc. | 4.94e-01 |  |
| ∗The dot plots of a searched regulon are shown for all cell subpopulations in each disease state of each tissue based on the regulon specific score inferred using pySCENIC and by calculating the average expression. |
| Page: 1 |
Top |
Somatic mutation of malignant transformation related genes |
| Annotation of somatic variants for genes involved in malignant transformation |
| Hugo Symbol | Variant Class | Variant Classification | dbSNP RS | HGVSc | HGVSp | HGVSp Short | SWISSPROT | BIOTYPE | SIFT | PolyPhen | Tumor Sample Barcode | Tissue | Histology | Sex | Age | Stage | Therapy Types | Drugs | Outcome |
| YY1 | SNV | Missense_Mutation | novel | c.869A>G | p.Asp290Gly | p.D290G | P25490 | protein_coding | tolerated(0.22) | benign(0.038) | TCGA-A7-A13H-01 | Breast | breast invasive carcinoma | Female | <65 | I/II | Hormone Therapy | anastrozole | PD |
| YY1 | SNV | Missense_Mutation | c.1032N>C | p.Gln344His | p.Q344H | P25490 | protein_coding | tolerated(0.09) | probably_damaging(0.955) | TCGA-D8-A1XK-01 | Breast | breast invasive carcinoma | Female | <65 | I/II | Chemotherapy | doxorubicine+cyclophosphamide | SD | |
| YY1 | SNV | Missense_Mutation | c.705N>C | p.Glu235Asp | p.E235D | P25490 | protein_coding | tolerated(0.15) | benign(0.006) | TCGA-C5-A1BK-01 | Cervix | cervical & endocervical cancer | Female | <65 | I/II | Unknown | Unknown | SD | |
| YY1 | SNV | Missense_Mutation | novel | c.941G>T | p.Arg314Ile | p.R314I | P25490 | protein_coding | deleterious(0) | probably_damaging(0.998) | TCGA-AG-A002-01 | Colorectum | rectum adenocarcinoma | Male | <65 | I/II | Unknown | Unknown | SD |
| YY1 | insertion | Frame_Shift_Ins | novel | c.682_683insA | p.Asp231ArgfsTer3 | p.D231Rfs*3 | P25490 | protein_coding | TCGA-AM-5821-01 | Colorectum | colon adenocarcinoma | Female | >=65 | I/II | Unknown | Unknown | SD | ||
| YY1 | SNV | Missense_Mutation | novel | c.743N>A | p.Pro248His | p.P248H | P25490 | protein_coding | deleterious(0.04) | possibly_damaging(0.706) | TCGA-A5-A0GI-01 | Endometrium | uterine corpus endometrioid carcinoma | Female | <65 | I/II | Unknown | Unknown | SD |
| YY1 | SNV | Missense_Mutation | novel | c.874G>A | p.Ala292Thr | p.A292T | P25490 | protein_coding | tolerated(0.42) | benign(0.012) | TCGA-AP-A1DK-01 | Endometrium | uterine corpus endometrioid carcinoma | Female | <65 | I/II | Unknown | Unknown | SD |
| YY1 | SNV | Missense_Mutation | novel | c.1088G>A | p.Arg363His | p.R363H | P25490 | protein_coding | deleterious(0) | probably_damaging(0.989) | TCGA-B5-A3FC-01 | Endometrium | uterine corpus endometrioid carcinoma | Female | <65 | I/II | Unknown | Unknown | SD |
| YY1 | SNV | Missense_Mutation | novel | c.724N>G | p.Ile242Val | p.I242V | P25490 | protein_coding | tolerated(0.39) | benign(0.001) | TCGA-D1-A175-01 | Endometrium | uterine corpus endometrioid carcinoma | Female | <65 | I/II | Chemotherapy | paclitaxel | SD |
| YY1 | SNV | Missense_Mutation | novel | c.947N>G | p.His316Arg | p.H316R | P25490 | protein_coding | deleterious(0) | probably_damaging(0.999) | TCGA-EO-A22U-01 | Endometrium | uterine corpus endometrioid carcinoma | Female | >=65 | I/II | Unknown | Unknown | SD |
| Page: 1 2 3 |
Top |
Related drugs of malignant transformation related genes |
| Identification of chemicals and drugs interact with genes involved in malignant transfromation |
| (DGIdb 4.0) |
| Entrez ID | Symbol | Category | Interaction Types | Drug Claim Name | Drug Name | PMIDs |
| 7528 | YY1 | TUMOR SUPPRESSOR, TRANSCRIPTION FACTOR COMPLEX, TRANSCRIPTION FACTOR | ANTISERUM | 10514482 |
| Page: 1 |

Copyright 2023-Present -The University of Texas Health Science Center at Houston |