
|
|||||
|
 | |
| |
| |
| |
| |
| |
|
Gene: YWHAZ |
Gene summary for YWHAZ |
| Gene information | Species | Human | Gene symbol | YWHAZ | Gene ID | 7534 |
| Gene name | tyrosine 3-monooxygenase/tryptophan 5-monooxygenase activation protein zeta | |
| Gene Alias | 14-3-3-zeta | |
| Cytomap | 8q22.3 | |
| Gene Type | protein-coding | GO ID | GO:0000165 | UniProtAcc | D0PNI1 |
Top |
Malignant transformation analysis |
| Identification of the aberrant gene expression in precancerous and cancerous lesions by comparing the gene expression of stem-like cells in diseased tissues with normal stem cells |
| Entrez ID | Symbol | Replicates | Species | Organ | Tissue | Adj P-value | Log2FC | Malignancy |
| 7534 | YWHAZ | GSM4909281 | Human | Breast | IDC | 1.53e-52 | 8.01e-01 | 0.21 |
| 7534 | YWHAZ | GSM4909285 | Human | Breast | IDC | 4.27e-06 | -7.90e-02 | 0.21 |
| 7534 | YWHAZ | GSM4909286 | Human | Breast | IDC | 2.31e-08 | 2.02e-01 | 0.1081 |
| 7534 | YWHAZ | GSM4909287 | Human | Breast | IDC | 1.39e-54 | 7.37e-01 | 0.2057 |
| 7534 | YWHAZ | GSM4909288 | Human | Breast | IDC | 4.52e-04 | 2.12e-01 | 0.0988 |
| 7534 | YWHAZ | GSM4909290 | Human | Breast | IDC | 1.63e-46 | 7.84e-01 | 0.2096 |
| 7534 | YWHAZ | GSM4909291 | Human | Breast | IDC | 1.46e-44 | 8.25e-01 | 0.1753 |
| 7534 | YWHAZ | GSM4909293 | Human | Breast | IDC | 2.43e-45 | 7.05e-01 | 0.1581 |
| 7534 | YWHAZ | GSM4909294 | Human | Breast | IDC | 3.49e-07 | 2.07e-01 | 0.2022 |
| 7534 | YWHAZ | GSM4909295 | Human | Breast | IDC | 5.60e-04 | 3.82e-01 | 0.0898 |
| 7534 | YWHAZ | GSM4909296 | Human | Breast | IDC | 2.44e-09 | -1.93e-01 | 0.1524 |
| 7534 | YWHAZ | GSM4909297 | Human | Breast | IDC | 1.85e-14 | -1.69e-02 | 0.1517 |
| 7534 | YWHAZ | GSM4909298 | Human | Breast | IDC | 3.28e-03 | 2.20e-01 | 0.1551 |
| 7534 | YWHAZ | GSM4909301 | Human | Breast | IDC | 8.77e-05 | 3.41e-01 | 0.1577 |
| 7534 | YWHAZ | GSM4909302 | Human | Breast | IDC | 2.82e-03 | 1.80e-01 | 0.1545 |
| 7534 | YWHAZ | GSM4909304 | Human | Breast | IDC | 4.73e-43 | 6.66e-01 | 0.1636 |
| 7534 | YWHAZ | GSM4909305 | Human | Breast | IDC | 2.98e-09 | 4.31e-01 | 0.0436 |
| 7534 | YWHAZ | GSM4909306 | Human | Breast | IDC | 7.65e-34 | 6.50e-01 | 0.1564 |
| 7534 | YWHAZ | GSM4909308 | Human | Breast | IDC | 5.48e-19 | 5.08e-01 | 0.158 |
| 7534 | YWHAZ | GSM4909309 | Human | Breast | IDC | 1.21e-09 | 2.56e-01 | 0.0483 |
| Page: 1 2 3 4 5 6 7 8 9 10 11 12 13 14 15 |
| Tissue | Expression Dynamics | Abbreviation |
| Breast | 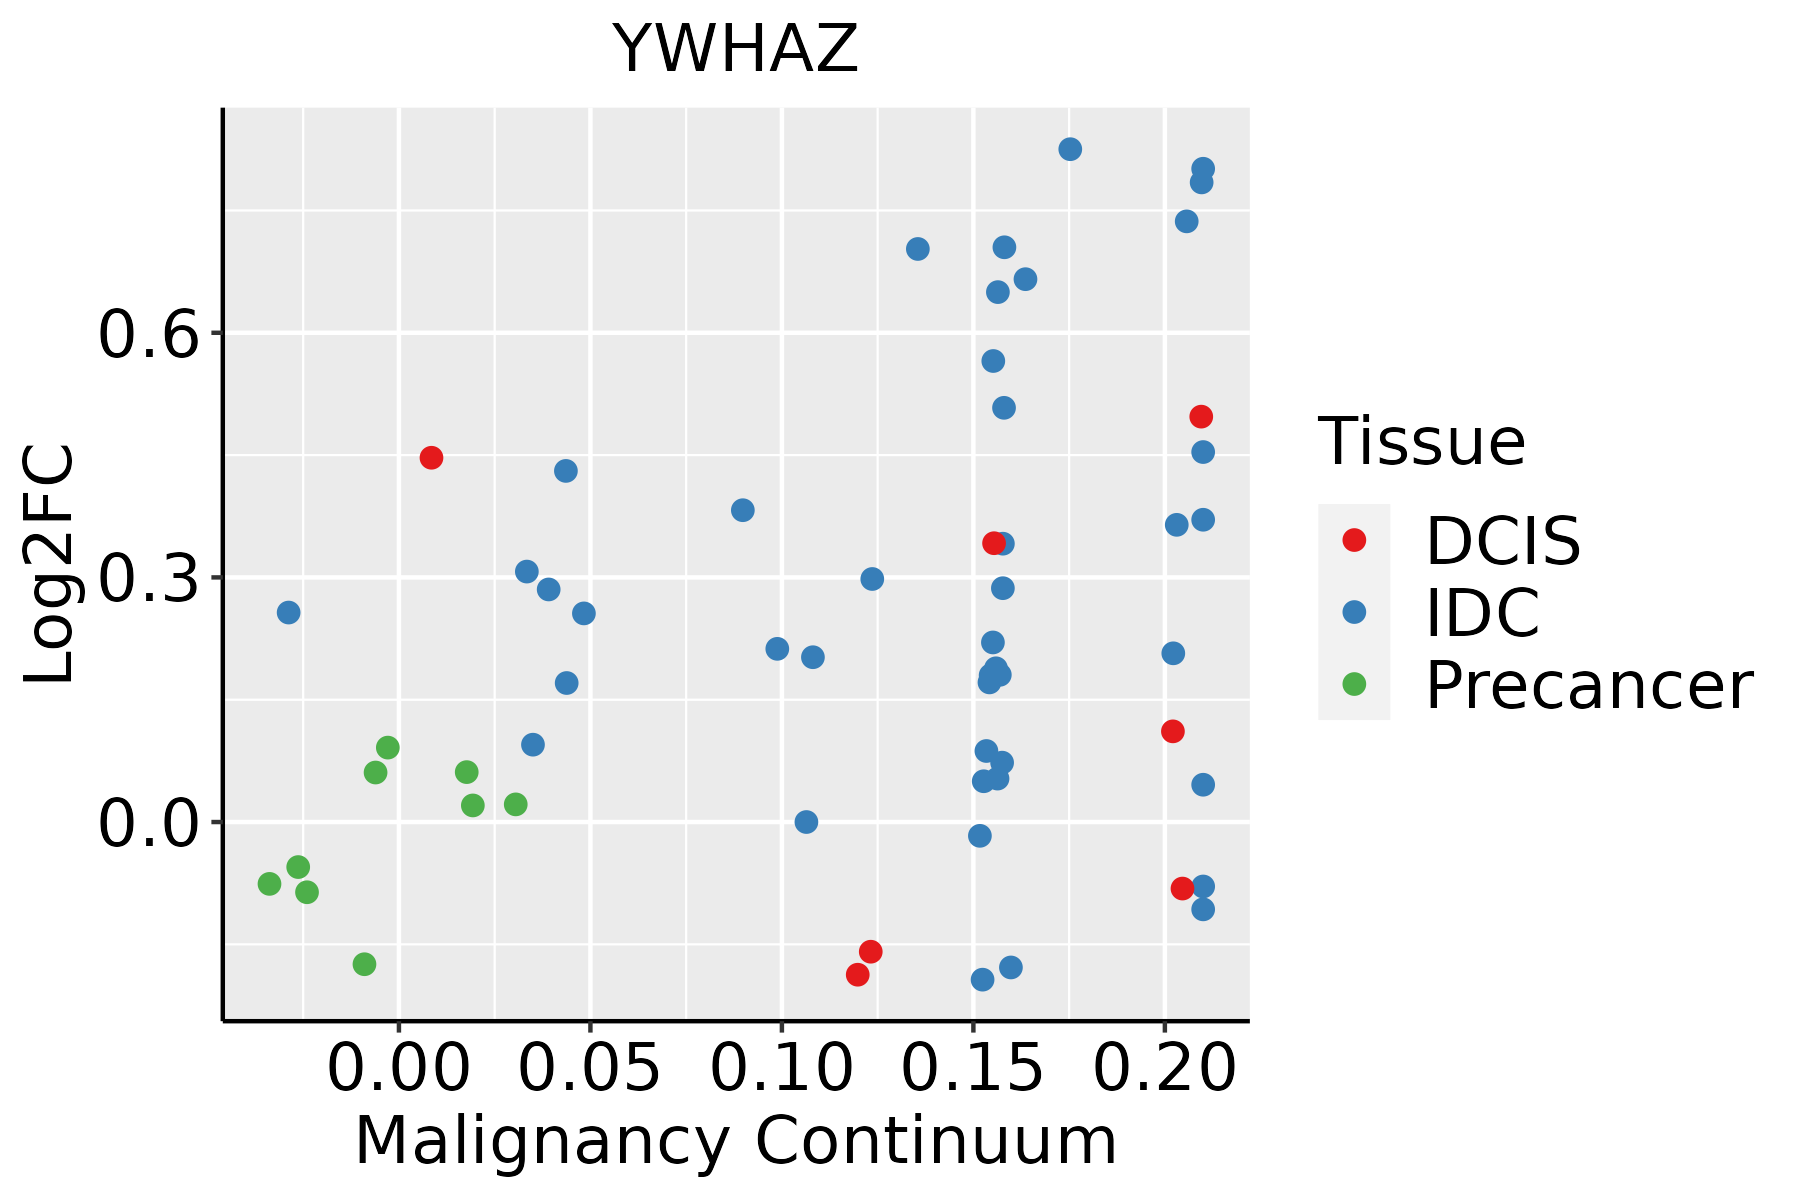 | IDC: Invasive ductal carcinoma |
| DCIS: Ductal carcinoma in situ | ||
| Precancer(BRCA1-mut): Precancerous lesion from BRCA1 mutation carriers | ||
| Colorectum (GSE201348) |  | FAP: Familial adenomatous polyposis |
| CRC: Colorectal cancer | ||
| Colorectum (HTA11) |  | AD: Adenomas |
| SER: Sessile serrated lesions | ||
| MSI-H: Microsatellite-high colorectal cancer | ||
| MSS: Microsatellite stable colorectal cancer | ||
| Esophagus |  | ESCC: Esophageal squamous cell carcinoma |
| HGIN: High-grade intraepithelial neoplasias | ||
| LGIN: Low-grade intraepithelial neoplasias | ||
| GC | 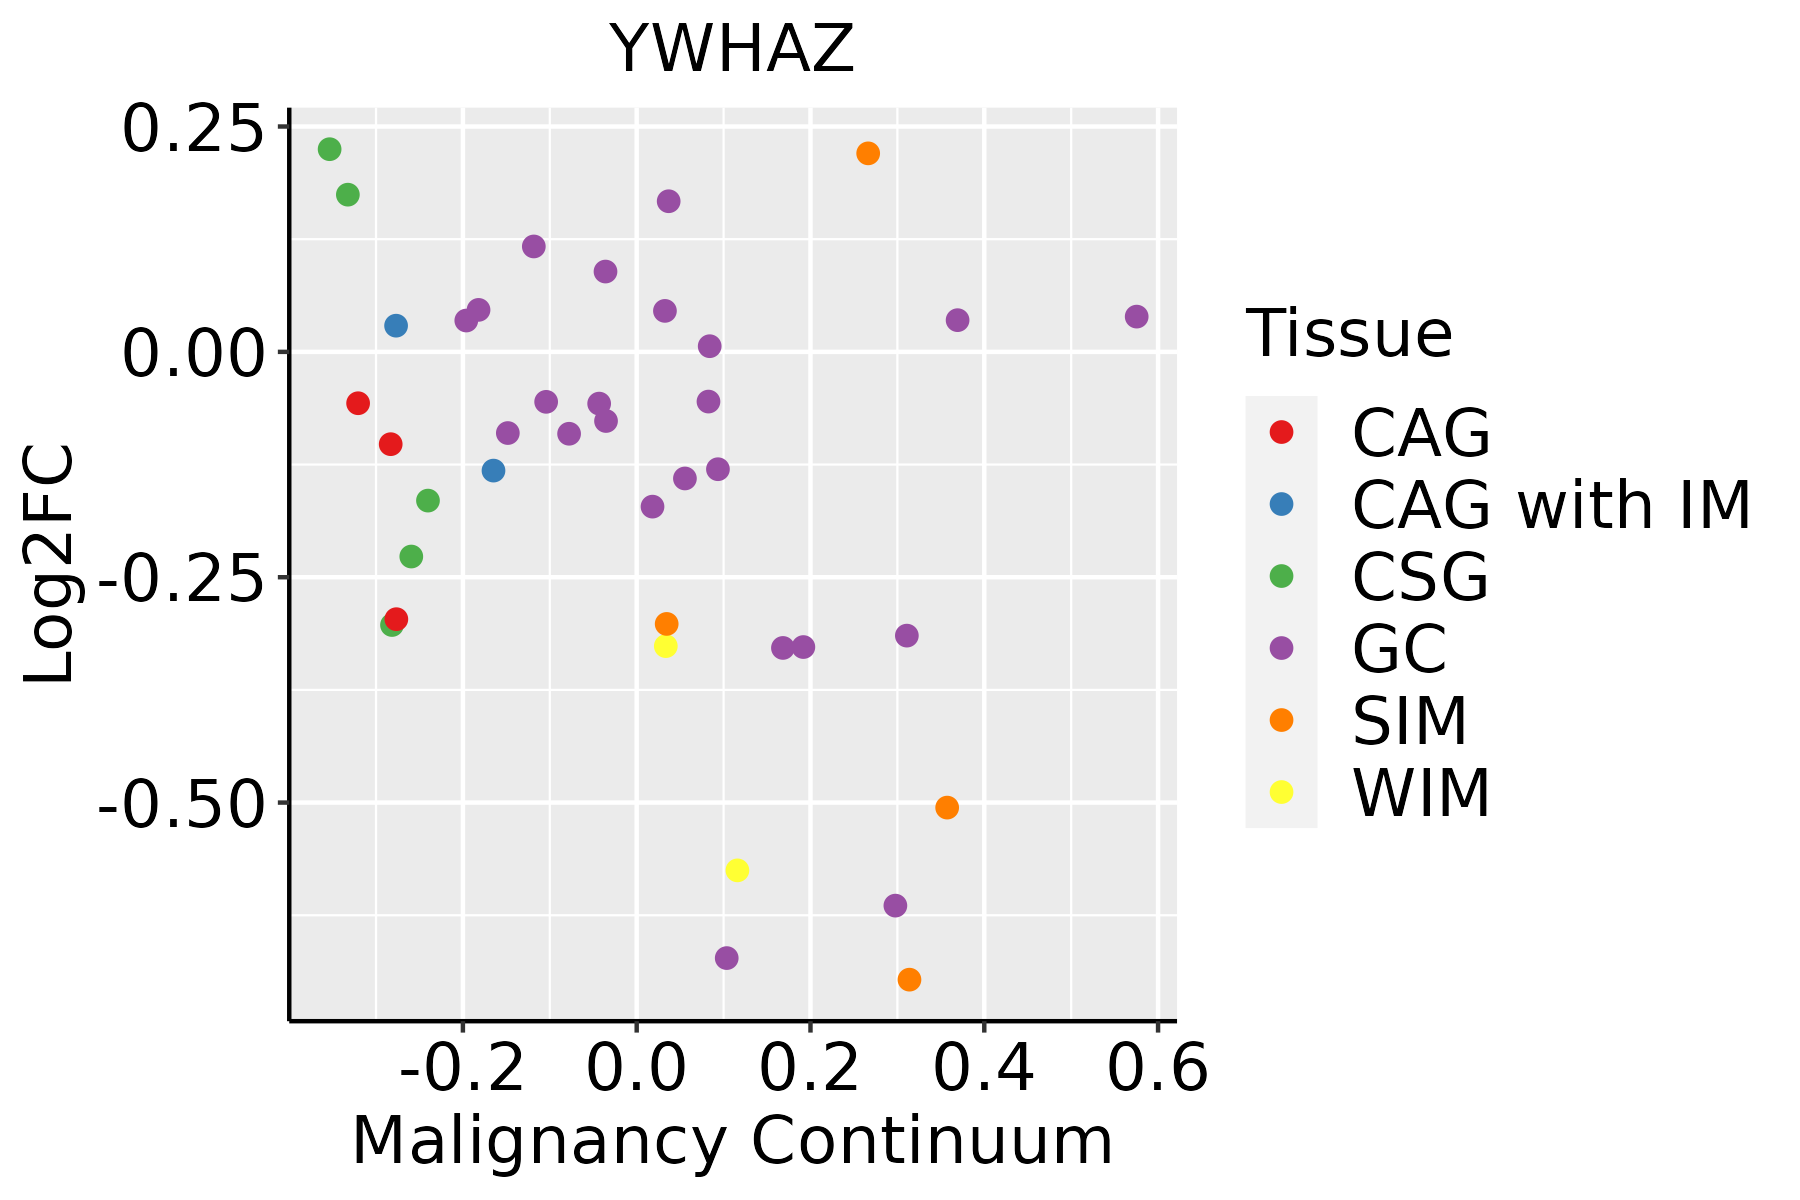 | CAG: Chronic atrophic gastritis |
| CAG with IM: Chronic atrophic gastritis with intestinal metaplasia | ||
| CSG: Chronic superficial gastritis | ||
| GC: Gastric cancer | ||
| SIM: Severe intestinal metaplasia | ||
| WIM: Wild intestinal metaplasia | ||
| Liver | 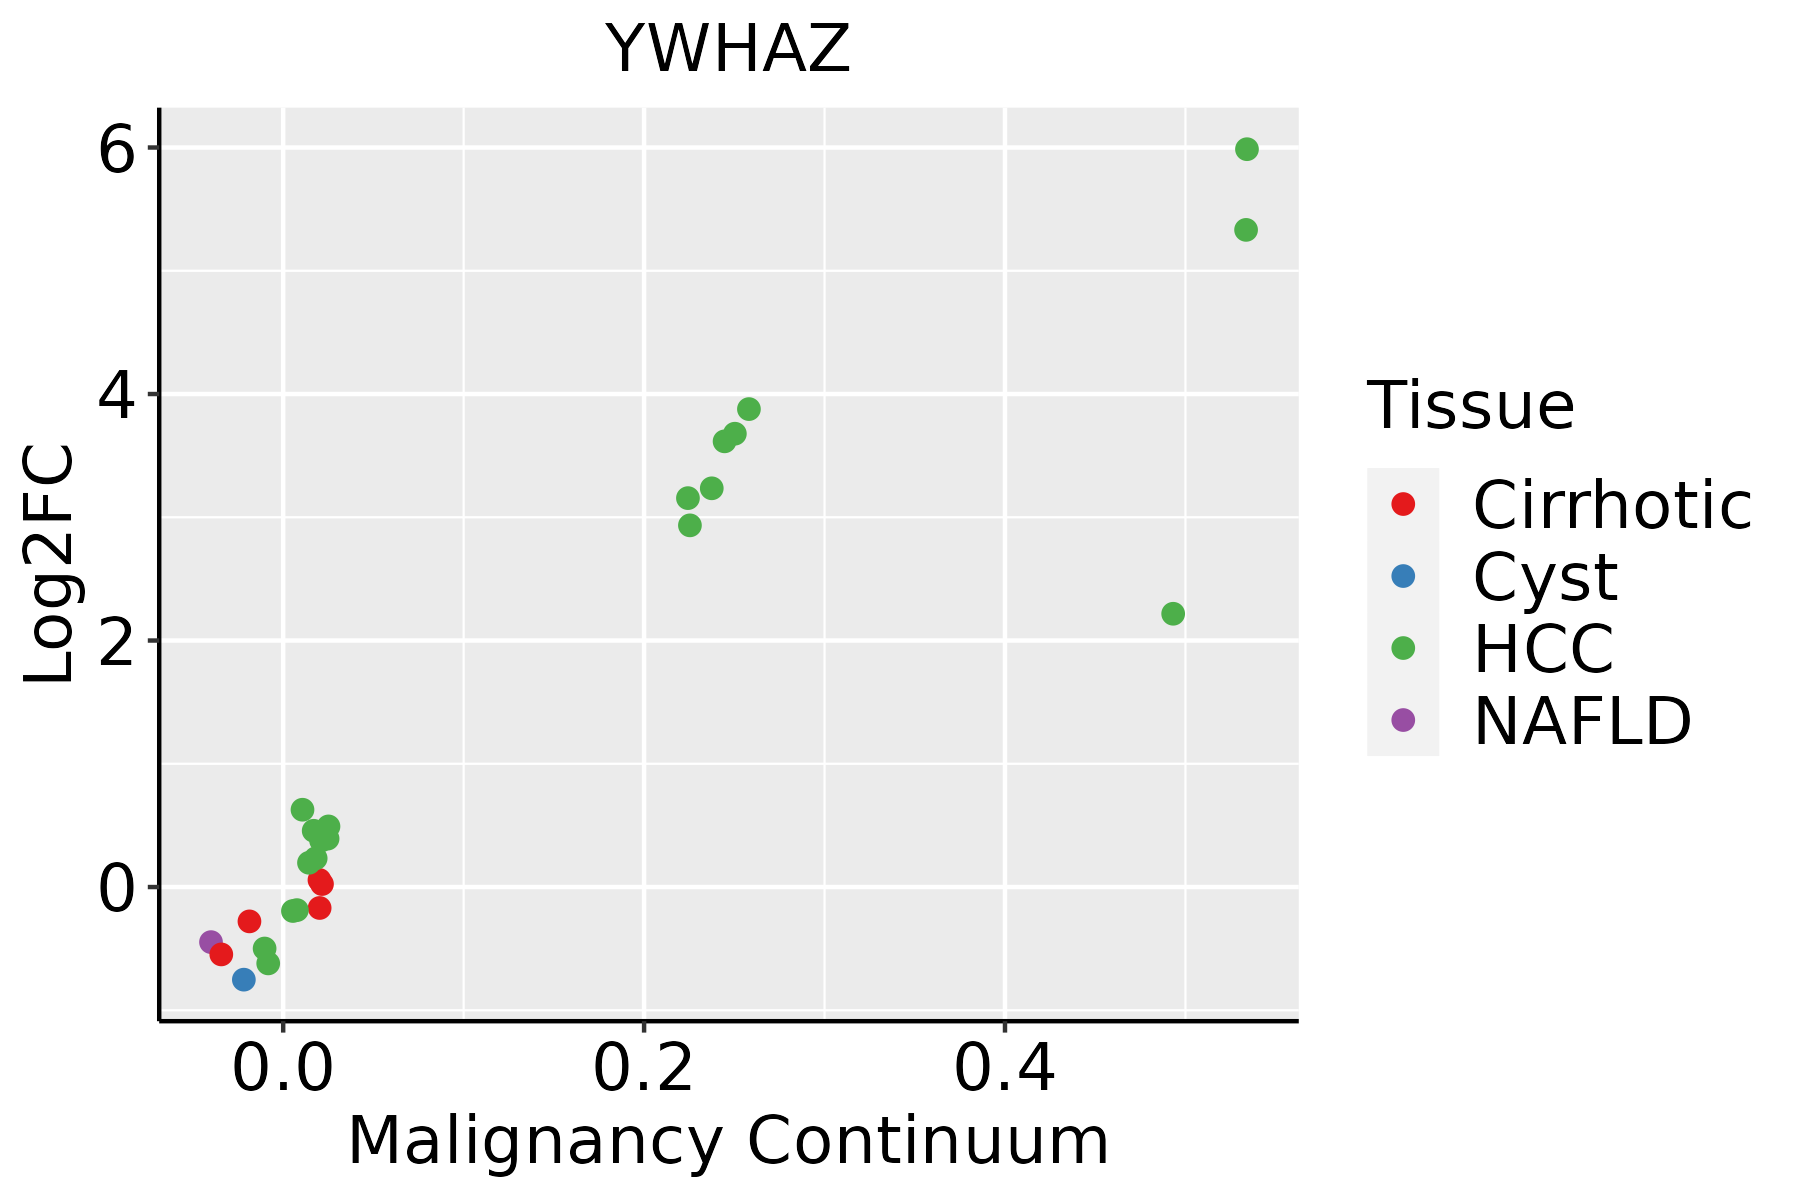 | HCC: Hepatocellular carcinoma |
| NAFLD: Non-alcoholic fatty liver disease | ||
| Oral Cavity |  | EOLP: Erosive Oral lichen planus |
| LP: leukoplakia | ||
| NEOLP: Non-erosive oral lichen planus | ||
| OSCC: Oral squamous cell carcinoma | ||
| Prostate |  | BPH: Benign Prostatic Hyperplasia |
| Skin | 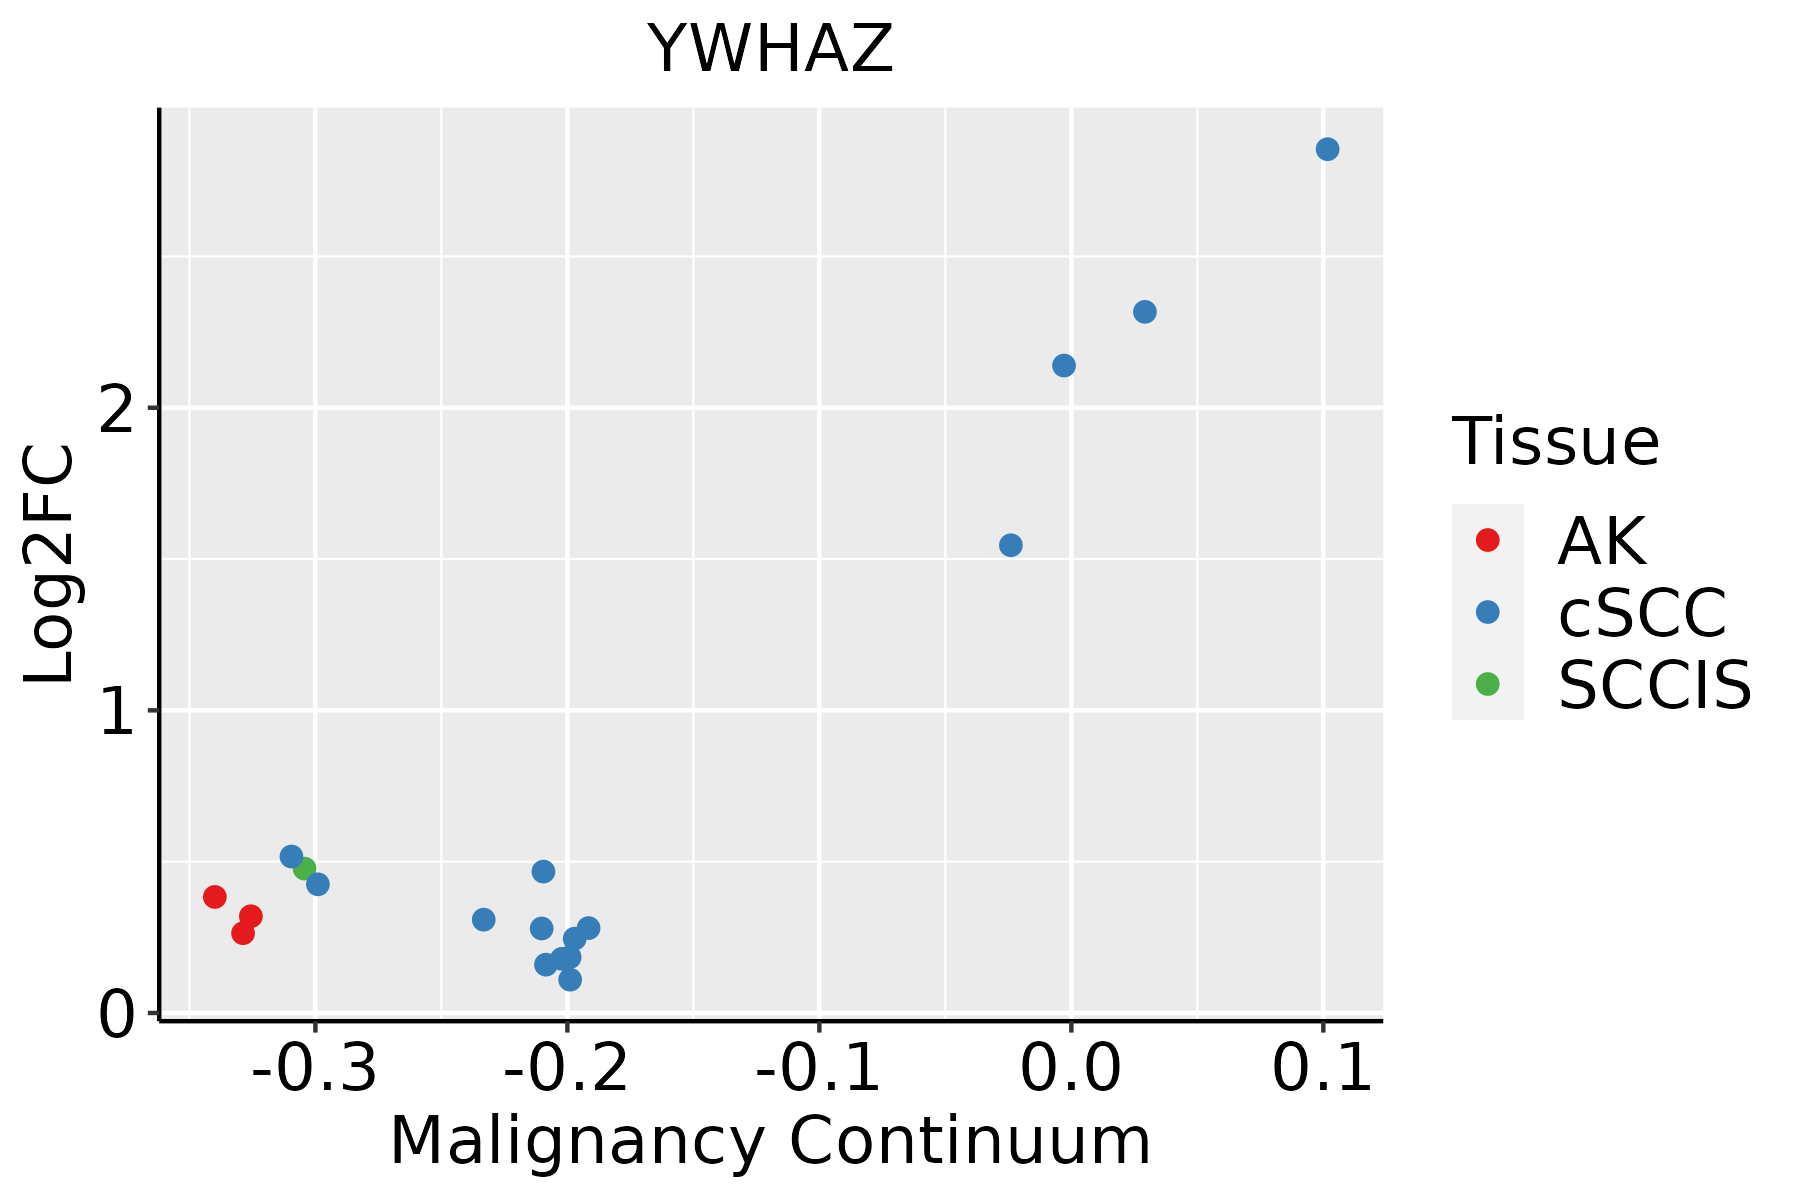 | AK: Actinic keratosis |
| cSCC: Cutaneous squamous cell carcinoma | ||
| SCCIS:squamous cell carcinoma in situ | ||
| Thyroid |  | ATC: Anaplastic thyroid cancer |
| HT: Hashimoto's thyroiditis | ||
| PTC: Papillary thyroid cancer |
| ∗log2FC in expression of this searched gene in stem-like cells from each diseased tissue sample relative to stem-like cells in normal samples in each tissue plotted against the malignancy continuum. Samples are colored based on if they are from different disease stage. |
Top |
Malignant transformation related pathway analysis |
| Find out the enriched GO biological processes and KEGG pathways involved in transition from healthy to precancer to cancer |
| Tissue | Disease Stage | Enriched GO biological Processes |
| Colorectum | AD |  |
| Colorectum | SER |  |
| Colorectum | MSS |  |
| Colorectum | MSI-H |  |
| Colorectum | FAP |  |
| ∗Top 15 enriched GO BP terms are showed in the bar plot of each disease state in each tissue. Each row represents a significant GO biological process which is colored according to the -log10(p.adjust). |
| Page: 1 2 3 4 5 6 7 8 9 |
| GO ID | Tissue | Disease Stage | Description | Gene Ratio | Bg Ratio | pvalue | p.adjust | Count |
| GO:00066059 | Breast | Precancer | protein targeting | 33/1080 | 314/18723 | 6.50e-04 | 7.99e-03 | 33 |
| GO:00351486 | Breast | Precancer | tube formation | 19/1080 | 148/18723 | 8.79e-04 | 1.01e-02 | 19 |
| GO:000660514 | Breast | IDC | protein targeting | 43/1434 | 314/18723 | 1.44e-04 | 2.53e-03 | 43 |
| GO:00303244 | Breast | IDC | lung development | 28/1434 | 177/18723 | 1.90e-04 | 3.15e-03 | 28 |
| GO:00303234 | Breast | IDC | respiratory tube development | 28/1434 | 181/18723 | 2.78e-04 | 4.26e-03 | 28 |
| GO:00605412 | Breast | IDC | respiratory system development | 30/1434 | 203/18723 | 3.85e-04 | 5.40e-03 | 30 |
| GO:00703713 | Breast | IDC | ERK1 and ERK2 cascade | 43/1434 | 330/18723 | 4.28e-04 | 5.84e-03 | 43 |
| GO:003514812 | Breast | IDC | tube formation | 23/1434 | 148/18723 | 8.79e-04 | 1.02e-02 | 23 |
| GO:00703722 | Breast | IDC | regulation of ERK1 and ERK2 cascade | 37/1434 | 309/18723 | 4.53e-03 | 3.49e-02 | 37 |
| GO:000660523 | Breast | DCIS | protein targeting | 43/1390 | 314/18723 | 7.17e-05 | 1.41e-03 | 43 |
| GO:003032413 | Breast | DCIS | lung development | 27/1390 | 177/18723 | 2.73e-04 | 4.09e-03 | 27 |
| GO:003032313 | Breast | DCIS | respiratory tube development | 27/1390 | 181/18723 | 3.93e-04 | 5.41e-03 | 27 |
| GO:007037111 | Breast | DCIS | ERK1 and ERK2 cascade | 41/1390 | 330/18723 | 8.11e-04 | 9.32e-03 | 41 |
| GO:006054111 | Breast | DCIS | respiratory system development | 28/1390 | 203/18723 | 1.10e-03 | 1.19e-02 | 28 |
| GO:003514821 | Breast | DCIS | tube formation | 21/1390 | 148/18723 | 3.08e-03 | 2.62e-02 | 21 |
| GO:0051656 | Colorectum | AD | establishment of organelle localization | 131/3918 | 390/18723 | 3.00e-09 | 2.06e-07 | 131 |
| GO:0006605 | Colorectum | AD | protein targeting | 105/3918 | 314/18723 | 1.39e-07 | 6.44e-06 | 105 |
| GO:0035148 | Colorectum | AD | tube formation | 45/3918 | 148/18723 | 4.13e-03 | 2.87e-02 | 45 |
| GO:0050808 | Colorectum | AD | synapse organization | 112/3918 | 426/18723 | 4.25e-03 | 2.92e-02 | 112 |
| GO:0050807 | Colorectum | AD | regulation of synapse organization | 60/3918 | 211/18723 | 5.67e-03 | 3.64e-02 | 60 |
| Page: 1 2 3 4 5 6 7 8 9 10 |
| Pathway ID | Tissue | Disease Stage | Description | Gene Ratio | Bg Ratio | pvalue | p.adjust | qvalue | Count |
| hsa052036 | Breast | Precancer | Viral carcinogenesis | 27/684 | 204/8465 | 7.19e-03 | 4.06e-02 | 3.11e-02 | 27 |
| hsa0520312 | Breast | Precancer | Viral carcinogenesis | 27/684 | 204/8465 | 7.19e-03 | 4.06e-02 | 3.11e-02 | 27 |
| hsa0520322 | Breast | IDC | Viral carcinogenesis | 34/867 | 204/8465 | 2.82e-03 | 1.86e-02 | 1.39e-02 | 34 |
| hsa0520332 | Breast | IDC | Viral carcinogenesis | 34/867 | 204/8465 | 2.82e-03 | 1.86e-02 | 1.39e-02 | 34 |
| hsa0520341 | Breast | DCIS | Viral carcinogenesis | 34/846 | 204/8465 | 1.88e-03 | 1.27e-02 | 9.33e-03 | 34 |
| hsa052035 | Breast | DCIS | Viral carcinogenesis | 34/846 | 204/8465 | 1.88e-03 | 1.27e-02 | 9.33e-03 | 34 |
| hsa05160 | Colorectum | AD | Hepatitis C | 54/2092 | 157/8465 | 3.87e-03 | 1.96e-02 | 1.25e-02 | 54 |
| hsa051601 | Colorectum | AD | Hepatitis C | 54/2092 | 157/8465 | 3.87e-03 | 1.96e-02 | 1.25e-02 | 54 |
| hsa051602 | Colorectum | MSS | Hepatitis C | 52/1875 | 157/8465 | 9.29e-04 | 5.58e-03 | 3.42e-03 | 52 |
| hsa04390 | Colorectum | MSS | Hippo signaling pathway | 48/1875 | 157/8465 | 8.32e-03 | 3.10e-02 | 1.90e-02 | 48 |
| hsa05161 | Colorectum | MSS | Hepatitis B | 48/1875 | 162/8465 | 1.53e-02 | 4.93e-02 | 3.02e-02 | 48 |
| hsa051603 | Colorectum | MSS | Hepatitis C | 52/1875 | 157/8465 | 9.29e-04 | 5.58e-03 | 3.42e-03 | 52 |
| hsa043901 | Colorectum | MSS | Hippo signaling pathway | 48/1875 | 157/8465 | 8.32e-03 | 3.10e-02 | 1.90e-02 | 48 |
| hsa051611 | Colorectum | MSS | Hepatitis B | 48/1875 | 162/8465 | 1.53e-02 | 4.93e-02 | 3.02e-02 | 48 |
| hsa043902 | Colorectum | FAP | Hippo signaling pathway | 41/1404 | 157/8465 | 1.49e-03 | 7.91e-03 | 4.81e-03 | 41 |
| hsa04151 | Colorectum | FAP | PI3K-Akt signaling pathway | 75/1404 | 354/8465 | 1.23e-02 | 4.19e-02 | 2.55e-02 | 75 |
| hsa04110 | Colorectum | FAP | Cell cycle | 37/1404 | 157/8465 | 1.44e-02 | 4.77e-02 | 2.90e-02 | 37 |
| hsa043903 | Colorectum | FAP | Hippo signaling pathway | 41/1404 | 157/8465 | 1.49e-03 | 7.91e-03 | 4.81e-03 | 41 |
| hsa041511 | Colorectum | FAP | PI3K-Akt signaling pathway | 75/1404 | 354/8465 | 1.23e-02 | 4.19e-02 | 2.55e-02 | 75 |
| hsa041101 | Colorectum | FAP | Cell cycle | 37/1404 | 157/8465 | 1.44e-02 | 4.77e-02 | 2.90e-02 | 37 |
| Page: 1 2 3 4 5 6 |
Top |
Cell-cell communication analysis |
| Identification of potential cell-cell interactions between two cell types and their ligand-receptor pairs for different disease states |
| Ligand | Receptor | LRpair | Pathway | Tissue | Disease Stage |
| Page: 1 |
Top |
Single-cell gene regulatory network inference analysis |
| Find out the significant the regulons (TFs) and the target genes of each regulon across cell types for different disease states |
| TF | Cell Type | Tissue | Disease Stage | Target Gene | RSS | Regulon Activity |
| ∗The dot plots of a searched regulon are shown for all cell subpopulations in each disease state of each tissue based on the regulon specific score inferred using pySCENIC and by calculating the average expression. |
| Page: 1 |
Top |
Somatic mutation of malignant transformation related genes |
| Annotation of somatic variants for genes involved in malignant transformation |
| Hugo Symbol | Variant Class | Variant Classification | dbSNP RS | HGVSc | HGVSp | HGVSp Short | SWISSPROT | BIOTYPE | SIFT | PolyPhen | Tumor Sample Barcode | Tissue | Histology | Sex | Age | Stage | Therapy Types | Drugs | Outcome |
| YWHAZ | SNV | Missense_Mutation | c.697N>G | p.Gln233Glu | p.Q233E | P63104 | protein_coding | tolerated_low_confidence(0.18) | benign(0.052) | TCGA-AC-A23H-01 | Breast | breast invasive carcinoma | Female | >=65 | I/II | Unknown | Unknown | PD | |
| YWHAZ | SNV | Missense_Mutation | novel | c.629N>T | p.Ser210Leu | p.S210L | P63104 | protein_coding | deleterious_low_confidence(0.04) | possibly_damaging(0.5) | TCGA-AN-A046-01 | Breast | breast invasive carcinoma | Female | >=65 | I/II | Unknown | Unknown | SD |
| YWHAZ | SNV | Missense_Mutation | c.98G>C | p.Gly33Ala | p.G33A | P63104 | protein_coding | deleterious_low_confidence(0.03) | benign(0.307) | TCGA-C8-A26V-01 | Breast | breast invasive carcinoma | Female | <65 | III/IV | Hormone Therapy | tamoxiphen | CR | |
| YWHAZ | SNV | Missense_Mutation | c.451N>C | p.Glu151Gln | p.E151Q | P63104 | protein_coding | tolerated_low_confidence(0.07) | benign(0.035) | TCGA-C8-A274-01 | Breast | breast invasive carcinoma | Female | <65 | I/II | Hormone Therapy | tamoxiphen | SD | |
| YWHAZ | SNV | Missense_Mutation | novel | c.289N>A | p.Val97Ile | p.V97I | P63104 | protein_coding | tolerated_low_confidence(0.45) | possibly_damaging(0.632) | TCGA-2W-A8YY-01 | Cervix | cervical & endocervical cancer | Female | <65 | I/II | Chemotherapy | cisplatin | CR |
| YWHAZ | SNV | Missense_Mutation | c.684N>C | p.Trp228Cys | p.W228C | P63104 | protein_coding | deleterious_low_confidence(0) | probably_damaging(1) | TCGA-C5-A1BQ-01 | Cervix | cervical & endocervical cancer | Female | >=65 | III/IV | Chemotherapy | cisplatin | CR | |
| YWHAZ | SNV | Missense_Mutation | novel | c.629N>T | p.Ser210Leu | p.S210L | P63104 | protein_coding | deleterious_low_confidence(0.04) | possibly_damaging(0.5) | TCGA-DS-A1OB-01 | Cervix | cervical & endocervical cancer | Female | <65 | I/II | Chemotherapy | carboplatin | PD |
| YWHAZ | SNV | Missense_Mutation | c.13N>C | p.Glu5Gln | p.E5Q | P63104 | protein_coding | tolerated_low_confidence(0.09) | benign(0.031) | TCGA-Q1-A73P-01 | Cervix | cervical & endocervical cancer | Female | <65 | I/II | Unknown | Unknown | SD | |
| YWHAZ | SNV | Missense_Mutation | novel | c.505N>T | p.Gly169Cys | p.G169C | P63104 | protein_coding | deleterious_low_confidence(0.01) | probably_damaging(0.997) | TCGA-VS-A953-01 | Cervix | cervical & endocervical cancer | Female | <65 | I/II | Unknown | Unknown | PD |
| YWHAZ | insertion | Frame_Shift_Ins | novel | c.225_226insA | p.Gln76ThrfsTer12 | p.Q76Tfs*12 | P63104 | protein_coding | TCGA-DS-A0VM-01 | Cervix | cervical & endocervical cancer | Female | <65 | I/II | Chemotherapy | cisplatin | PD |
| Page: 1 2 3 4 |
Top |
Related drugs of malignant transformation related genes |
| Identification of chemicals and drugs interact with genes involved in malignant transfromation |
| (DGIdb 4.0) |
| Entrez ID | Symbol | Category | Interaction Types | Drug Claim Name | Drug Name | PMIDs |
| Page: 1 |

Copyright 2023-Present -The University of Texas Health Science Center at Houston |