
|
|||||
|
 | |
| |
| |
| |
| |
| |
|
Gene: YWHAB |
Gene summary for YWHAB |
| Gene information | Species | Human | Gene symbol | YWHAB | Gene ID | 7529 |
| Gene name | tyrosine 3-monooxygenase/tryptophan 5-monooxygenase activation protein beta | |
| Gene Alias | GW128 | |
| Cytomap | 20q13.12 | |
| Gene Type | protein-coding | GO ID | GO:0006139 | UniProtAcc | P31946 |
Top |
Malignant transformation analysis |
| Identification of the aberrant gene expression in precancerous and cancerous lesions by comparing the gene expression of stem-like cells in diseased tissues with normal stem cells |
| Entrez ID | Symbol | Replicates | Species | Organ | Tissue | Adj P-value | Log2FC | Malignancy |
| 7529 | YWHAB | GSM4909282 | Human | Breast | IDC | 5.84e-09 | 3.83e-01 | -0.0288 |
| 7529 | YWHAB | GSM4909285 | Human | Breast | IDC | 2.28e-03 | 1.98e-01 | 0.21 |
| 7529 | YWHAB | GSM4909287 | Human | Breast | IDC | 4.26e-08 | 2.07e-01 | 0.2057 |
| 7529 | YWHAB | GSM4909288 | Human | Breast | IDC | 6.69e-03 | -1.51e-01 | 0.0988 |
| 7529 | YWHAB | GSM4909291 | Human | Breast | IDC | 1.65e-03 | 3.07e-01 | 0.1753 |
| 7529 | YWHAB | GSM4909293 | Human | Breast | IDC | 9.71e-24 | 5.42e-01 | 0.1581 |
| 7529 | YWHAB | GSM4909294 | Human | Breast | IDC | 3.97e-06 | 1.23e-01 | 0.2022 |
| 7529 | YWHAB | GSM4909296 | Human | Breast | IDC | 8.76e-08 | -5.96e-02 | 0.1524 |
| 7529 | YWHAB | GSM4909297 | Human | Breast | IDC | 6.75e-20 | -3.27e-02 | 0.1517 |
| 7529 | YWHAB | GSM4909298 | Human | Breast | IDC | 1.77e-08 | 3.49e-01 | 0.1551 |
| 7529 | YWHAB | GSM4909301 | Human | Breast | IDC | 1.01e-79 | 9.06e-01 | 0.1577 |
| 7529 | YWHAB | GSM4909302 | Human | Breast | IDC | 1.93e-03 | 4.86e-02 | 0.1545 |
| 7529 | YWHAB | GSM4909304 | Human | Breast | IDC | 4.92e-02 | 2.14e-01 | 0.1636 |
| 7529 | YWHAB | GSM4909307 | Human | Breast | IDC | 1.62e-02 | 2.43e-01 | 0.1569 |
| 7529 | YWHAB | GSM4909308 | Human | Breast | IDC | 2.11e-17 | 4.72e-01 | 0.158 |
| 7529 | YWHAB | GSM4909309 | Human | Breast | IDC | 1.30e-11 | 1.14e-01 | 0.0483 |
| 7529 | YWHAB | GSM4909311 | Human | Breast | IDC | 1.35e-38 | -2.88e-01 | 0.1534 |
| 7529 | YWHAB | GSM4909312 | Human | Breast | IDC | 2.52e-14 | -5.99e-03 | 0.1552 |
| 7529 | YWHAB | GSM4909313 | Human | Breast | IDC | 9.53e-05 | -5.27e-02 | 0.0391 |
| 7529 | YWHAB | GSM4909316 | Human | Breast | IDC | 5.07e-07 | 8.49e-02 | 0.21 |
| Page: 1 2 3 4 5 6 7 8 9 10 11 12 13 14 15 16 17 |
| Tissue | Expression Dynamics | Abbreviation |
| Breast | 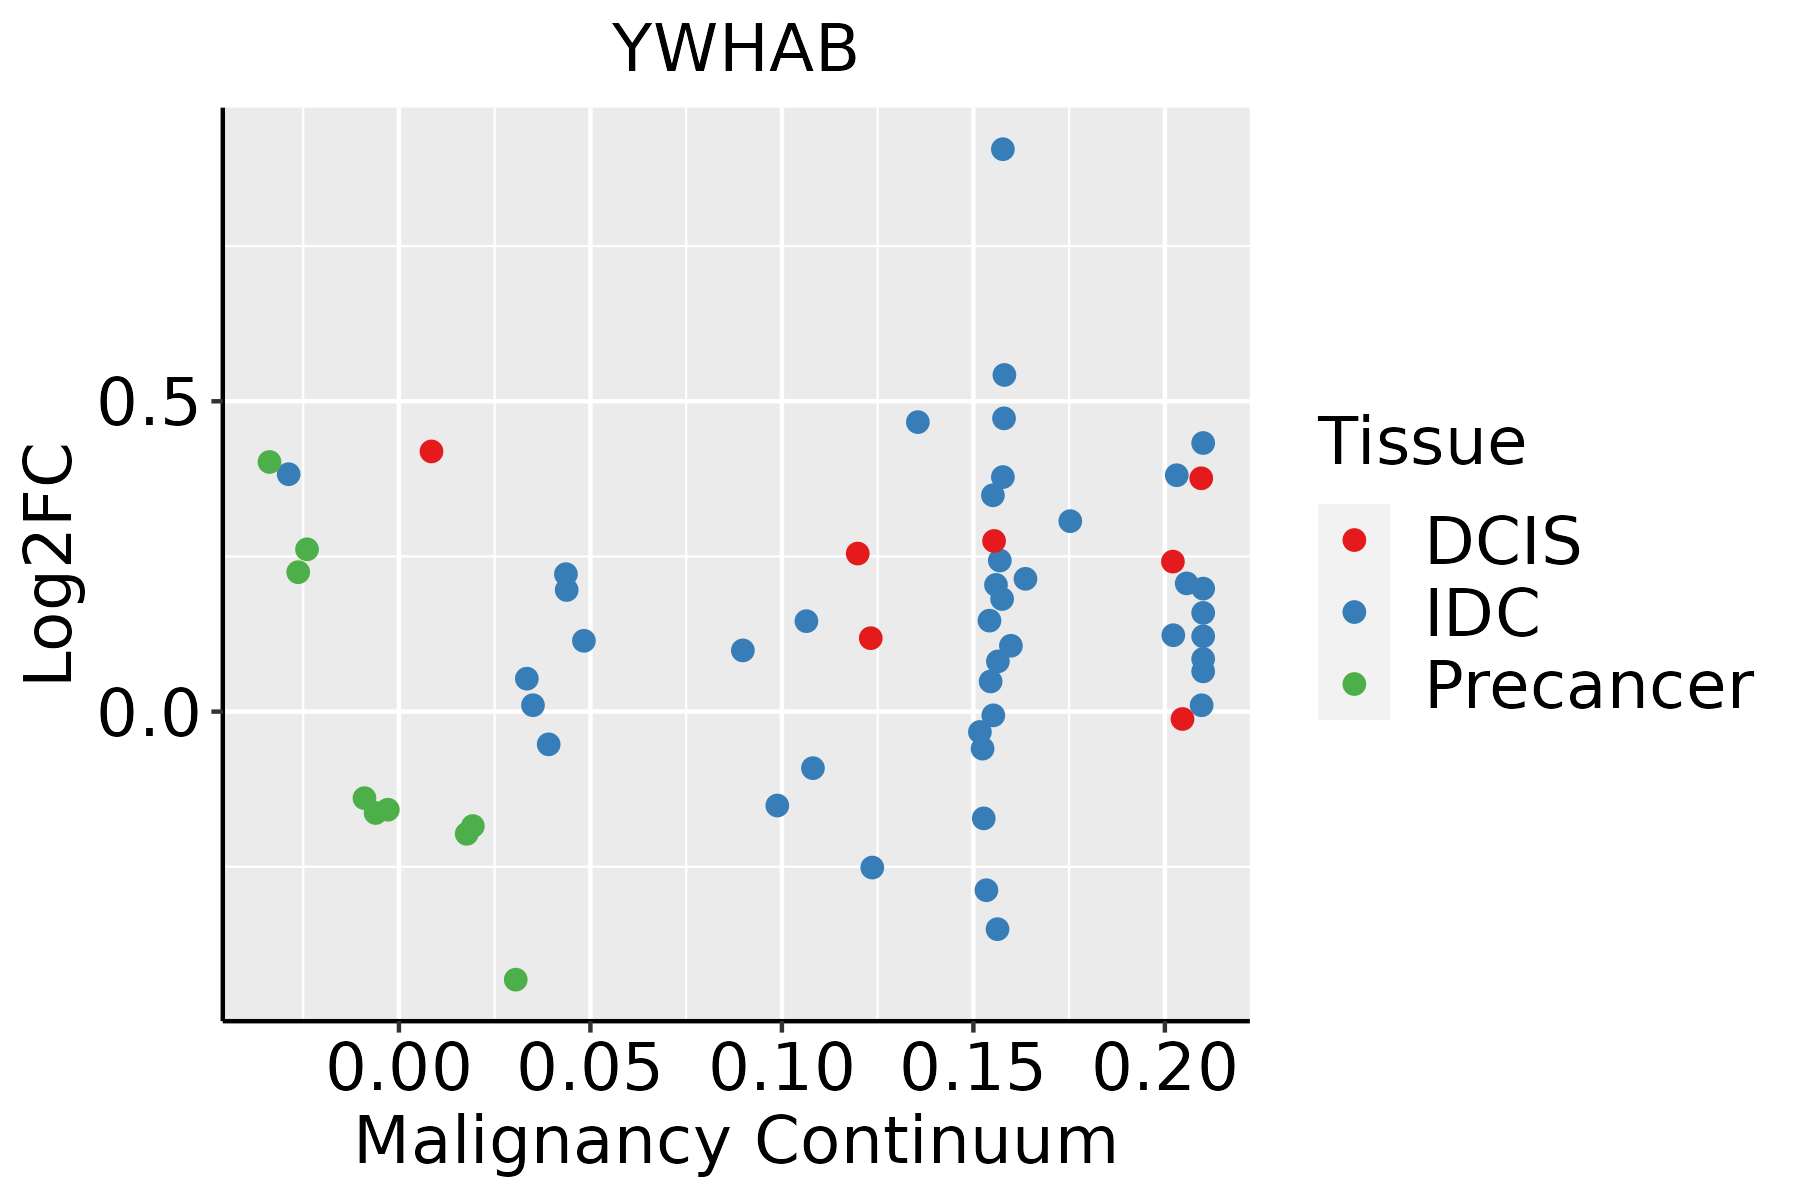 | IDC: Invasive ductal carcinoma |
| DCIS: Ductal carcinoma in situ | ||
| Precancer(BRCA1-mut): Precancerous lesion from BRCA1 mutation carriers | ||
| Cervix |  | CC: Cervix cancer |
| HSIL_HPV: HPV-infected high-grade squamous intraepithelial lesions | ||
| N_HPV: HPV-infected normal cervix | ||
| Colorectum (GSE201348) |  | FAP: Familial adenomatous polyposis |
| CRC: Colorectal cancer | ||
| Colorectum (HTA11) |  | AD: Adenomas |
| SER: Sessile serrated lesions | ||
| MSI-H: Microsatellite-high colorectal cancer | ||
| MSS: Microsatellite stable colorectal cancer | ||
| Endometrium |  | AEH: Atypical endometrial hyperplasia |
| EEC: Endometrioid Cancer | ||
| Esophagus |  | ESCC: Esophageal squamous cell carcinoma |
| HGIN: High-grade intraepithelial neoplasias | ||
| LGIN: Low-grade intraepithelial neoplasias | ||
| GC |  | CAG: Chronic atrophic gastritis |
| CAG with IM: Chronic atrophic gastritis with intestinal metaplasia | ||
| CSG: Chronic superficial gastritis | ||
| GC: Gastric cancer | ||
| SIM: Severe intestinal metaplasia | ||
| WIM: Wild intestinal metaplasia | ||
| Liver |  | HCC: Hepatocellular carcinoma |
| NAFLD: Non-alcoholic fatty liver disease | ||
| Lung | 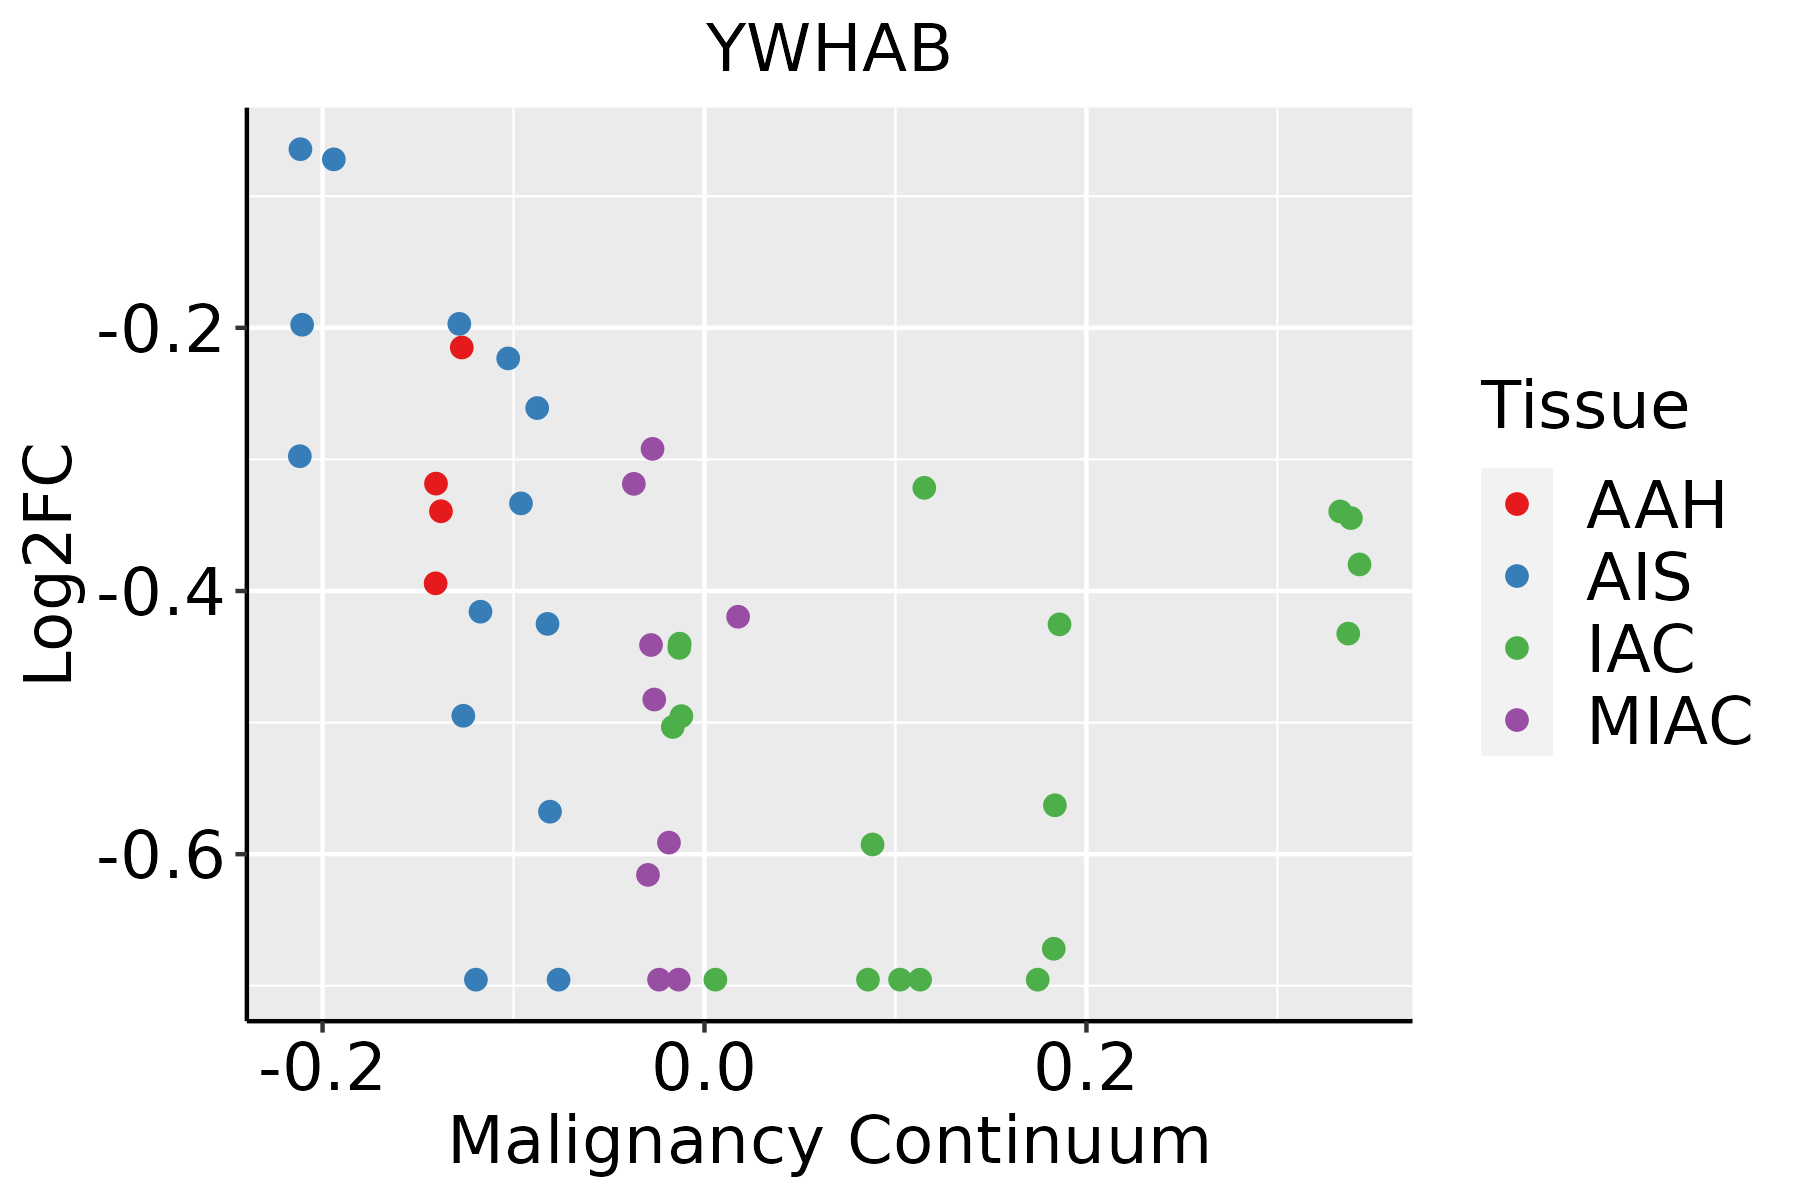 | AAH: Atypical adenomatous hyperplasia |
| AIS: Adenocarcinoma in situ | ||
| IAC: Invasive lung adenocarcinoma | ||
| MIA: Minimally invasive adenocarcinoma | ||
| Oral Cavity |  | EOLP: Erosive Oral lichen planus |
| LP: leukoplakia | ||
| NEOLP: Non-erosive oral lichen planus | ||
| OSCC: Oral squamous cell carcinoma | ||
| Prostate |  | BPH: Benign Prostatic Hyperplasia |
| Skin | 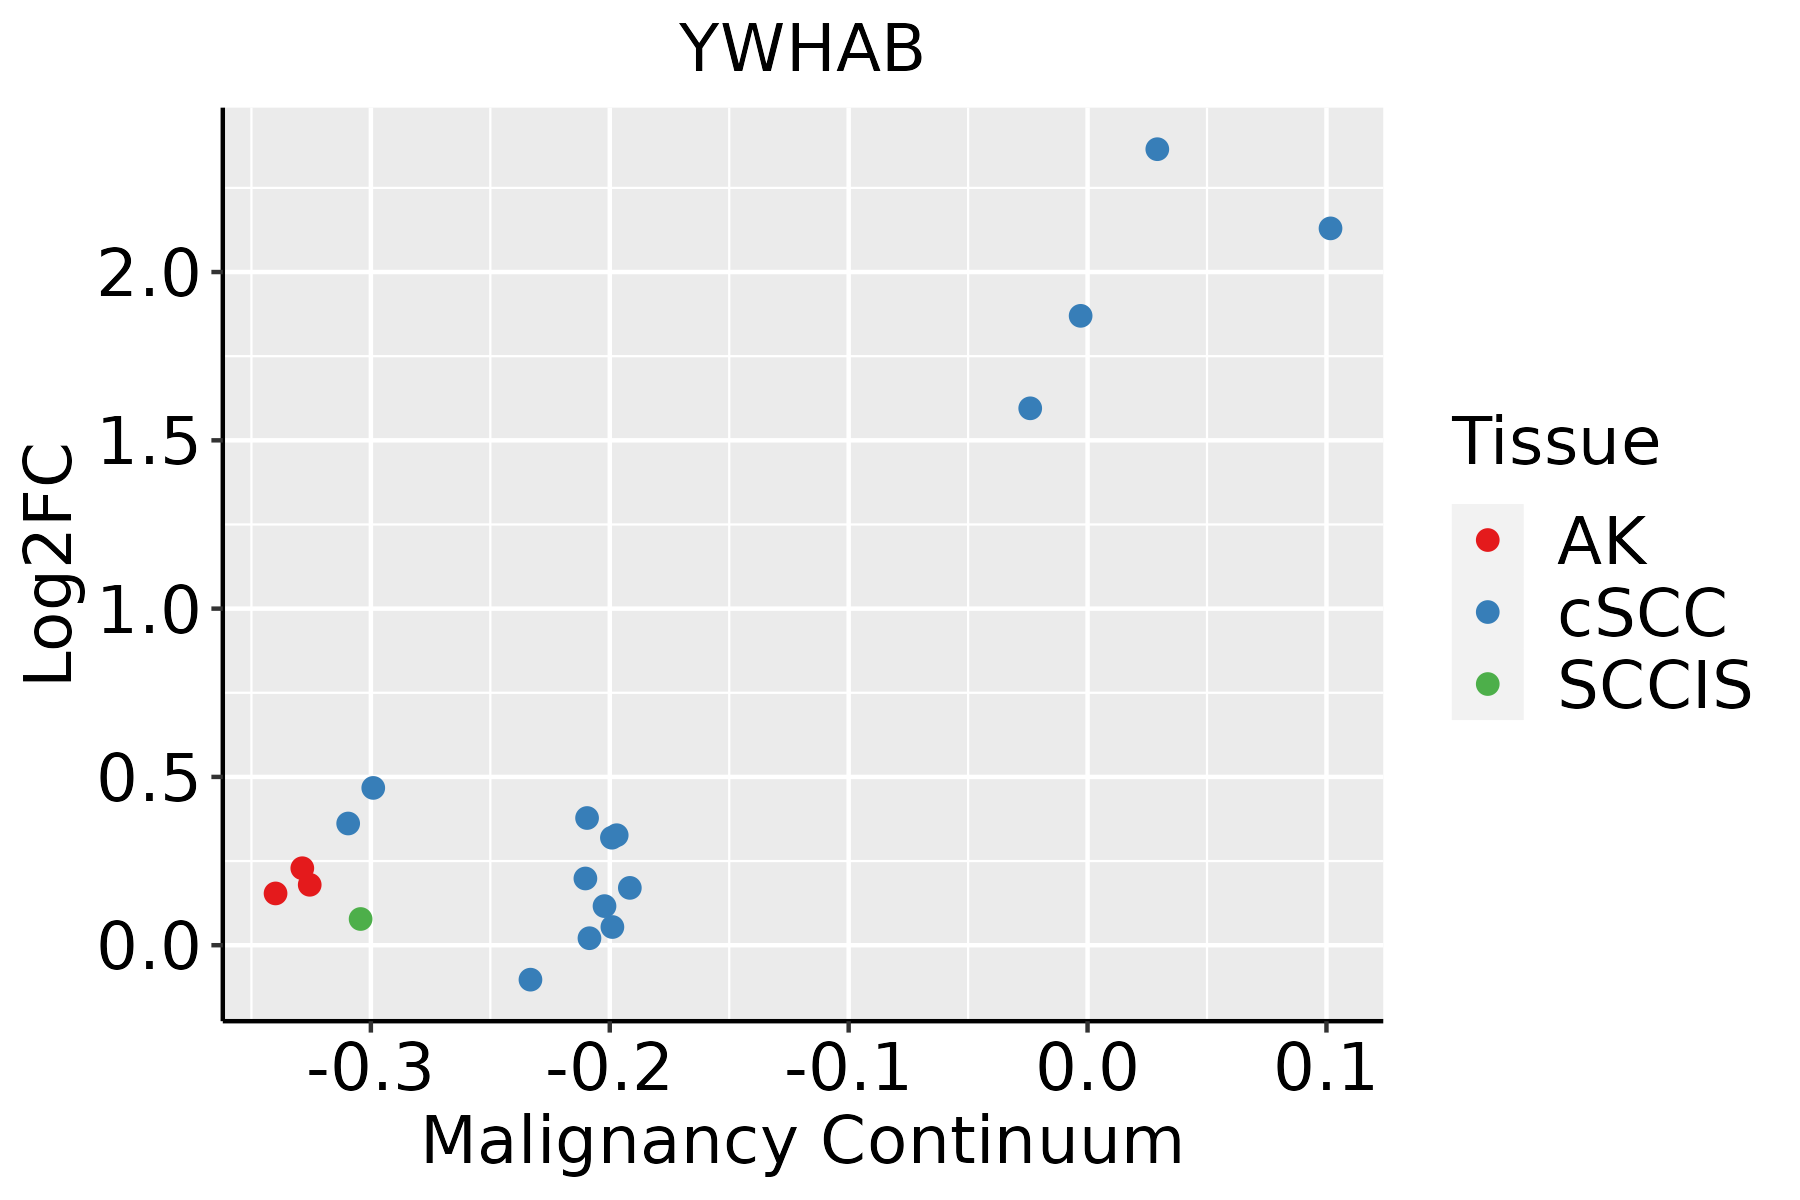 | AK: Actinic keratosis |
| cSCC: Cutaneous squamous cell carcinoma | ||
| SCCIS:squamous cell carcinoma in situ | ||
| Thyroid |  | ATC: Anaplastic thyroid cancer |
| HT: Hashimoto's thyroiditis | ||
| PTC: Papillary thyroid cancer |
| ∗log2FC in expression of this searched gene in stem-like cells from each diseased tissue sample relative to stem-like cells in normal samples in each tissue plotted against the malignancy continuum. Samples are colored based on if they are from different disease stage. |
Top |
Malignant transformation related pathway analysis |
| Find out the enriched GO biological processes and KEGG pathways involved in transition from healthy to precancer to cancer |
| Tissue | Disease Stage | Enriched GO biological Processes |
| Colorectum | AD |  |
| Colorectum | SER |  |
| Colorectum | MSS |  |
| Colorectum | MSI-H |  |
| Colorectum | FAP |  |
| ∗Top 15 enriched GO BP terms are showed in the bar plot of each disease state in each tissue. Each row represents a significant GO biological process which is colored according to the -log10(p.adjust). |
| Page: 1 2 3 4 5 6 7 8 9 |
| GO ID | Tissue | Disease Stage | Description | Gene Ratio | Bg Ratio | pvalue | p.adjust | Count |
| GO:00451859 | Breast | Precancer | maintenance of protein location | 19/1080 | 94/18723 | 1.43e-06 | 5.35e-05 | 19 |
| GO:00512358 | Breast | Precancer | maintenance of location | 40/1080 | 327/18723 | 5.85e-06 | 1.71e-04 | 40 |
| GO:00353049 | Breast | Precancer | regulation of protein dephosphorylation | 14/1080 | 90/18723 | 6.16e-04 | 7.72e-03 | 14 |
| GO:00066059 | Breast | Precancer | protein targeting | 33/1080 | 314/18723 | 6.50e-04 | 7.99e-03 | 33 |
| GO:00353086 | Breast | Precancer | negative regulation of protein dephosphorylation | 7/1080 | 34/18723 | 2.84e-03 | 2.49e-02 | 7 |
| GO:00512203 | Breast | Precancer | cytoplasmic sequestering of protein | 5/1080 | 22/18723 | 7.32e-03 | 4.88e-02 | 5 |
| GO:004518514 | Breast | IDC | maintenance of protein location | 21/1434 | 94/18723 | 6.69e-06 | 2.05e-04 | 21 |
| GO:005123513 | Breast | IDC | maintenance of location | 48/1434 | 327/18723 | 9.90e-06 | 2.77e-04 | 48 |
| GO:003530414 | Breast | IDC | regulation of protein dephosphorylation | 18/1434 | 90/18723 | 1.39e-04 | 2.48e-03 | 18 |
| GO:000660514 | Breast | IDC | protein targeting | 43/1434 | 314/18723 | 1.44e-04 | 2.53e-03 | 43 |
| GO:00459369 | Breast | IDC | negative regulation of phosphate metabolic process | 53/1434 | 441/18723 | 7.21e-04 | 8.79e-03 | 53 |
| GO:00105639 | Breast | IDC | negative regulation of phosphorus metabolic process | 53/1434 | 442/18723 | 7.60e-04 | 9.25e-03 | 53 |
| GO:003530813 | Breast | IDC | negative regulation of protein dephosphorylation | 9/1434 | 34/18723 | 8.01e-04 | 9.58e-03 | 9 |
| GO:00353052 | Breast | IDC | negative regulation of dephosphorylation | 9/1434 | 45/18723 | 6.33e-03 | 4.47e-02 | 9 |
| GO:004518521 | Breast | DCIS | maintenance of protein location | 21/1390 | 94/18723 | 4.12e-06 | 1.24e-04 | 21 |
| GO:005123523 | Breast | DCIS | maintenance of location | 47/1390 | 327/18723 | 9.55e-06 | 2.56e-04 | 47 |
| GO:000660523 | Breast | DCIS | protein targeting | 43/1390 | 314/18723 | 7.17e-05 | 1.41e-03 | 43 |
| GO:003530423 | Breast | DCIS | regulation of protein dephosphorylation | 18/1390 | 90/18723 | 9.33e-05 | 1.71e-03 | 18 |
| GO:004593614 | Breast | DCIS | negative regulation of phosphate metabolic process | 53/1390 | 441/18723 | 3.48e-04 | 4.96e-03 | 53 |
| GO:001056314 | Breast | DCIS | negative regulation of phosphorus metabolic process | 53/1390 | 442/18723 | 3.68e-04 | 5.18e-03 | 53 |
| Page: 1 2 3 4 5 6 7 8 9 10 11 12 13 14 15 16 17 |
| Pathway ID | Tissue | Disease Stage | Description | Gene Ratio | Bg Ratio | pvalue | p.adjust | qvalue | Count |
| hsa052036 | Breast | Precancer | Viral carcinogenesis | 27/684 | 204/8465 | 7.19e-03 | 4.06e-02 | 3.11e-02 | 27 |
| hsa0520312 | Breast | Precancer | Viral carcinogenesis | 27/684 | 204/8465 | 7.19e-03 | 4.06e-02 | 3.11e-02 | 27 |
| hsa0520322 | Breast | IDC | Viral carcinogenesis | 34/867 | 204/8465 | 2.82e-03 | 1.86e-02 | 1.39e-02 | 34 |
| hsa0520332 | Breast | IDC | Viral carcinogenesis | 34/867 | 204/8465 | 2.82e-03 | 1.86e-02 | 1.39e-02 | 34 |
| hsa0520341 | Breast | DCIS | Viral carcinogenesis | 34/846 | 204/8465 | 1.88e-03 | 1.27e-02 | 9.33e-03 | 34 |
| hsa052035 | Breast | DCIS | Viral carcinogenesis | 34/846 | 204/8465 | 1.88e-03 | 1.27e-02 | 9.33e-03 | 34 |
| hsa043908 | Cervix | CC | Hippo signaling pathway | 40/1267 | 157/8465 | 3.64e-04 | 1.82e-03 | 1.07e-03 | 40 |
| hsa041106 | Cervix | CC | Cell cycle | 36/1267 | 157/8465 | 4.94e-03 | 1.67e-02 | 9.86e-03 | 36 |
| hsa0439013 | Cervix | CC | Hippo signaling pathway | 40/1267 | 157/8465 | 3.64e-04 | 1.82e-03 | 1.07e-03 | 40 |
| hsa0411013 | Cervix | CC | Cell cycle | 36/1267 | 157/8465 | 4.94e-03 | 1.67e-02 | 9.86e-03 | 36 |
| hsa05160 | Colorectum | AD | Hepatitis C | 54/2092 | 157/8465 | 3.87e-03 | 1.96e-02 | 1.25e-02 | 54 |
| hsa051601 | Colorectum | AD | Hepatitis C | 54/2092 | 157/8465 | 3.87e-03 | 1.96e-02 | 1.25e-02 | 54 |
| hsa051602 | Colorectum | MSS | Hepatitis C | 52/1875 | 157/8465 | 9.29e-04 | 5.58e-03 | 3.42e-03 | 52 |
| hsa04390 | Colorectum | MSS | Hippo signaling pathway | 48/1875 | 157/8465 | 8.32e-03 | 3.10e-02 | 1.90e-02 | 48 |
| hsa05161 | Colorectum | MSS | Hepatitis B | 48/1875 | 162/8465 | 1.53e-02 | 4.93e-02 | 3.02e-02 | 48 |
| hsa051603 | Colorectum | MSS | Hepatitis C | 52/1875 | 157/8465 | 9.29e-04 | 5.58e-03 | 3.42e-03 | 52 |
| hsa043901 | Colorectum | MSS | Hippo signaling pathway | 48/1875 | 157/8465 | 8.32e-03 | 3.10e-02 | 1.90e-02 | 48 |
| hsa051611 | Colorectum | MSS | Hepatitis B | 48/1875 | 162/8465 | 1.53e-02 | 4.93e-02 | 3.02e-02 | 48 |
| hsa043902 | Colorectum | FAP | Hippo signaling pathway | 41/1404 | 157/8465 | 1.49e-03 | 7.91e-03 | 4.81e-03 | 41 |
| hsa04151 | Colorectum | FAP | PI3K-Akt signaling pathway | 75/1404 | 354/8465 | 1.23e-02 | 4.19e-02 | 2.55e-02 | 75 |
| Page: 1 2 3 4 5 6 7 8 |
Top |
Cell-cell communication analysis |
| Identification of potential cell-cell interactions between two cell types and their ligand-receptor pairs for different disease states |
| Ligand | Receptor | LRpair | Pathway | Tissue | Disease Stage |
| Page: 1 |
Top |
Single-cell gene regulatory network inference analysis |
| Find out the significant the regulons (TFs) and the target genes of each regulon across cell types for different disease states |
| TF | Cell Type | Tissue | Disease Stage | Target Gene | RSS | Regulon Activity |
| ∗The dot plots of a searched regulon are shown for all cell subpopulations in each disease state of each tissue based on the regulon specific score inferred using pySCENIC and by calculating the average expression. |
| Page: 1 |
Top |
Somatic mutation of malignant transformation related genes |
| Annotation of somatic variants for genes involved in malignant transformation |
| Hugo Symbol | Variant Class | Variant Classification | dbSNP RS | HGVSc | HGVSp | HGVSp Short | SWISSPROT | BIOTYPE | SIFT | PolyPhen | Tumor Sample Barcode | Tissue | Histology | Sex | Age | Stage | Therapy Types | Drugs | Outcome |
| YWHAB | SNV | Missense_Mutation | c.724G>T | p.Gly242Trp | p.G242W | P31946 | protein_coding | deleterious_low_confidence(0) | possibly_damaging(0.664) | TCGA-A7-A0DB-01 | Breast | breast invasive carcinoma | Female | <65 | I/II | Hormone Therapy | arimidex | SD | |
| YWHAB | SNV | Missense_Mutation | novel | c.505N>T | p.Arg169Cys | p.R169C | P31946 | protein_coding | tolerated_low_confidence(0.07) | probably_damaging(0.937) | TCGA-AN-A046-01 | Breast | breast invasive carcinoma | Female | >=65 | I/II | Unknown | Unknown | SD |
| YWHAB | SNV | Missense_Mutation | c.184N>T | p.Arg62Cys | p.R62C | P31946 | protein_coding | deleterious_low_confidence(0) | probably_damaging(0.999) | TCGA-D8-A142-01 | Breast | breast invasive carcinoma | Female | >=65 | I/II | Chemotherapy | cyclophosphamid | SD | |
| YWHAB | SNV | Missense_Mutation | novel | c.121G>A | p.Glu41Lys | p.E41K | P31946 | protein_coding | deleterious_low_confidence(0) | probably_damaging(0.992) | TCGA-AA-A010-01 | Colorectum | colon adenocarcinoma | Female | <65 | I/II | Chemotherapy | folinic | CR |
| YWHAB | SNV | Missense_Mutation | novel | c.460N>T | p.Ala154Ser | p.A154S | P31946 | protein_coding | deleterious_low_confidence(0) | probably_damaging(0.99) | TCGA-A5-A0G2-01 | Endometrium | uterine corpus endometrioid carcinoma | Female | <65 | III/IV | Unknown | Unknown | SD |
| YWHAB | SNV | Missense_Mutation | rs374058745 | c.620C>T | p.Thr207Met | p.T207M | P31946 | protein_coding | deleterious_low_confidence(0) | possibly_damaging(0.898) | TCGA-AP-A1E0-01 | Endometrium | uterine corpus endometrioid carcinoma | Female | <65 | III/IV | Chemotherapy | paclitaxel | SD |
| YWHAB | SNV | Missense_Mutation | novel | c.505C>T | p.Arg169Cys | p.R169C | P31946 | protein_coding | tolerated_low_confidence(0.07) | probably_damaging(0.937) | TCGA-AX-A2HC-01 | Endometrium | uterine corpus endometrioid carcinoma | Female | <65 | III/IV | Chemotherapy | paclitaxel | PD |
| YWHAB | SNV | Missense_Mutation | rs11556823 | c.173G>A | p.Arg58His | p.R58H | P31946 | protein_coding | deleterious_low_confidence(0.01) | probably_damaging(0.996) | TCGA-B5-A3FC-01 | Endometrium | uterine corpus endometrioid carcinoma | Female | <65 | I/II | Unknown | Unknown | SD |
| YWHAB | SNV | Missense_Mutation | novel | c.505N>T | p.Arg169Cys | p.R169C | P31946 | protein_coding | tolerated_low_confidence(0.07) | probably_damaging(0.937) | TCGA-D1-A17Q-01 | Endometrium | uterine corpus endometrioid carcinoma | Female | <65 | I/II | Unknown | Unknown | SD |
| YWHAB | SNV | Missense_Mutation | novel | c.595N>A | p.Asp199Asn | p.D199N | P31946 | protein_coding | deleterious_low_confidence(0.01) | possibly_damaging(0.534) | TCGA-DI-A1NO-01 | Endometrium | uterine corpus endometrioid carcinoma | Female | >=65 | III/IV | Unknown | Unknown | PD |
| Page: 1 2 |
Top |
Related drugs of malignant transformation related genes |
| Identification of chemicals and drugs interact with genes involved in malignant transfromation |
| (DGIdb 4.0) |
| Entrez ID | Symbol | Category | Interaction Types | Drug Claim Name | Drug Name | PMIDs |
| Page: 1 |

Copyright 2023-Present -The University of Texas Health Science Center at Houston |