
|
|||||
|
 | |
| |
| |
| |
| |
| |
|
Gene: YTHDF3 |
Gene summary for YTHDF3 |
| Gene information | Species | Human | Gene symbol | YTHDF3 | Gene ID | 253943 |
| Gene name | YTH N6-methyladenosine RNA binding protein 3 | |
| Gene Alias | DF3 | |
| Cytomap | 8q12.3 | |
| Gene Type | protein-coding | GO ID | GO:0000003 | UniProtAcc | A0A087WY31 |
Top |
Malignant transformation analysis |
| Identification of the aberrant gene expression in precancerous and cancerous lesions by comparing the gene expression of stem-like cells in diseased tissues with normal stem cells |
| Entrez ID | Symbol | Replicates | Species | Organ | Tissue | Adj P-value | Log2FC | Malignancy |
| 253943 | YTHDF3 | LZE4T | Human | Esophagus | ESCC | 4.34e-13 | 3.06e-01 | 0.0811 |
| 253943 | YTHDF3 | LZE5T | Human | Esophagus | ESCC | 4.35e-02 | 4.64e-02 | 0.0514 |
| 253943 | YTHDF3 | LZE8T | Human | Esophagus | ESCC | 1.85e-14 | 2.01e-01 | 0.067 |
| 253943 | YTHDF3 | LZE20T | Human | Esophagus | ESCC | 1.01e-05 | 2.04e-01 | 0.0662 |
| 253943 | YTHDF3 | LZE24T | Human | Esophagus | ESCC | 1.21e-13 | 3.74e-01 | 0.0596 |
| 253943 | YTHDF3 | LZE21T | Human | Esophagus | ESCC | 3.41e-03 | 2.53e-01 | 0.0655 |
| 253943 | YTHDF3 | P1T-E | Human | Esophagus | ESCC | 2.63e-05 | 1.72e-01 | 0.0875 |
| 253943 | YTHDF3 | P2T-E | Human | Esophagus | ESCC | 3.51e-10 | 2.45e-01 | 0.1177 |
| 253943 | YTHDF3 | P4T-E | Human | Esophagus | ESCC | 1.97e-13 | 2.50e-01 | 0.1323 |
| 253943 | YTHDF3 | P5T-E | Human | Esophagus | ESCC | 6.99e-14 | 2.06e-01 | 0.1327 |
| 253943 | YTHDF3 | P8T-E | Human | Esophagus | ESCC | 8.44e-15 | 2.21e-01 | 0.0889 |
| 253943 | YTHDF3 | P9T-E | Human | Esophagus | ESCC | 5.23e-11 | 1.26e-01 | 0.1131 |
| 253943 | YTHDF3 | P10T-E | Human | Esophagus | ESCC | 1.27e-17 | 3.21e-01 | 0.116 |
| 253943 | YTHDF3 | P11T-E | Human | Esophagus | ESCC | 2.09e-09 | 4.65e-01 | 0.1426 |
| 253943 | YTHDF3 | P12T-E | Human | Esophagus | ESCC | 2.72e-16 | 3.65e-01 | 0.1122 |
| 253943 | YTHDF3 | P15T-E | Human | Esophagus | ESCC | 1.22e-13 | 3.37e-01 | 0.1149 |
| 253943 | YTHDF3 | P16T-E | Human | Esophagus | ESCC | 5.30e-26 | 4.64e-01 | 0.1153 |
| 253943 | YTHDF3 | P17T-E | Human | Esophagus | ESCC | 2.73e-07 | 3.71e-01 | 0.1278 |
| 253943 | YTHDF3 | P20T-E | Human | Esophagus | ESCC | 1.07e-12 | 1.32e-01 | 0.1124 |
| 253943 | YTHDF3 | P21T-E | Human | Esophagus | ESCC | 2.56e-20 | 4.15e-01 | 0.1617 |
| Page: 1 2 3 4 5 6 |
| Tissue | Expression Dynamics | Abbreviation |
| Esophagus |  | ESCC: Esophageal squamous cell carcinoma |
| HGIN: High-grade intraepithelial neoplasias | ||
| LGIN: Low-grade intraepithelial neoplasias | ||
| Liver | 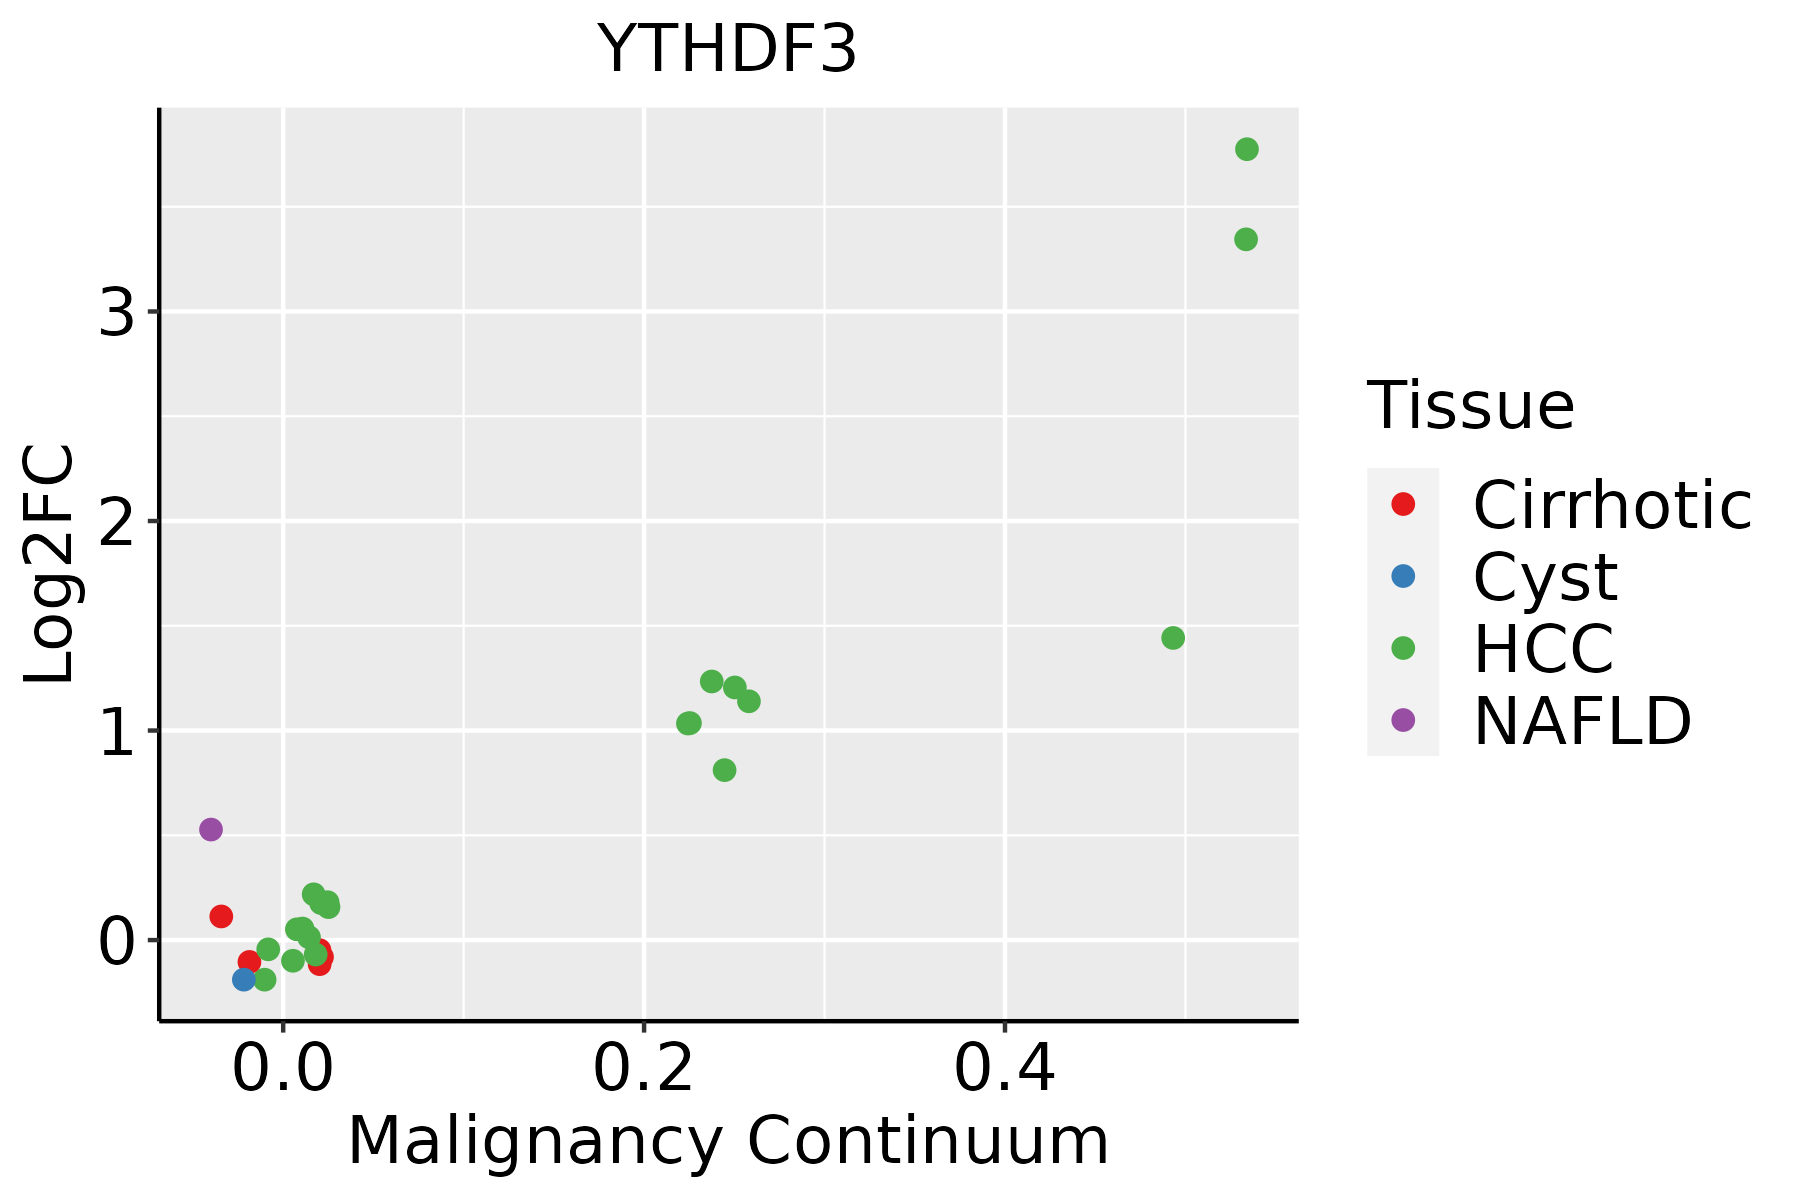 | HCC: Hepatocellular carcinoma |
| NAFLD: Non-alcoholic fatty liver disease | ||
| Oral Cavity | 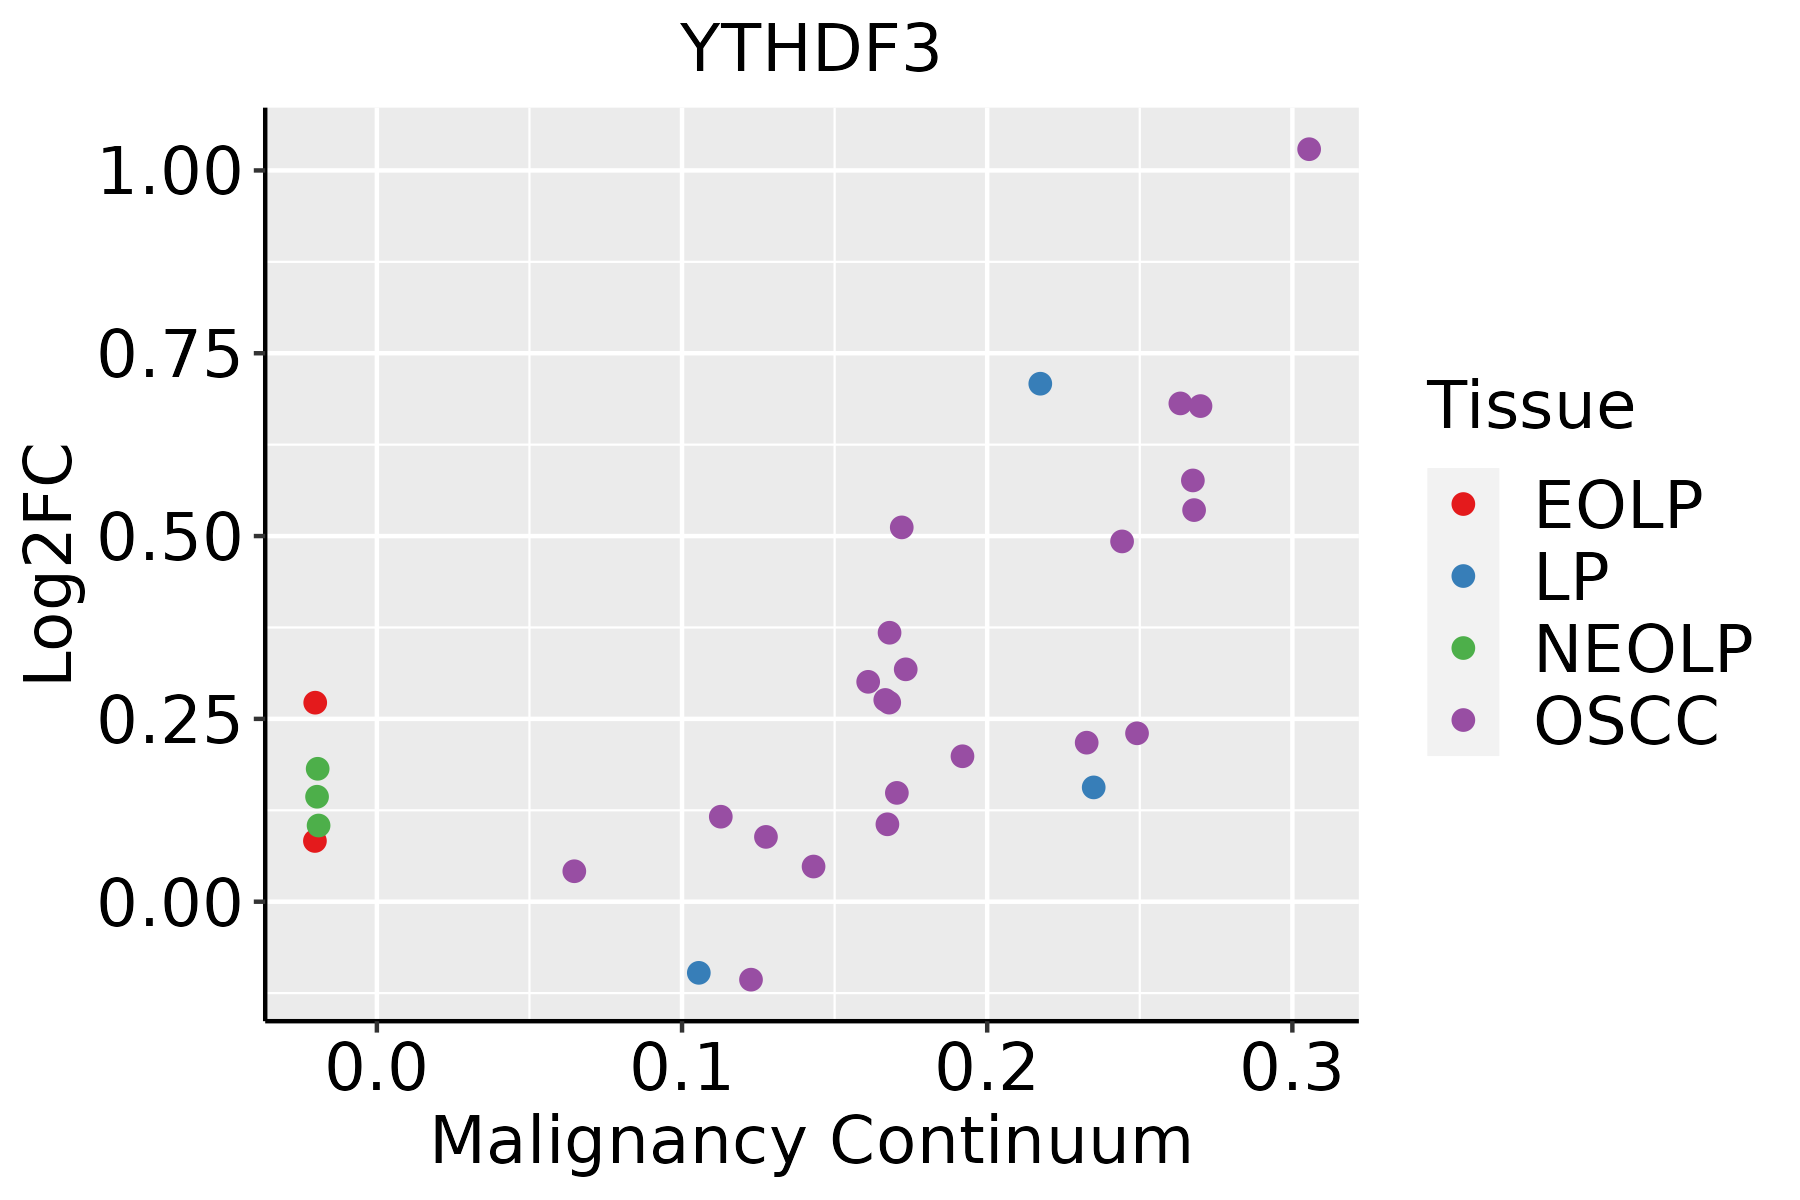 | EOLP: Erosive Oral lichen planus |
| LP: leukoplakia | ||
| NEOLP: Non-erosive oral lichen planus | ||
| OSCC: Oral squamous cell carcinoma | ||
| Thyroid |  | ATC: Anaplastic thyroid cancer |
| HT: Hashimoto's thyroiditis | ||
| PTC: Papillary thyroid cancer |
| ∗log2FC in expression of this searched gene in stem-like cells from each diseased tissue sample relative to stem-like cells in normal samples in each tissue plotted against the malignancy continuum. Samples are colored based on if they are from different disease stage. |
Top |
Malignant transformation related pathway analysis |
| Find out the enriched GO biological processes and KEGG pathways involved in transition from healthy to precancer to cancer |
| Tissue | Disease Stage | Enriched GO biological Processes |
| Colorectum | AD |  |
| Colorectum | SER |  |
| Colorectum | MSS |  |
| Colorectum | MSI-H |  |
| Colorectum | FAP |  |
| ∗Top 15 enriched GO BP terms are showed in the bar plot of each disease state in each tissue. Each row represents a significant GO biological process which is colored according to the -log10(p.adjust). |
| Page: 1 2 3 4 5 6 7 8 9 |
| GO ID | Tissue | Disease Stage | Description | Gene Ratio | Bg Ratio | pvalue | p.adjust | Count |
| GO:0009896111 | Esophagus | ESCC | positive regulation of catabolic process | 332/8552 | 492/18723 | 4.36e-23 | 9.22e-21 | 332 |
| GO:0031331111 | Esophagus | ESCC | positive regulation of cellular catabolic process | 292/8552 | 427/18723 | 8.67e-22 | 1.53e-19 | 292 |
| GO:1903311110 | Esophagus | ESCC | regulation of mRNA metabolic process | 210/8552 | 288/18723 | 3.25e-21 | 5.56e-19 | 210 |
| GO:0006401110 | Esophagus | ESCC | RNA catabolic process | 204/8552 | 278/18723 | 3.39e-21 | 5.66e-19 | 204 |
| GO:0006413110 | Esophagus | ESCC | translational initiation | 100/8552 | 118/18723 | 1.16e-18 | 1.25e-16 | 100 |
| GO:0034655110 | Esophagus | ESCC | nucleobase-containing compound catabolic process | 272/8552 | 407/18723 | 2.92e-18 | 2.90e-16 | 272 |
| GO:0006402110 | Esophagus | ESCC | mRNA catabolic process | 170/8552 | 232/18723 | 8.70e-18 | 8.00e-16 | 170 |
| GO:0006417111 | Esophagus | ESCC | regulation of translation | 304/8552 | 468/18723 | 1.53e-17 | 1.33e-15 | 304 |
| GO:004670018 | Esophagus | ESCC | heterocycle catabolic process | 286/8552 | 445/18723 | 1.12e-15 | 7.47e-14 | 286 |
| GO:0045727111 | Esophagus | ESCC | positive regulation of translation | 107/8552 | 136/18723 | 2.79e-15 | 1.68e-13 | 107 |
| GO:004427019 | Esophagus | ESCC | cellular nitrogen compound catabolic process | 288/8552 | 451/18723 | 3.03e-15 | 1.79e-13 | 288 |
| GO:0034250111 | Esophagus | ESCC | positive regulation of cellular amide metabolic process | 123/8552 | 162/18723 | 3.32e-15 | 1.93e-13 | 123 |
| GO:001943918 | Esophagus | ESCC | aromatic compound catabolic process | 295/8552 | 467/18723 | 1.09e-14 | 5.98e-13 | 295 |
| GO:190136118 | Esophagus | ESCC | organic cyclic compound catabolic process | 307/8552 | 495/18723 | 9.99e-14 | 4.80e-12 | 307 |
| GO:000644617 | Esophagus | ESCC | regulation of translational initiation | 65/8552 | 79/18723 | 2.04e-11 | 7.07e-10 | 65 |
| GO:190331316 | Esophagus | ESCC | positive regulation of mRNA metabolic process | 87/8552 | 118/18723 | 5.10e-10 | 1.32e-08 | 87 |
| GO:006101319 | Esophagus | ESCC | regulation of mRNA catabolic process | 115/8552 | 166/18723 | 5.90e-10 | 1.49e-08 | 115 |
| GO:004348719 | Esophagus | ESCC | regulation of RNA stability | 117/8552 | 170/18723 | 7.91e-10 | 1.94e-08 | 117 |
| GO:004348819 | Esophagus | ESCC | regulation of mRNA stability | 109/8552 | 158/18723 | 2.40e-09 | 5.35e-08 | 109 |
| GO:003434013 | Esophagus | ESCC | response to type I interferon | 48/8552 | 58/18723 | 6.18e-09 | 1.26e-07 | 48 |
| Page: 1 2 3 4 5 6 7 8 9 10 11 12 13 14 15 16 17 18 19 |
| Pathway ID | Tissue | Disease Stage | Description | Gene Ratio | Bg Ratio | pvalue | p.adjust | qvalue | Count |
| Page: 1 |
Top |
Cell-cell communication analysis |
| Identification of potential cell-cell interactions between two cell types and their ligand-receptor pairs for different disease states |
| Ligand | Receptor | LRpair | Pathway | Tissue | Disease Stage |
| Page: 1 |
Top |
Single-cell gene regulatory network inference analysis |
| Find out the significant the regulons (TFs) and the target genes of each regulon across cell types for different disease states |
| TF | Cell Type | Tissue | Disease Stage | Target Gene | RSS | Regulon Activity |
| ∗The dot plots of a searched regulon are shown for all cell subpopulations in each disease state of each tissue based on the regulon specific score inferred using pySCENIC and by calculating the average expression. |
| Page: 1 |
Top |
Somatic mutation of malignant transformation related genes |
| Annotation of somatic variants for genes involved in malignant transformation |
| Hugo Symbol | Variant Class | Variant Classification | dbSNP RS | HGVSc | HGVSp | HGVSp Short | SWISSPROT | BIOTYPE | SIFT | PolyPhen | Tumor Sample Barcode | Tissue | Histology | Sex | Age | Stage | Therapy Types | Drugs | Outcome |
| YTHDF3 | SNV | Missense_Mutation | c.1320N>G | p.Ile440Met | p.I440M | protein_coding | deleterious(0) | benign(0.354) | TCGA-A8-A075-01 | Breast | breast invasive carcinoma | Female | <65 | I/II | Chemotherapy | epirubicin | CR | ||
| YTHDF3 | SNV | Missense_Mutation | c.1351N>A | p.Leu451Met | p.L451M | protein_coding | deleterious(0) | possibly_damaging(0.775) | TCGA-A8-A08R-01 | Breast | breast invasive carcinoma | Female | <65 | I/II | Unknown | Unknown | SD | ||
| YTHDF3 | SNV | Missense_Mutation | c.706C>T | p.Pro236Ser | p.P236S | protein_coding | tolerated(0.24) | probably_damaging(0.954) | TCGA-B6-A0I8-01 | Breast | breast invasive carcinoma | Female | <65 | I/II | Unknown | Unknown | PD | ||
| YTHDF3 | SNV | Missense_Mutation | c.1429N>G | p.Cys477Gly | p.C477G | protein_coding | deleterious(0) | probably_damaging(0.986) | TCGA-B6-A0RS-01 | Breast | breast invasive carcinoma | Female | <65 | I/II | Unknown | Unknown | PD | ||
| YTHDF3 | SNV | Missense_Mutation | novel | c.172N>T | p.Pro58Ser | p.P58S | protein_coding | tolerated(0.71) | benign(0.094) | TCGA-LL-A740-01 | Breast | breast invasive carcinoma | Female | <65 | I/II | Chemotherapy | adriamycin | CR | |
| YTHDF3 | insertion | Nonsense_Mutation | novel | c.348_349insTTCTTATGACATGATTAGATATGCAT | p.Asn117PhefsTer3 | p.N117Ffs*3 | protein_coding | TCGA-B6-A0IA-01 | Breast | breast invasive carcinoma | Female | <65 | I/II | Unknown | Unknown | SD | |||
| YTHDF3 | insertion | Nonsense_Mutation | novel | c.350_351insATTATACTTTTAGAAAAT | p.Asn117delinsLysLeuTyrPheTerLysIle | p.N117delinsKLYF*KI | protein_coding | TCGA-B6-A0IA-01 | Breast | breast invasive carcinoma | Female | <65 | I/II | Unknown | Unknown | SD | |||
| YTHDF3 | insertion | Frame_Shift_Ins | novel | c.1316_1317insT | p.Ile440TyrfsTer4 | p.I440Yfs*4 | protein_coding | TCGA-D8-A73U-01 | Breast | breast invasive carcinoma | Female | >=65 | I/II | Hormone Therapy | tamoxiphen | SD | |||
| YTHDF3 | SNV | Missense_Mutation | rs767444673 | c.1568N>A | p.Arg523His | p.R523H | protein_coding | deleterious(0.02) | benign(0.003) | TCGA-2W-A8YY-01 | Cervix | cervical & endocervical cancer | Female | <65 | I/II | Chemotherapy | cisplatin | CR | |
| YTHDF3 | SNV | Missense_Mutation | rs372046184 | c.1469N>T | p.Ala490Val | p.A490V | protein_coding | deleterious(0.01) | benign(0.41) | TCGA-5M-AAT6-01 | Colorectum | colon adenocarcinoma | Female | <65 | III/IV | Unknown | Unknown | PD |
| Page: 1 2 3 4 5 6 7 8 |
Top |
Related drugs of malignant transformation related genes |
| Identification of chemicals and drugs interact with genes involved in malignant transfromation |
| (DGIdb 4.0) |
| Entrez ID | Symbol | Category | Interaction Types | Drug Claim Name | Drug Name | PMIDs |
| Page: 1 |

Copyright 2023-Present -The University of Texas Health Science Center at Houston |