| Tissue | Expression Dynamics | Abbreviation |
| Cervix | 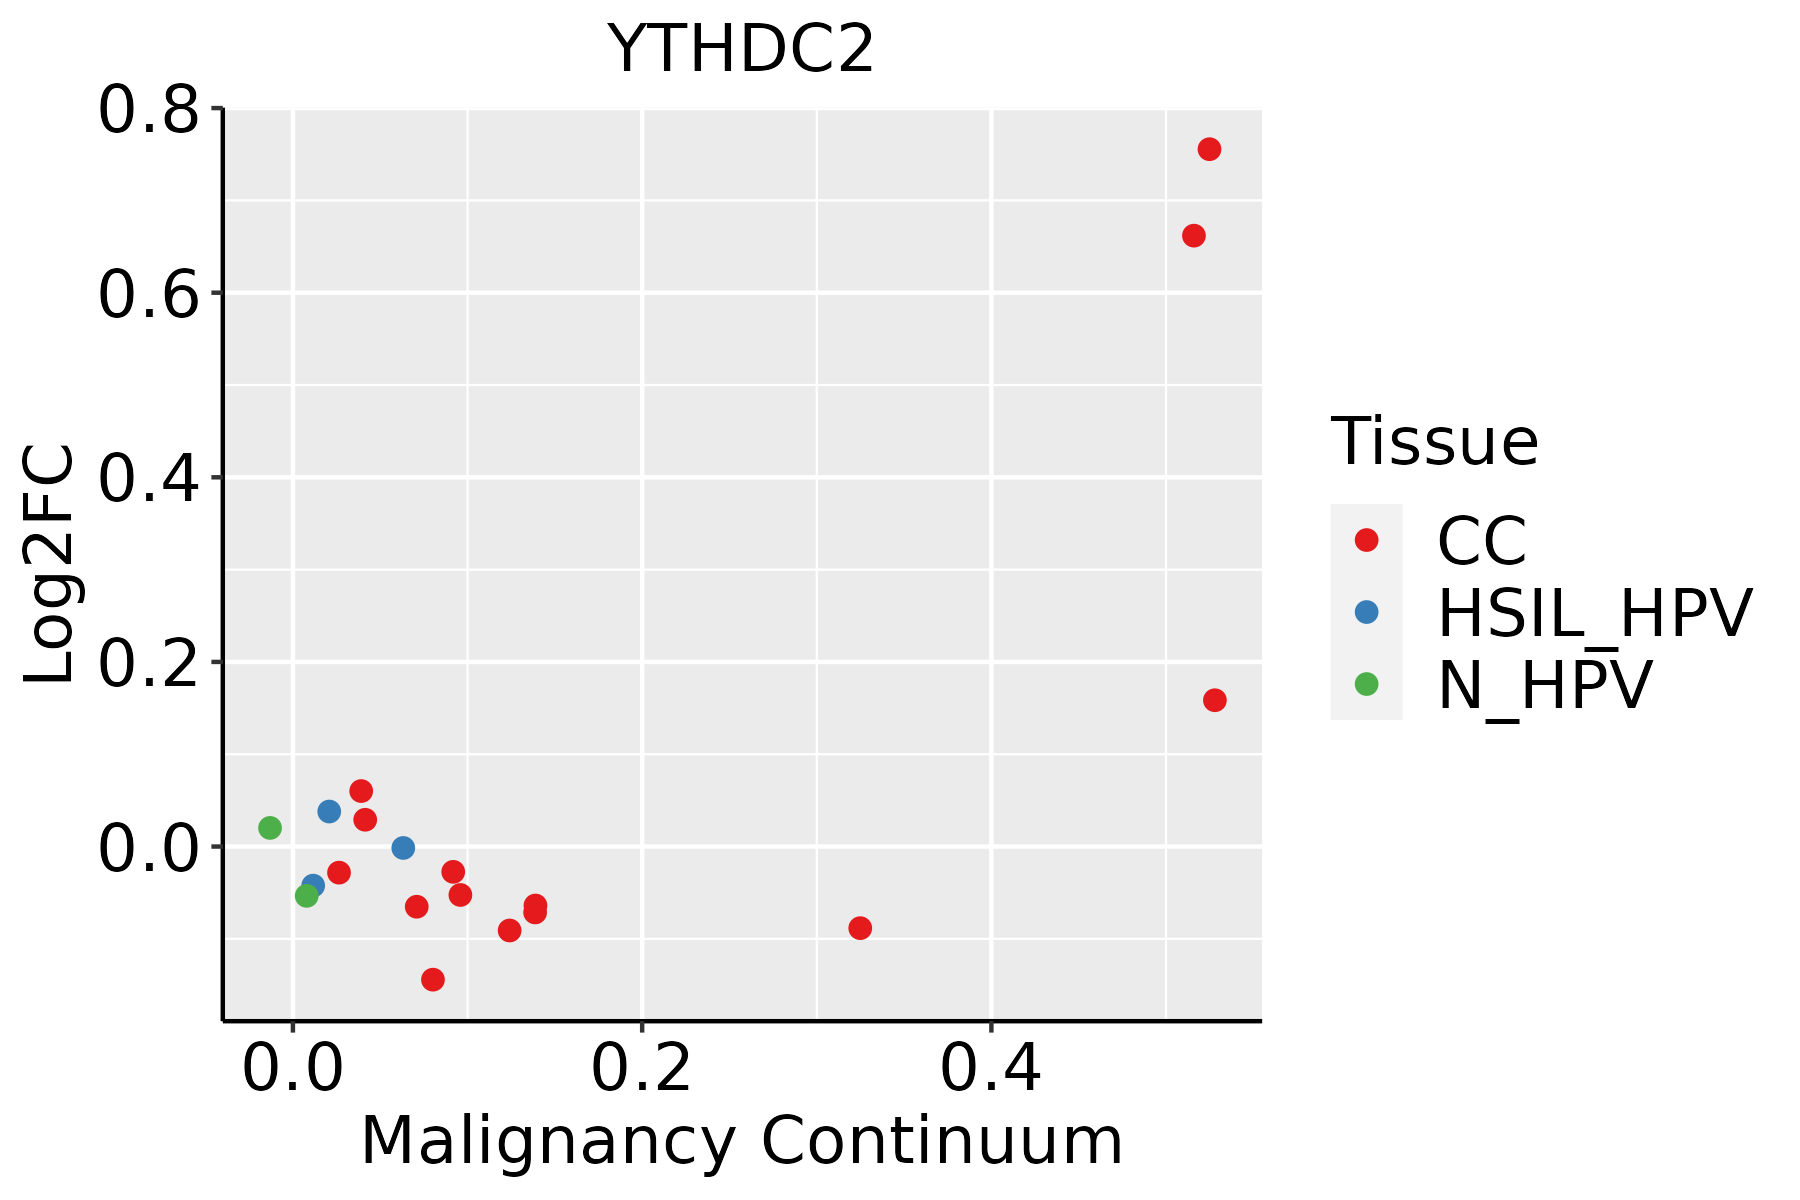 | CC: Cervix cancer |
| HSIL_HPV: HPV-infected high-grade squamous intraepithelial lesions |
| N_HPV: HPV-infected normal cervix |
| Colorectum (GSE201348) |  | FAP: Familial adenomatous polyposis |
| CRC: Colorectal cancer |
| Colorectum (HTA11) |  | AD: Adenomas |
| SER: Sessile serrated lesions |
| MSI-H: Microsatellite-high colorectal cancer |
| MSS: Microsatellite stable colorectal cancer |
| Esophagus | 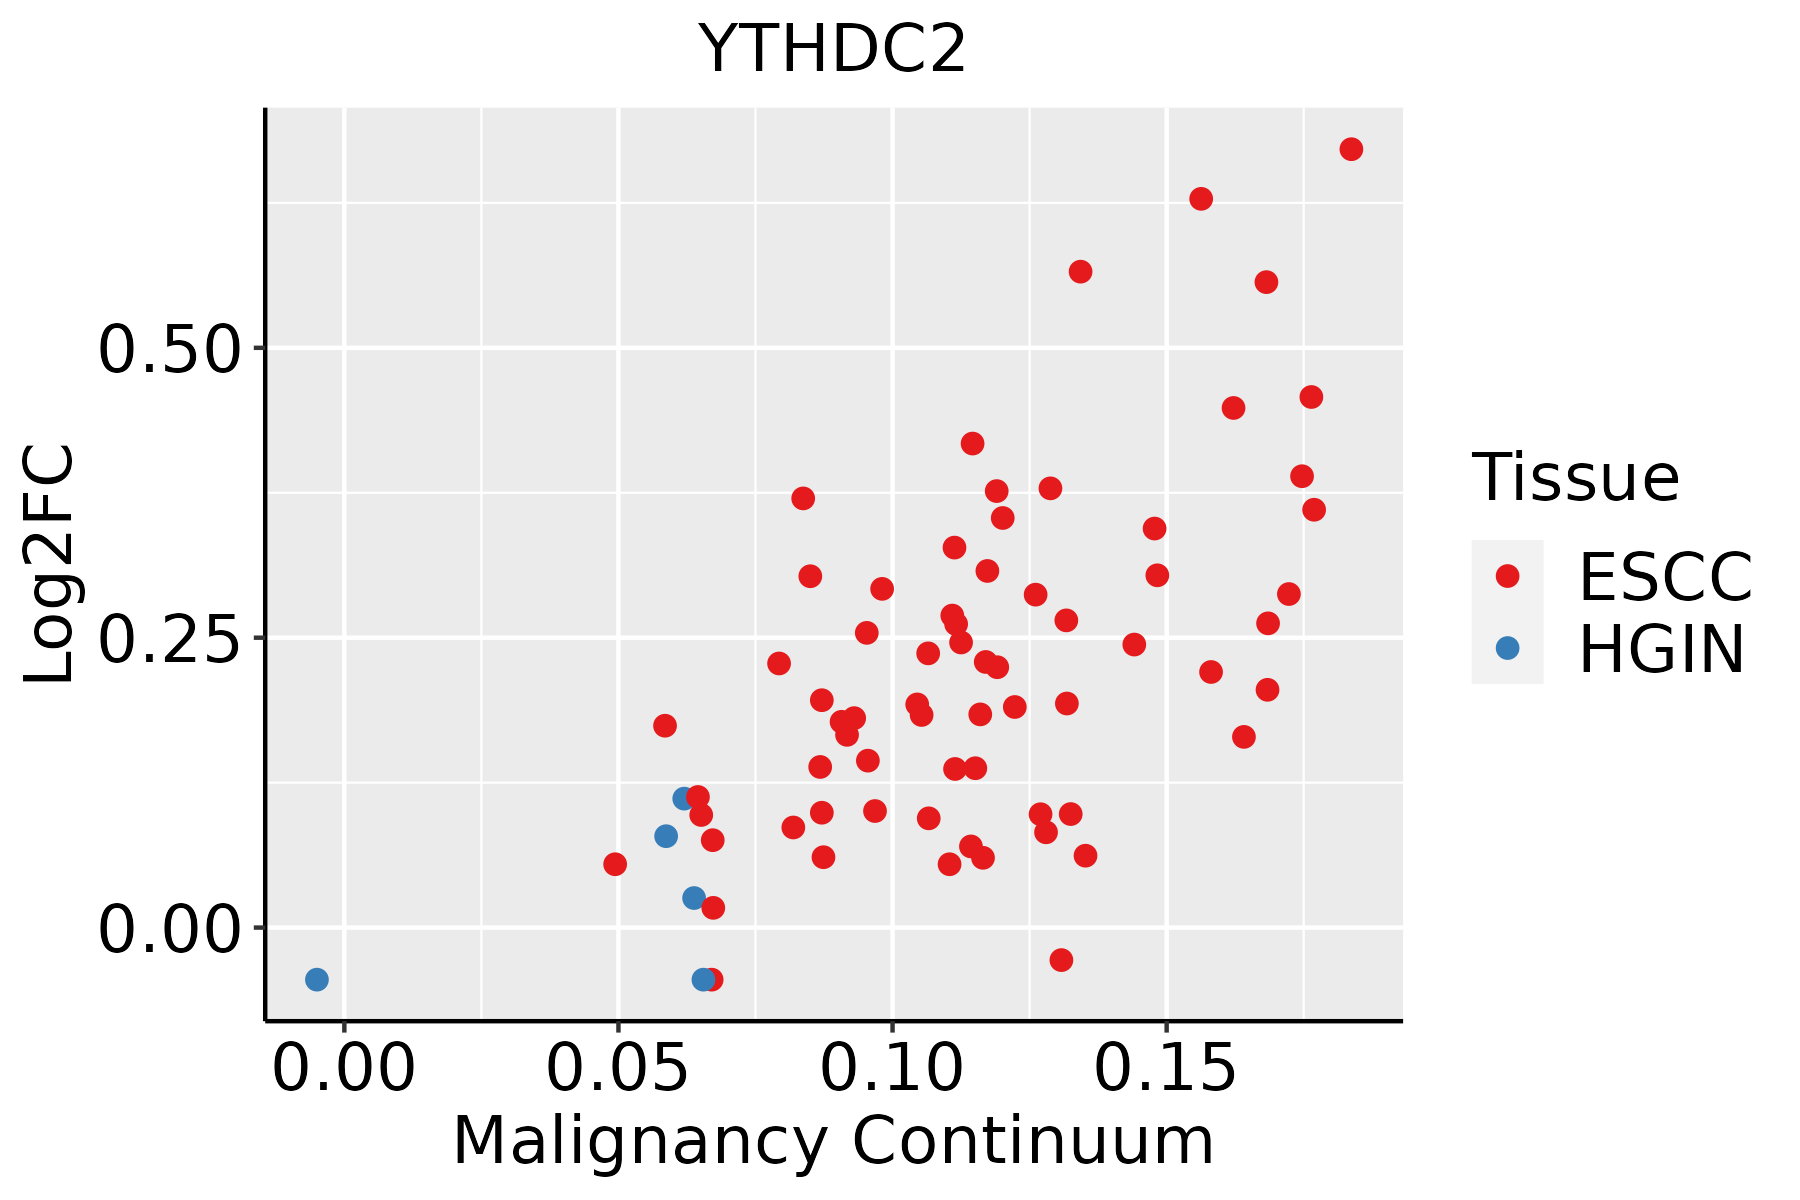 | ESCC: Esophageal squamous cell carcinoma |
| HGIN: High-grade intraepithelial neoplasias |
| LGIN: Low-grade intraepithelial neoplasias |
| Liver | 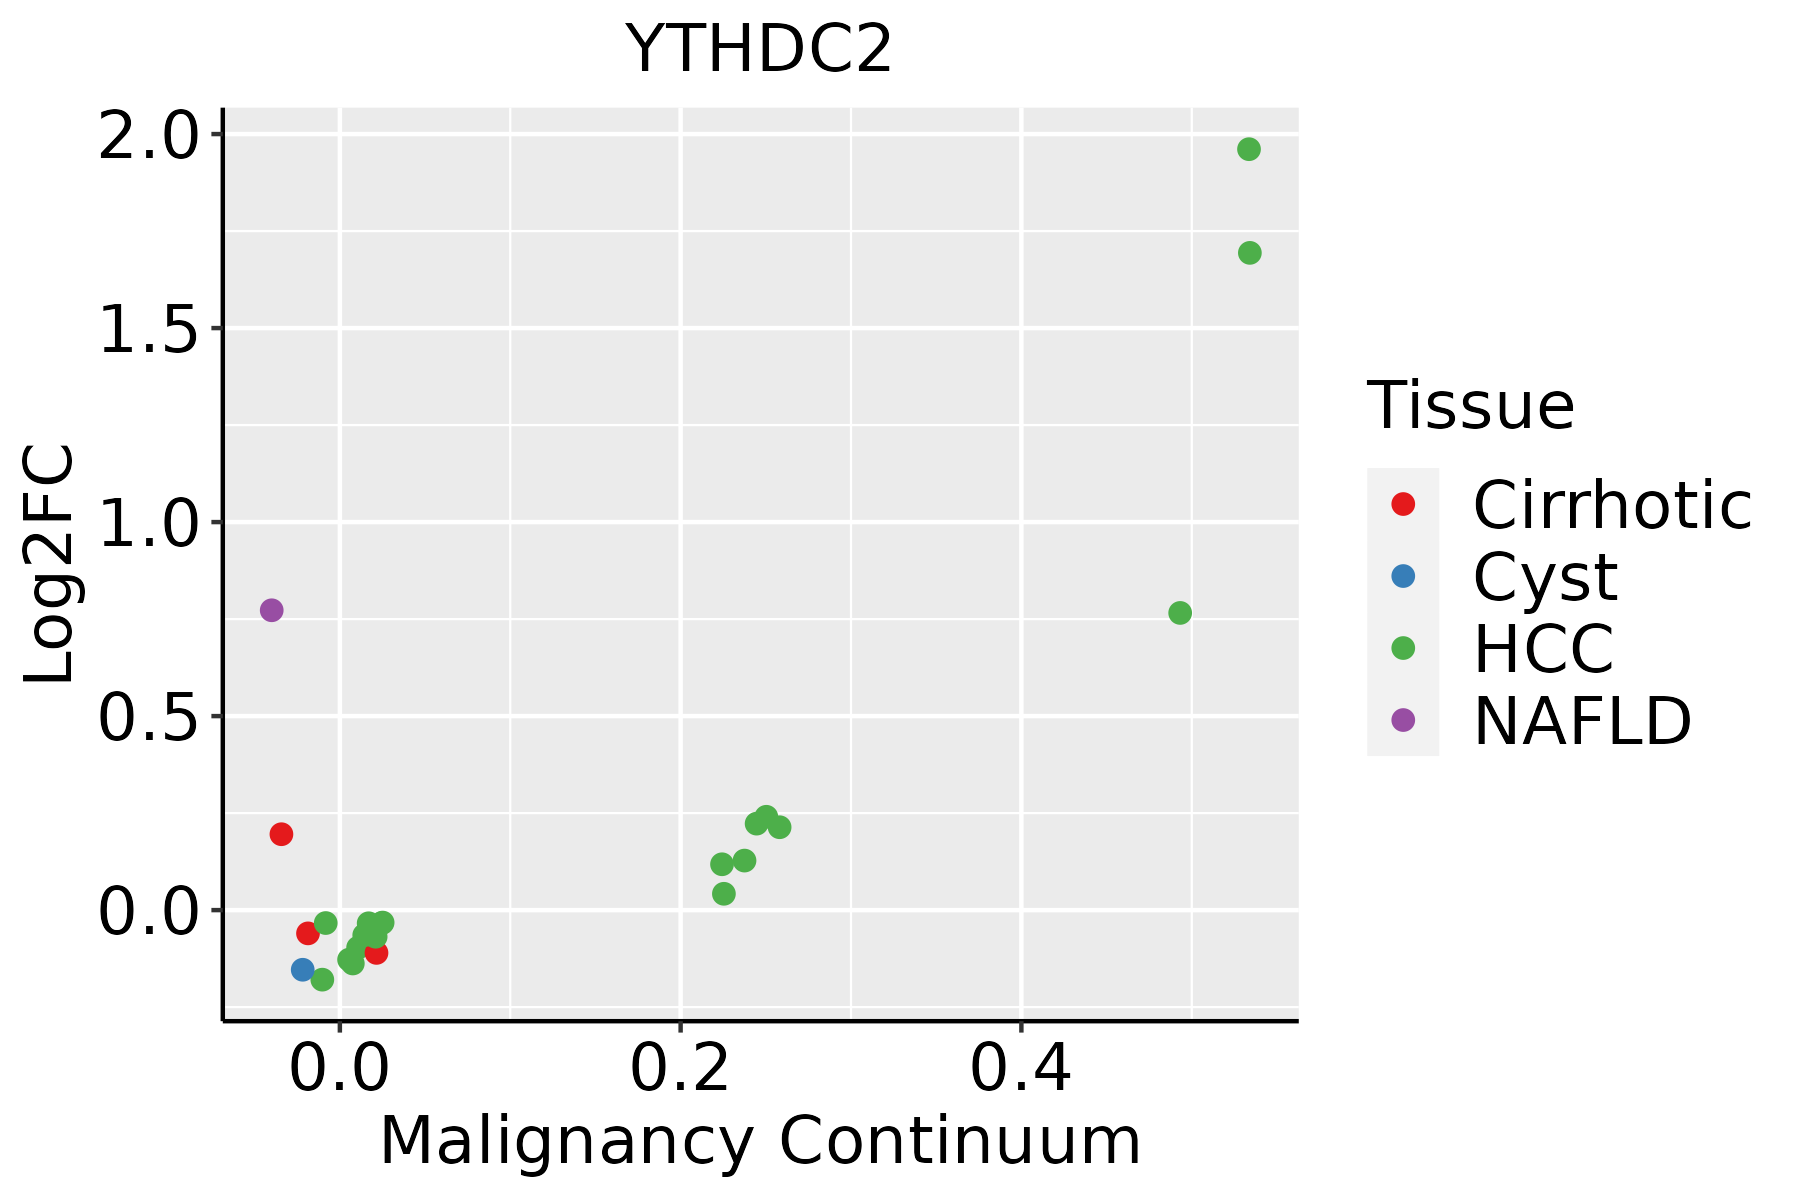 | HCC: Hepatocellular carcinoma |
| NAFLD: Non-alcoholic fatty liver disease |
| Skin | 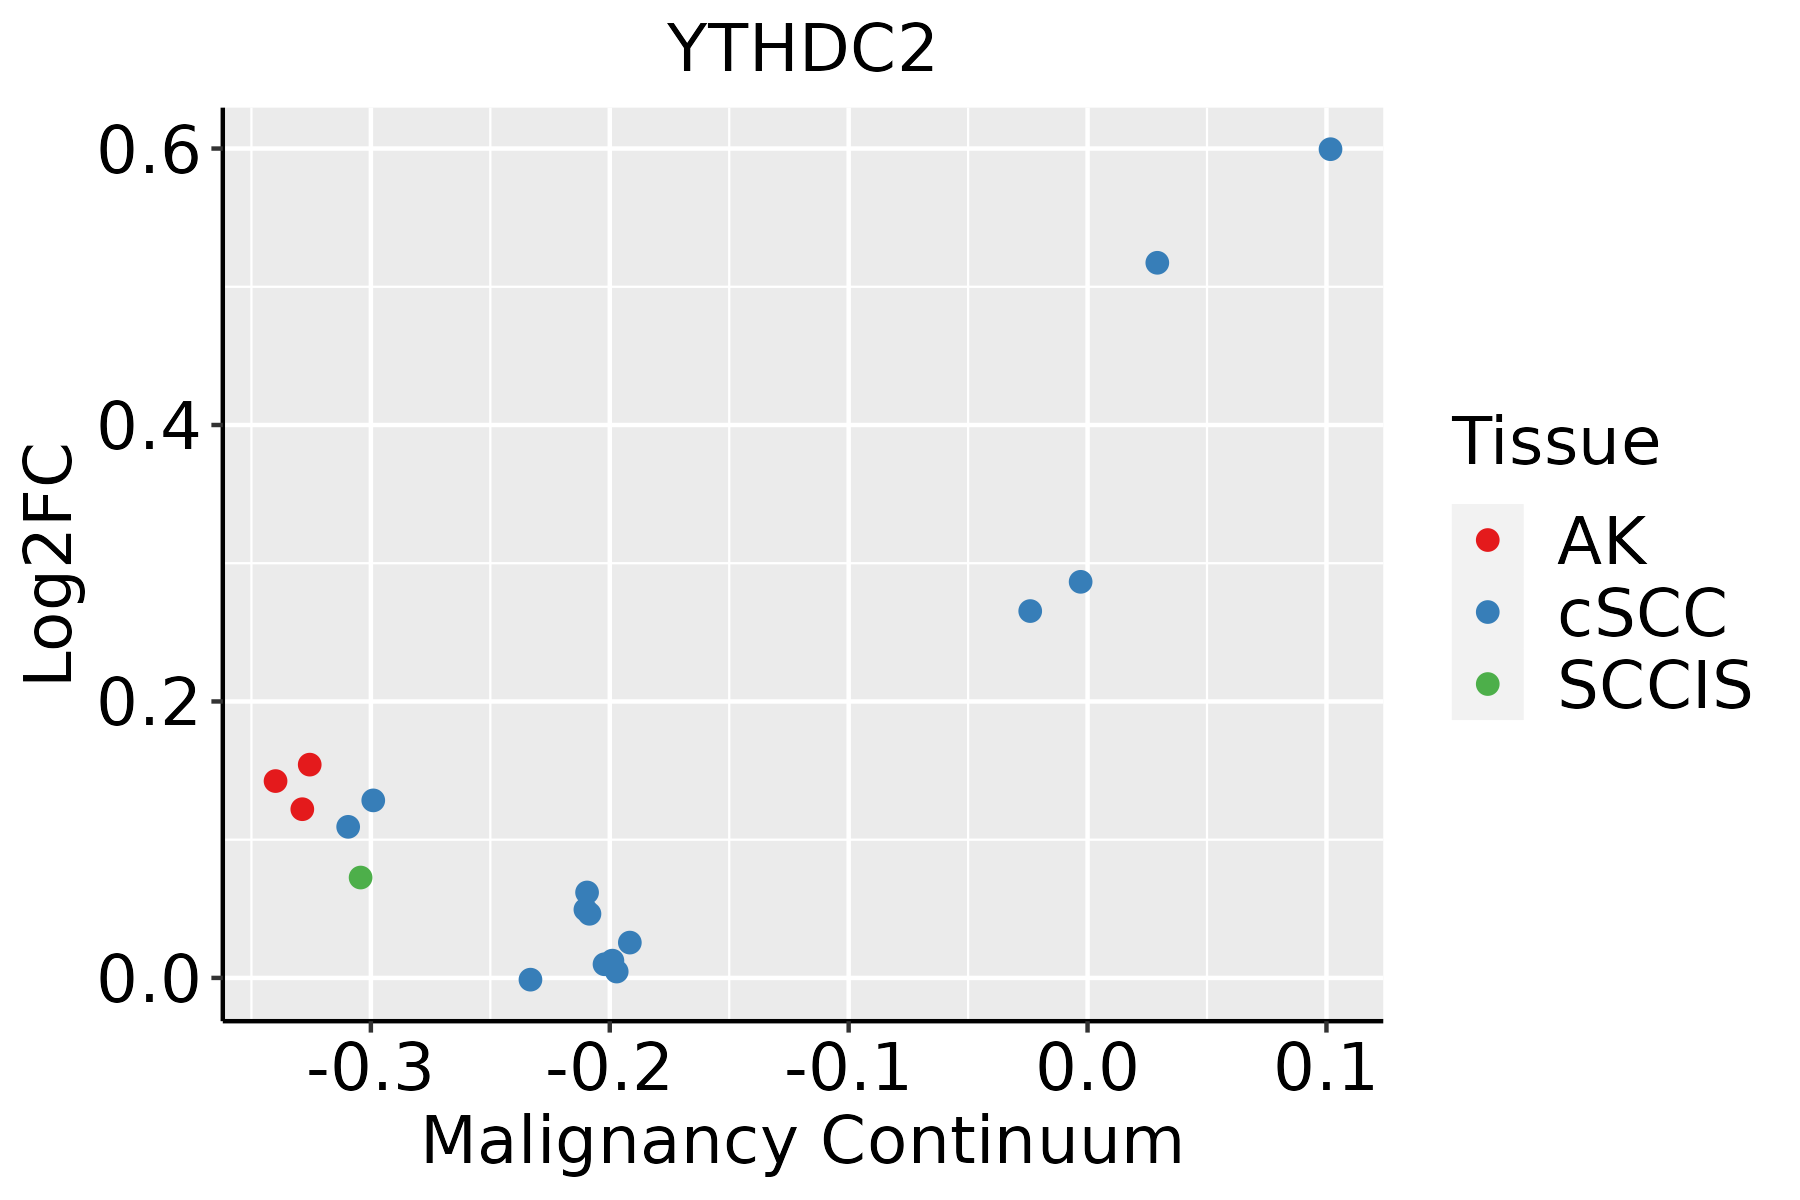 | AK: Actinic keratosis |
| cSCC: Cutaneous squamous cell carcinoma |
| SCCIS:squamous cell carcinoma in situ |
| Thyroid |  | ATC: Anaplastic thyroid cancer |
| HT: Hashimoto's thyroiditis |
| PTC: Papillary thyroid cancer |
| GO ID | Tissue | Disease Stage | Description | Gene Ratio | Bg Ratio | pvalue | p.adjust | Count |
| GO:001603210 | Cervix | CC | viral process | 109/2311 | 415/18723 | 5.40e-15 | 6.46e-12 | 109 |
| GO:001905810 | Cervix | CC | viral life cycle | 87/2311 | 317/18723 | 2.20e-13 | 1.20e-10 | 87 |
| GO:004440310 | Cervix | CC | biological process involved in symbiotic interaction | 71/2311 | 290/18723 | 7.94e-09 | 6.98e-07 | 71 |
| GO:001907910 | Cervix | CC | viral genome replication | 35/2311 | 131/18723 | 6.11e-06 | 1.49e-04 | 35 |
| GO:00457876 | Cervix | CC | positive regulation of cell cycle | 66/2311 | 313/18723 | 7.78e-06 | 1.81e-04 | 66 |
| GO:00073466 | Cervix | CC | regulation of mitotic cell cycle | 88/2311 | 457/18723 | 1.26e-05 | 2.60e-04 | 88 |
| GO:00346129 | Cervix | CC | response to tumor necrosis factor | 55/2311 | 253/18723 | 1.75e-05 | 3.32e-04 | 55 |
| GO:00457862 | Cervix | CC | negative regulation of cell cycle | 67/2311 | 385/18723 | 2.21e-03 | 1.59e-02 | 67 |
| GO:00459302 | Cervix | CC | negative regulation of mitotic cell cycle | 44/2311 | 235/18723 | 3.02e-03 | 1.99e-02 | 44 |
| GO:0016032 | Colorectum | AD | viral process | 168/3918 | 415/18723 | 4.67e-20 | 3.66e-17 | 168 |
| GO:0019058 | Colorectum | AD | viral life cycle | 119/3918 | 317/18723 | 6.18e-12 | 8.23e-10 | 119 |
| GO:0044403 | Colorectum | AD | biological process involved in symbiotic interaction | 99/3918 | 290/18723 | 1.02e-07 | 4.93e-06 | 99 |
| GO:0019079 | Colorectum | AD | viral genome replication | 51/3918 | 131/18723 | 1.83e-06 | 5.51e-05 | 51 |
| GO:0007346 | Colorectum | AD | regulation of mitotic cell cycle | 119/3918 | 457/18723 | 4.60e-03 | 3.14e-02 | 119 |
| GO:0035821 | Colorectum | AD | modulation of process of other organism | 34/3918 | 106/18723 | 4.73e-03 | 3.22e-02 | 34 |
| GO:0045787 | Colorectum | AD | positive regulation of cell cycle | 85/3918 | 313/18723 | 4.76e-03 | 3.22e-02 | 85 |
| GO:00160322 | Colorectum | MSS | viral process | 157/3467 | 415/18723 | 7.94e-21 | 6.19e-18 | 157 |
| GO:00190582 | Colorectum | MSS | viral life cycle | 111/3467 | 317/18723 | 1.65e-12 | 2.95e-10 | 111 |
| GO:00444032 | Colorectum | MSS | biological process involved in symbiotic interaction | 93/3467 | 290/18723 | 1.72e-08 | 9.85e-07 | 93 |
| GO:00190792 | Colorectum | MSS | viral genome replication | 49/3467 | 131/18723 | 2.73e-07 | 1.11e-05 | 49 |
| Hugo Symbol | Variant Class | Variant Classification | dbSNP RS | HGVSc | HGVSp | HGVSp Short | SWISSPROT | BIOTYPE | SIFT | PolyPhen | Tumor Sample Barcode | Tissue | Histology | Sex | Age | Stage | Therapy Types | Drugs | Outcome |
| YTHDC2 | SNV | Missense_Mutation | | c.1936N>A | p.Asp646Asn | p.D646N | Q9H6S0 | protein_coding | tolerated(0.07) | possibly_damaging(0.614) | TCGA-D8-A1J8-01 | Breast | breast invasive carcinoma | Female | >=65 | I/II | Hormone Therapy | nolvadex | SD |
| YTHDC2 | SNV | Missense_Mutation | rs144091848 | c.3842C>T | p.Ser1281Leu | p.S1281L | Q9H6S0 | protein_coding | tolerated(0.09) | benign(0.03) | TCGA-D8-A1Y1-01 | Breast | breast invasive carcinoma | Female | >=65 | III/IV | Hormone Therapy | tamoxiphen | PD |
| YTHDC2 | insertion | Nonsense_Mutation | novel | c.1610_1611insGGACTAGGTCA | p.Ser538AspfsTer2 | p.S538Dfs*2 | Q9H6S0 | protein_coding | | | TCGA-A2-A04Y-01 | Breast | breast invasive carcinoma | Female | <65 | I/II | Chemotherapy | cytoxan | SD |
| YTHDC2 | insertion | Frame_Shift_Ins | novel | c.2788_2789insCTCCAGTCACAGGAAGGAAGGAACAGGTGATTTCTTGTTACTTATCCTC | p.Met930ThrfsTer32 | p.M930Tfs*32 | Q9H6S0 | protein_coding | | | TCGA-A2-A0CQ-01 | Breast | breast invasive carcinoma | Female | <65 | I/II | Chemotherapy | adriamycin | SD |
| YTHDC2 | insertion | Nonsense_Mutation | novel | c.1082_1083insTAACACTATACCACCTTACAGGTAGTGCGAGTACCTTAAATAACA | p.Gly361_Ser362insAsnThrIleProProTyrArgTerCysGluTyrLeuLysTerGln | p.G361_S362insNTIPPYR*CEYLK*Q | Q9H6S0 | protein_coding | | | TCGA-AN-A041-01 | Breast | breast invasive carcinoma | Female | <65 | I/II | Unknown | Unknown | SD |
| YTHDC2 | SNV | Missense_Mutation | | c.1411N>A | p.Ala471Thr | p.A471T | Q9H6S0 | protein_coding | tolerated(0.34) | benign(0.013) | TCGA-EK-A3GM-01 | Cervix | cervical & endocervical cancer | Female | >=65 | I/II | Unknown | Unknown | SD |
| YTHDC2 | SNV | Missense_Mutation | | c.563N>G | p.Ser188Cys | p.S188C | Q9H6S0 | protein_coding | tolerated(0.1) | possibly_damaging(0.662) | TCGA-FU-A23L-01 | Cervix | cervical & endocervical cancer | Female | <65 | I/II | Chemotherapy | cisplatin | CR |
| YTHDC2 | SNV | Missense_Mutation | | c.2010N>C | p.Gln670His | p.Q670H | Q9H6S0 | protein_coding | deleterious(0) | possibly_damaging(0.655) | TCGA-FU-A3HZ-01 | Cervix | cervical & endocervical cancer | Female | <65 | I/II | Chemotherapy | cisplatin | CR |
| YTHDC2 | SNV | Missense_Mutation | | c.4129N>A | p.Glu1377Lys | p.E1377K | Q9H6S0 | protein_coding | tolerated(0.24) | possibly_damaging(0.886) | TCGA-FU-A3HZ-01 | Cervix | cervical & endocervical cancer | Female | <65 | I/II | Chemotherapy | cisplatin | CR |
| YTHDC2 | SNV | Missense_Mutation | | c.4273N>C | p.Glu1425Gln | p.E1425Q | Q9H6S0 | protein_coding | tolerated_low_confidence(0.59) | benign(0.074) | TCGA-IR-A3LI-01 | Cervix | cervical & endocervical cancer | Female | <65 | I/II | Chemotherapy | cisplatin | CR |


