
|
|||||
|
 | |
| |
| |
| |
| |
| |
|
Gene: YME1L1 |
Gene summary for YME1L1 |
| Gene information | Species | Human | Gene symbol | YME1L1 | Gene ID | 10730 |
| Gene name | YME1 like 1 ATPase | |
| Gene Alias | FTSH | |
| Cytomap | 10p12.1 | |
| Gene Type | protein-coding | GO ID | GO:0006508 | UniProtAcc | Q96TA2 |
Top |
Malignant transformation analysis |
| Identification of the aberrant gene expression in precancerous and cancerous lesions by comparing the gene expression of stem-like cells in diseased tissues with normal stem cells |
| Entrez ID | Symbol | Replicates | Species | Organ | Tissue | Adj P-value | Log2FC | Malignancy |
| 10730 | YME1L1 | HTA11_78_2000001011 | Human | Colorectum | AD | 5.54e-03 | 4.22e-01 | -0.1088 |
| 10730 | YME1L1 | HTA11_347_2000001011 | Human | Colorectum | AD | 7.11e-12 | 5.17e-01 | -0.1954 |
| 10730 | YME1L1 | A015-C-203 | Human | Colorectum | FAP | 1.26e-10 | -2.40e-01 | -0.1294 |
| 10730 | YME1L1 | A015-C-204 | Human | Colorectum | FAP | 2.15e-02 | -2.55e-01 | -0.0228 |
| 10730 | YME1L1 | A002-C-201 | Human | Colorectum | FAP | 1.64e-04 | -2.43e-01 | 0.0324 |
| 10730 | YME1L1 | A001-C-108 | Human | Colorectum | FAP | 1.34e-04 | -1.04e-01 | -0.0272 |
| 10730 | YME1L1 | A002-C-205 | Human | Colorectum | FAP | 6.69e-08 | -2.67e-01 | -0.1236 |
| 10730 | YME1L1 | A015-C-006 | Human | Colorectum | FAP | 1.37e-05 | -2.85e-01 | -0.0994 |
| 10730 | YME1L1 | A015-C-106 | Human | Colorectum | FAP | 3.28e-04 | -2.21e-01 | -0.0511 |
| 10730 | YME1L1 | A002-C-114 | Human | Colorectum | FAP | 1.11e-07 | -3.01e-01 | -0.1561 |
| 10730 | YME1L1 | A015-C-104 | Human | Colorectum | FAP | 4.23e-12 | -1.25e-01 | -0.1899 |
| 10730 | YME1L1 | A001-C-014 | Human | Colorectum | FAP | 4.03e-05 | -2.07e-01 | 0.0135 |
| 10730 | YME1L1 | A002-C-016 | Human | Colorectum | FAP | 5.28e-09 | -2.74e-01 | 0.0521 |
| 10730 | YME1L1 | A015-C-002 | Human | Colorectum | FAP | 1.09e-03 | -2.73e-01 | -0.0763 |
| 10730 | YME1L1 | A001-C-203 | Human | Colorectum | FAP | 1.48e-03 | -1.22e-01 | -0.0481 |
| 10730 | YME1L1 | A002-C-116 | Human | Colorectum | FAP | 5.70e-17 | -2.63e-01 | -0.0452 |
| 10730 | YME1L1 | A014-C-008 | Human | Colorectum | FAP | 8.66e-04 | -2.43e-01 | -0.191 |
| 10730 | YME1L1 | A018-E-020 | Human | Colorectum | FAP | 6.73e-07 | -1.77e-01 | -0.2034 |
| 10730 | YME1L1 | F034 | Human | Colorectum | FAP | 4.21e-08 | -2.51e-01 | -0.0665 |
| 10730 | YME1L1 | CRC-3-11773 | Human | Colorectum | CRC | 1.08e-02 | -1.55e-01 | 0.2564 |
| Page: 1 2 3 4 5 6 7 8 9 |
| Tissue | Expression Dynamics | Abbreviation |
| Colorectum (GSE201348) |  | FAP: Familial adenomatous polyposis |
| CRC: Colorectal cancer | ||
| Colorectum (HTA11) | 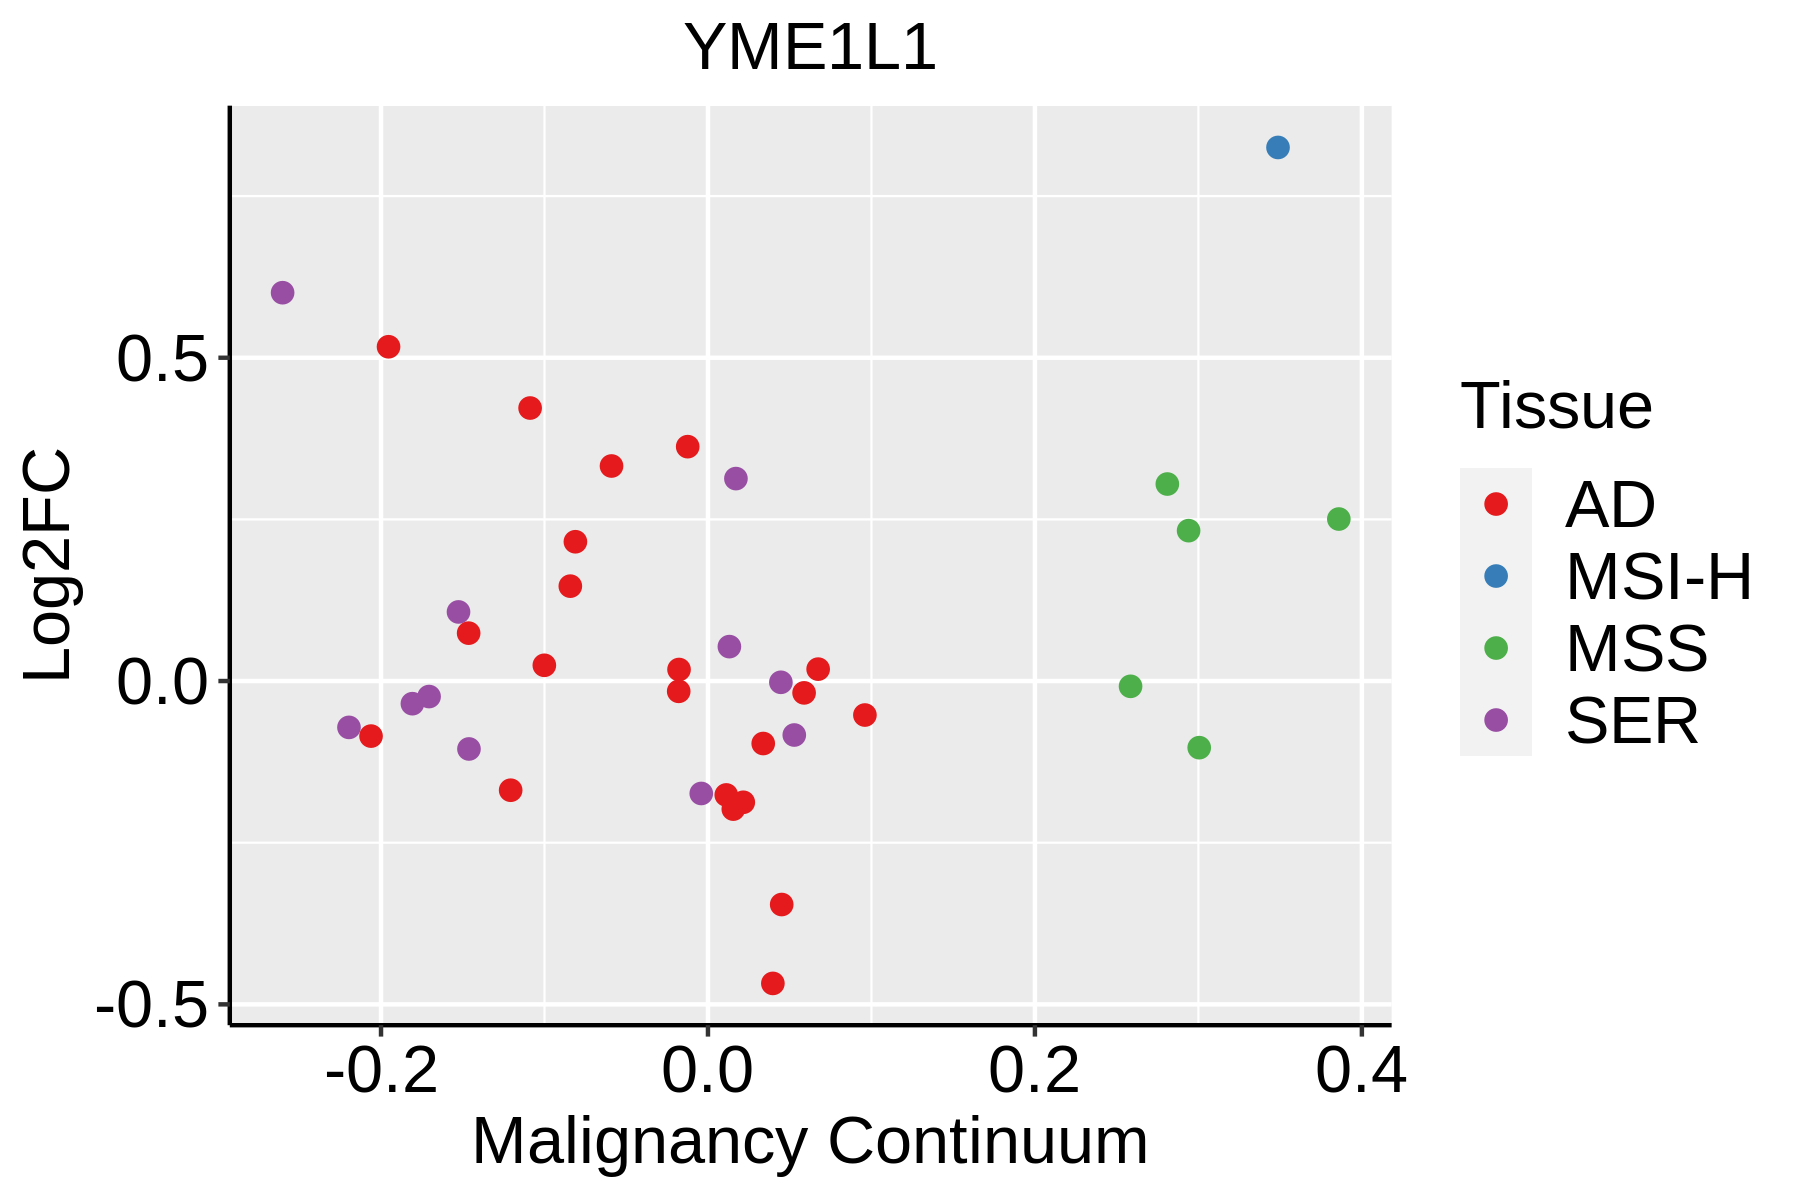 | AD: Adenomas |
| SER: Sessile serrated lesions | ||
| MSI-H: Microsatellite-high colorectal cancer | ||
| MSS: Microsatellite stable colorectal cancer | ||
| Esophagus |  | ESCC: Esophageal squamous cell carcinoma |
| HGIN: High-grade intraepithelial neoplasias | ||
| LGIN: Low-grade intraepithelial neoplasias | ||
| Liver |  | HCC: Hepatocellular carcinoma |
| NAFLD: Non-alcoholic fatty liver disease | ||
| Oral Cavity |  | EOLP: Erosive Oral lichen planus |
| LP: leukoplakia | ||
| NEOLP: Non-erosive oral lichen planus | ||
| OSCC: Oral squamous cell carcinoma | ||
| Prostate | 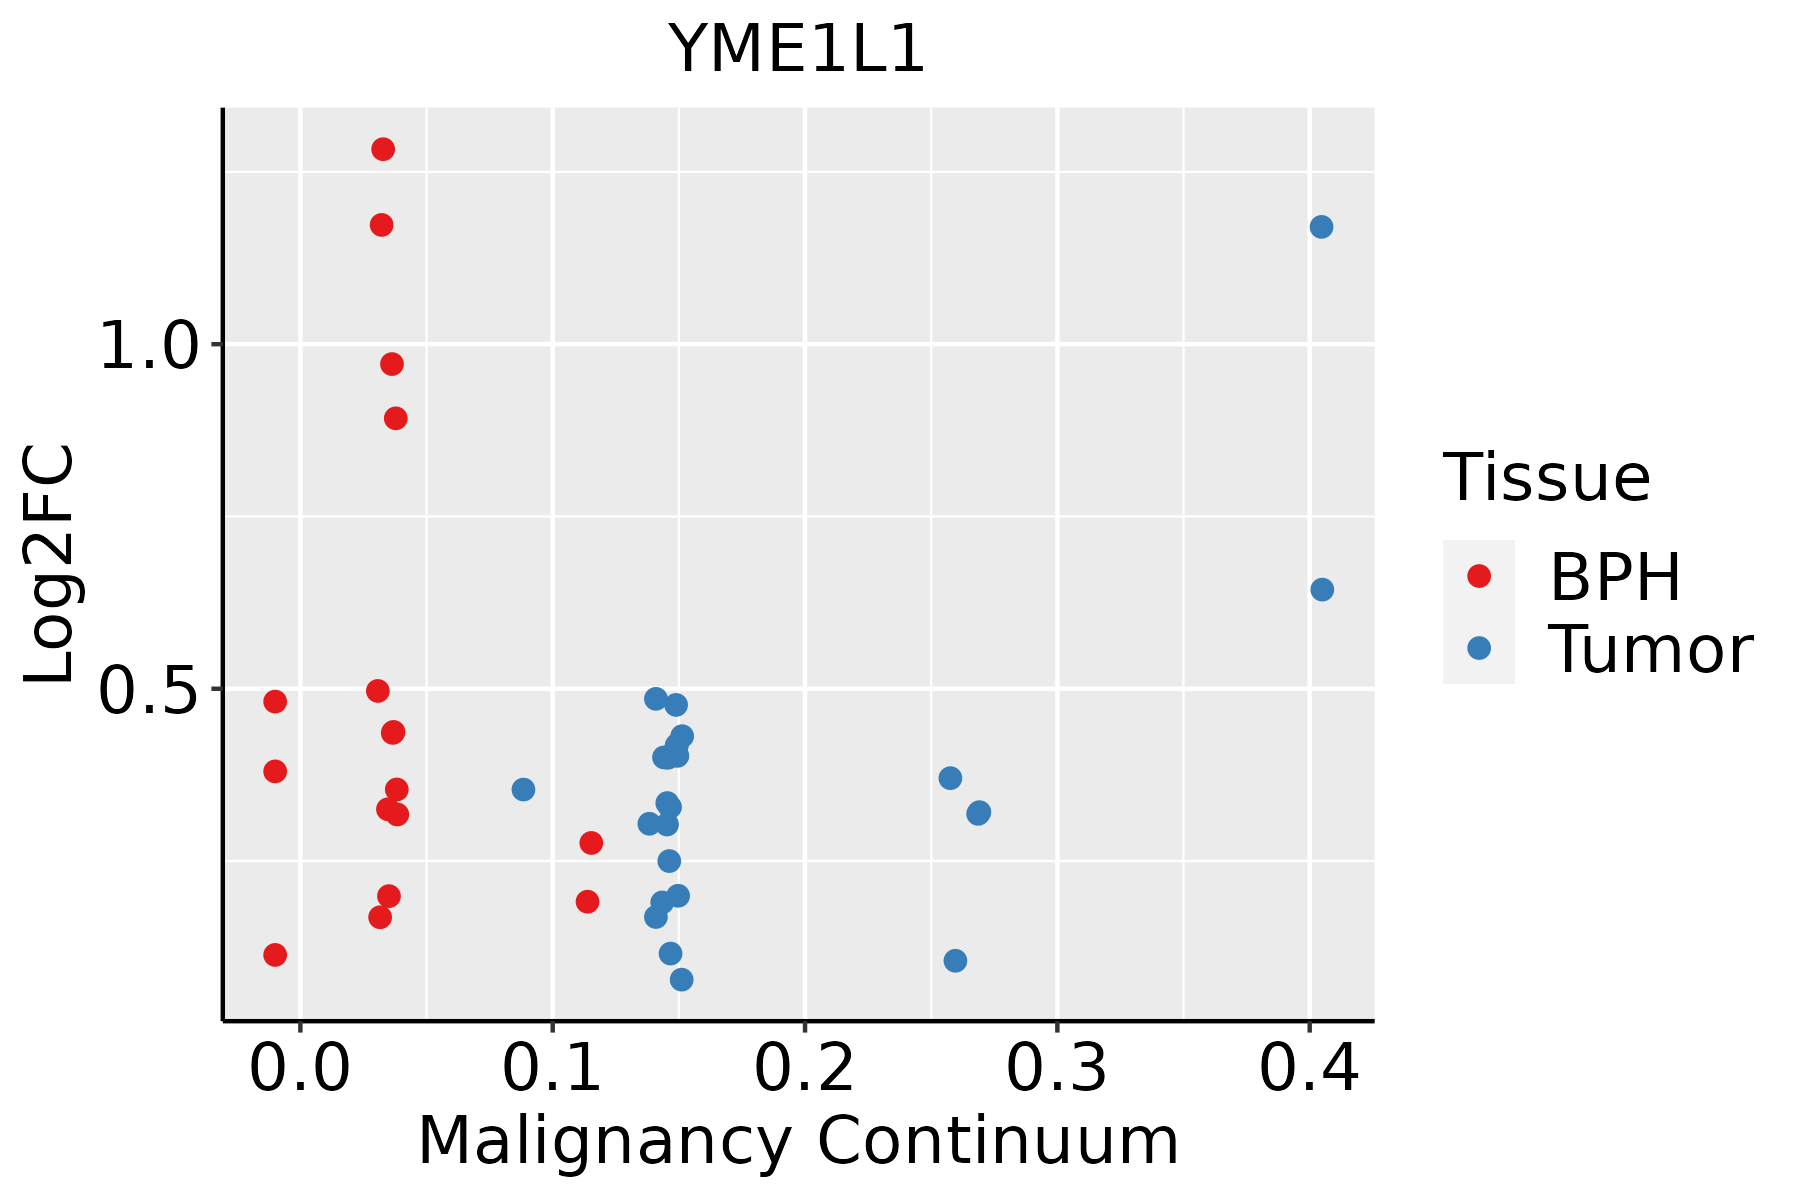 | BPH: Benign Prostatic Hyperplasia |
| Skin |  | AK: Actinic keratosis |
| cSCC: Cutaneous squamous cell carcinoma | ||
| SCCIS:squamous cell carcinoma in situ | ||
| Thyroid | 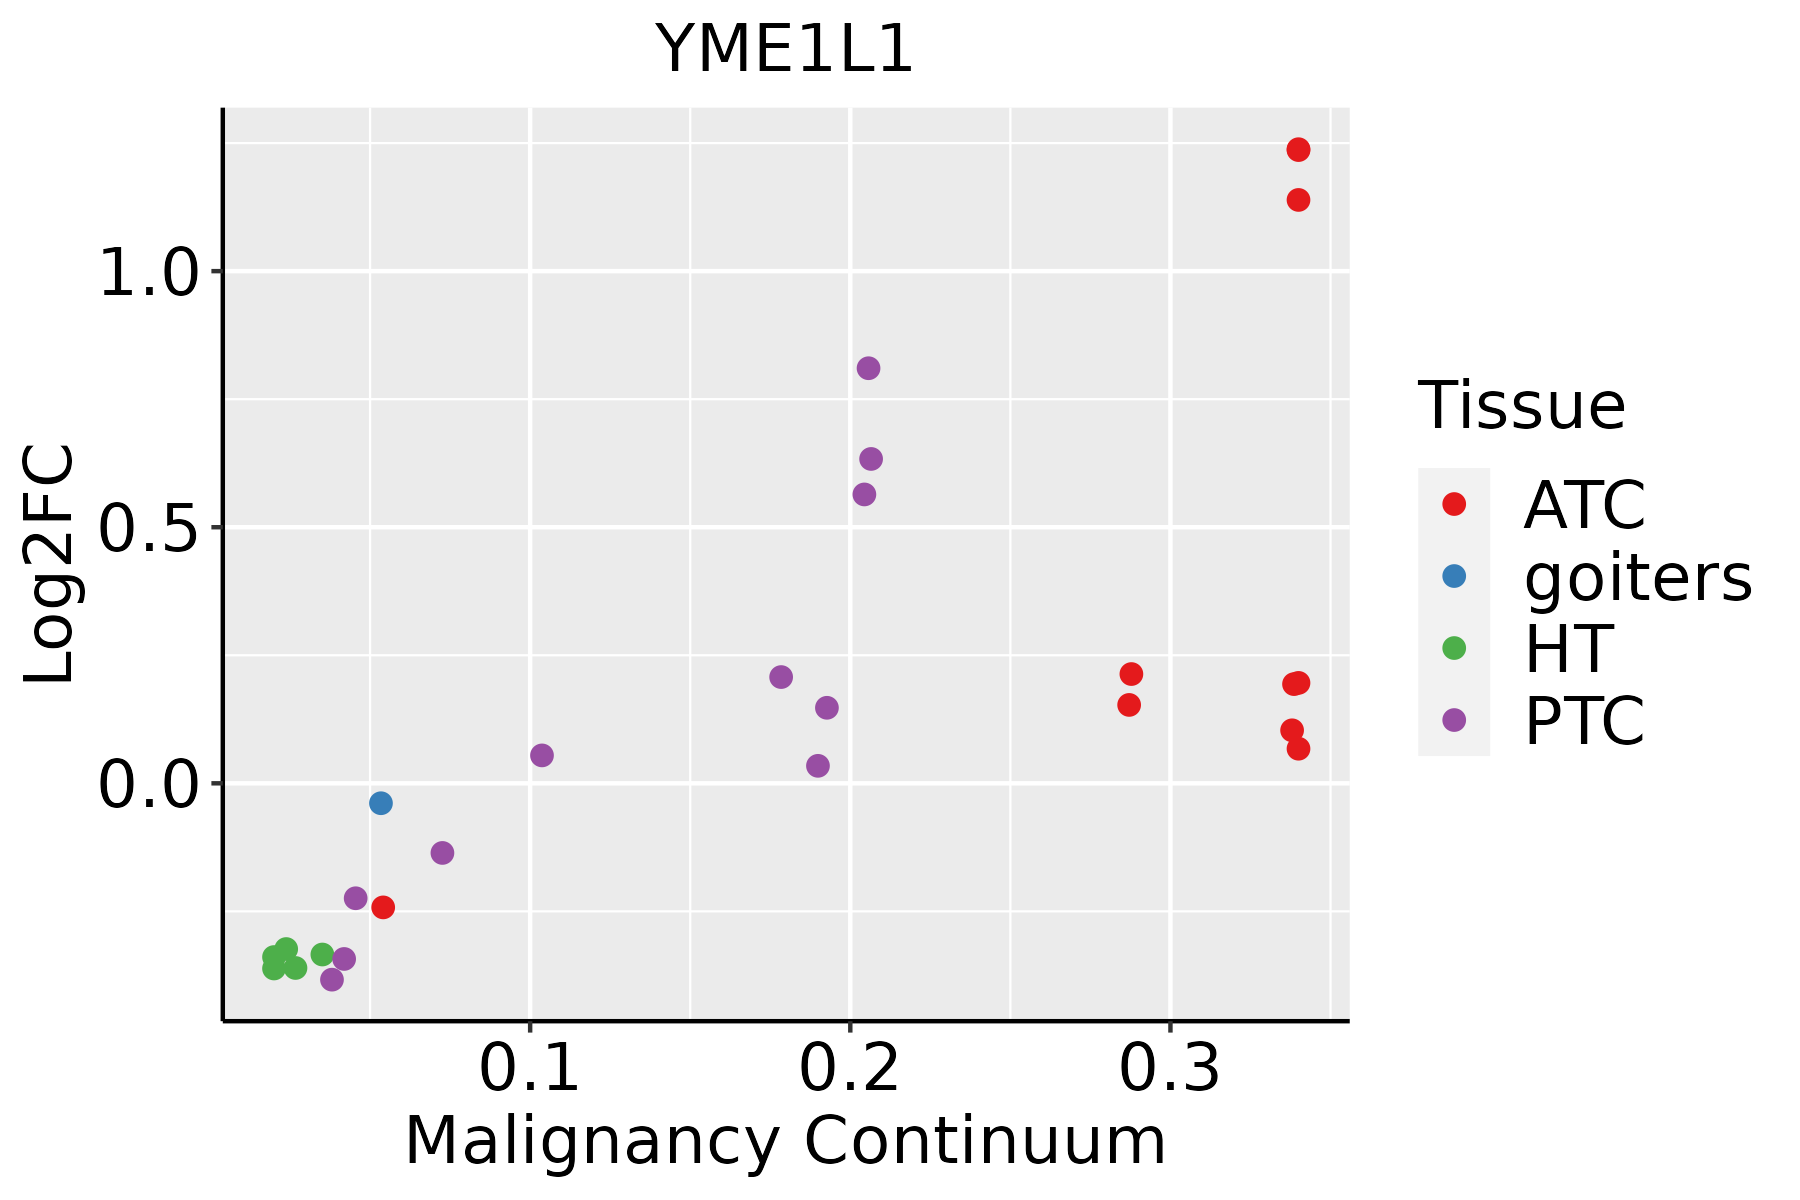 | ATC: Anaplastic thyroid cancer |
| HT: Hashimoto's thyroiditis | ||
| PTC: Papillary thyroid cancer |
| ∗log2FC in expression of this searched gene in stem-like cells from each diseased tissue sample relative to stem-like cells in normal samples in each tissue plotted against the malignancy continuum. Samples are colored based on if they are from different disease stage. |
Top |
Malignant transformation related pathway analysis |
| Find out the enriched GO biological processes and KEGG pathways involved in transition from healthy to precancer to cancer |
| Tissue | Disease Stage | Enriched GO biological Processes |
| Colorectum | AD |  |
| Colorectum | SER |  |
| Colorectum | MSS |  |
| Colorectum | MSI-H |  |
| Colorectum | FAP |  |
| ∗Top 15 enriched GO BP terms are showed in the bar plot of each disease state in each tissue. Each row represents a significant GO biological process which is colored according to the -log10(p.adjust). |
| Page: 1 2 3 4 5 6 7 8 9 |
| GO ID | Tissue | Disease Stage | Description | Gene Ratio | Bg Ratio | pvalue | p.adjust | Count |
| GO:0006515 | Colorectum | AD | protein quality control for misfolded or incompletely synthesized proteins | 14/3918 | 28/18723 | 6.01e-04 | 6.33e-03 | 14 |
| GO:0051604 | Colorectum | AD | protein maturation | 85/3918 | 294/18723 | 6.73e-04 | 6.91e-03 | 85 |
| GO:0016485 | Colorectum | AD | protein processing | 63/3918 | 225/18723 | 6.77e-03 | 4.19e-02 | 63 |
| GO:00516044 | Colorectum | CRC | protein maturation | 47/2078 | 294/18723 | 6.52e-03 | 4.70e-02 | 47 |
| GO:005160417 | Esophagus | HGIN | protein maturation | 68/2587 | 294/18723 | 9.77e-06 | 2.86e-04 | 68 |
| GO:00164857 | Esophagus | HGIN | protein processing | 49/2587 | 225/18723 | 7.04e-04 | 9.52e-03 | 49 |
| GO:005160418 | Esophagus | ESCC | protein maturation | 189/8552 | 294/18723 | 7.64e-11 | 2.39e-09 | 189 |
| GO:001648514 | Esophagus | ESCC | protein processing | 134/8552 | 225/18723 | 1.81e-05 | 1.60e-04 | 134 |
| GO:00065154 | Esophagus | ESCC | protein quality control for misfolded or incompletely synthesized proteins | 21/8552 | 28/18723 | 1.57e-03 | 7.33e-03 | 21 |
| GO:00512592 | Esophagus | ESCC | protein complex oligomerization | 130/8552 | 238/18723 | 3.29e-03 | 1.36e-02 | 130 |
| GO:00065153 | Liver | NAFLD | protein quality control for misfolded or incompletely synthesized proteins | 10/1882 | 28/18723 | 2.46e-04 | 4.09e-03 | 10 |
| GO:00516046 | Liver | Cirrhotic | protein maturation | 121/4634 | 294/18723 | 3.54e-10 | 1.68e-08 | 121 |
| GO:00164853 | Liver | Cirrhotic | protein processing | 85/4634 | 225/18723 | 9.01e-06 | 1.32e-04 | 85 |
| GO:000651511 | Liver | Cirrhotic | protein quality control for misfolded or incompletely synthesized proteins | 16/4634 | 28/18723 | 2.53e-04 | 2.27e-03 | 16 |
| GO:005160412 | Liver | HCC | protein maturation | 171/7958 | 294/18723 | 3.80e-08 | 8.30e-07 | 171 |
| GO:000651521 | Liver | HCC | protein quality control for misfolded or incompletely synthesized proteins | 24/7958 | 28/18723 | 3.01e-06 | 3.99e-05 | 24 |
| GO:001648511 | Liver | HCC | protein processing | 121/7958 | 225/18723 | 4.01e-04 | 2.71e-03 | 121 |
| GO:005160410 | Oral cavity | OSCC | protein maturation | 170/7305 | 294/18723 | 3.97e-11 | 1.28e-09 | 170 |
| GO:00164856 | Oral cavity | OSCC | protein processing | 121/7305 | 225/18723 | 4.56e-06 | 5.23e-05 | 121 |
| GO:0051259 | Oral cavity | OSCC | protein complex oligomerization | 121/7305 | 238/18723 | 1.29e-04 | 9.21e-04 | 121 |
| Page: 1 2 3 |
| Pathway ID | Tissue | Disease Stage | Description | Gene Ratio | Bg Ratio | pvalue | p.adjust | qvalue | Count |
| Page: 1 |
Top |
Cell-cell communication analysis |
| Identification of potential cell-cell interactions between two cell types and their ligand-receptor pairs for different disease states |
| Ligand | Receptor | LRpair | Pathway | Tissue | Disease Stage |
| Page: 1 |
Top |
Single-cell gene regulatory network inference analysis |
| Find out the significant the regulons (TFs) and the target genes of each regulon across cell types for different disease states |
| TF | Cell Type | Tissue | Disease Stage | Target Gene | RSS | Regulon Activity |
| ∗The dot plots of a searched regulon are shown for all cell subpopulations in each disease state of each tissue based on the regulon specific score inferred using pySCENIC and by calculating the average expression. |
| Page: 1 |
Top |
Somatic mutation of malignant transformation related genes |
| Annotation of somatic variants for genes involved in malignant transformation |
| Hugo Symbol | Variant Class | Variant Classification | dbSNP RS | HGVSc | HGVSp | HGVSp Short | SWISSPROT | BIOTYPE | SIFT | PolyPhen | Tumor Sample Barcode | Tissue | Histology | Sex | Age | Stage | Therapy Types | Drugs | Outcome |
| YME1L1 | SNV | Missense_Mutation | rs778140275 | c.1535N>A | p.Arg512Gln | p.R512Q | Q96TA2 | protein_coding | deleterious(0) | probably_damaging(1) | TCGA-AN-A046-01 | Breast | breast invasive carcinoma | Female | >=65 | I/II | Unknown | Unknown | SD |
| YME1L1 | SNV | Missense_Mutation | c.1228N>C | p.Glu410Gln | p.E410Q | Q96TA2 | protein_coding | deleterious(0) | probably_damaging(0.998) | TCGA-AR-A0TX-01 | Breast | breast invasive carcinoma | Female | <65 | I/II | Unknown | Unknown | SD | |
| YME1L1 | SNV | Missense_Mutation | c.431N>C | p.Lys144Thr | p.K144T | Q96TA2 | protein_coding | tolerated(0.61) | benign(0) | TCGA-BH-A0BZ-01 | Breast | breast invasive carcinoma | Female | <65 | III/IV | Chemotherapy | doxorubicin | CR | |
| YME1L1 | SNV | Missense_Mutation | c.191N>T | p.Thr64Met | p.T64M | Q96TA2 | protein_coding | tolerated_low_confidence(0.13) | probably_damaging(0.93) | TCGA-BH-A0C1-01 | Breast | breast invasive carcinoma | Female | <65 | III/IV | Chemotherapy | adriamycin | PD | |
| YME1L1 | SNV | Missense_Mutation | c.490N>A | p.Glu164Lys | p.E164K | Q96TA2 | protein_coding | tolerated(0.09) | benign(0.367) | TCGA-D8-A27G-01 | Breast | breast invasive carcinoma | Female | >=65 | I/II | Unknown | Unknown | SD | |
| YME1L1 | SNV | Missense_Mutation | c.115T>C | p.Ser39Pro | p.S39P | Q96TA2 | protein_coding | tolerated_low_confidence(0.16) | benign(0.093) | TCGA-E2-A1IH-01 | Breast | breast invasive carcinoma | Female | >=65 | I/II | Hormone Therapy | aromasin | SD | |
| YME1L1 | SNV | Missense_Mutation | novel | c.390N>C | p.Gln130His | p.Q130H | Q96TA2 | protein_coding | tolerated(0.09) | benign(0.017) | TCGA-E2-A2P6-01 | Breast | breast invasive carcinoma | Female | >=65 | I/II | Hormone Therapy | anastrozole | SD |
| YME1L1 | insertion | Nonsense_Mutation | novel | c.72_73insTGAGCCTAGGAGGCAGAGGTCGCTGTGAGCCAAGATCGC | p.His24_Thr25insTer | p.H24_T25ins* | Q96TA2 | protein_coding | TCGA-AN-A0FX-01 | Breast | breast invasive carcinoma | Female | <65 | I/II | Unknown | Unknown | SD | ||
| YME1L1 | SNV | Missense_Mutation | novel | c.985G>T | p.Asp329Tyr | p.D329Y | Q96TA2 | protein_coding | tolerated(0.06) | probably_damaging(0.942) | TCGA-2W-A8YY-01 | Cervix | cervical & endocervical cancer | Female | <65 | I/II | Chemotherapy | cisplatin | CR |
| YME1L1 | SNV | Missense_Mutation | rs766325012 | c.695C>T | p.Ala232Val | p.A232V | Q96TA2 | protein_coding | tolerated(0.57) | benign(0.047) | TCGA-2W-A8YY-01 | Cervix | cervical & endocervical cancer | Female | <65 | I/II | Chemotherapy | cisplatin | CR |
| Page: 1 2 3 4 5 6 7 8 9 |
Top |
Related drugs of malignant transformation related genes |
| Identification of chemicals and drugs interact with genes involved in malignant transfromation |
| (DGIdb 4.0) |
| Entrez ID | Symbol | Category | Interaction Types | Drug Claim Name | Drug Name | PMIDs |
| Page: 1 |

Copyright 2023-Present -The University of Texas Health Science Center at Houston |