Schematic overview of the cellular and molecular mechanisms involved in the cancer progression, including the proposed cellular and molecular mechanisms in cancer cells trajectory. AT1: alveolar type 1 cells; AT2: alveolar type 2 cells; AAH: atypical adenomatous hyperplasia; AIS: adenocarcinoma in situ; MIA: minimally invasive adenocarcinoma; IA: invasive adenocarcinoma; EMT: epithelial-mesenchymal transition

Home

Download

Statistics

Help

Contact

Center for Computational Systems Medicine
leaf

Gene summary

leaf

Malignant transformation analysis

leaf

Malignant transformation related pathway analysis

leaf

Cell-cell communication analysis

leaf

Single-cell gene regulatory network inference analysis

leaf

Somatic mutation of malignant transformation related genes

leaf

Related drugs of malignant transformation related genes

Gene: YIPF6

Gene summary for YIPF6

check button Gene summary.

Gene informationSpeciesHuman
Gene symbol

YIPF6

Gene ID

286451

Gene nameYip1 domain family member 6
Gene AliasFinGER6
CytomapXq12-q13.1
Gene Typeprotein-coding
GO ID

GO:0002064

UniProtAcc

Q96EC8


Top

Malignant transformation analysis

check button Identification of the aberrant gene expression in precancerous and cancerous lesions by comparing the gene expression of stem-like cells in diseased tissues with normal stem cells
check button Malignant transformation involving gene list.
Entrez IDSymbolReplicatesSpeciesOrganTissueAdj P-valueLog2FCMalignancy
286451YIPF6LZE4THumanEsophagusESCC1.87e-154.81e-010.0811
286451YIPF6LZE7THumanEsophagusESCC2.80e-096.48e-010.0667
286451YIPF6LZE8THumanEsophagusESCC3.53e-072.20e-010.067
286451YIPF6LZE20THumanEsophagusESCC1.55e-072.92e-010.0662
286451YIPF6LZE22THumanEsophagusESCC1.38e-033.39e-010.068
286451YIPF6LZE24THumanEsophagusESCC4.17e-338.62e-010.0596
286451YIPF6LZE6THumanEsophagusESCC3.08e-043.11e-010.0845
286451YIPF6P1T-EHumanEsophagusESCC7.84e-044.58e-010.0875
286451YIPF6P2T-EHumanEsophagusESCC3.44e-234.92e-010.1177
286451YIPF6P4T-EHumanEsophagusESCC5.59e-367.80e-010.1323
286451YIPF6P5T-EHumanEsophagusESCC1.78e-204.45e-010.1327
286451YIPF6P8T-EHumanEsophagusESCC3.07e-468.40e-010.0889
286451YIPF6P9T-EHumanEsophagusESCC7.69e-173.31e-010.1131
286451YIPF6P10T-EHumanEsophagusESCC2.17e-223.50e-010.116
286451YIPF6P11T-EHumanEsophagusESCC1.24e-165.47e-010.1426
286451YIPF6P12T-EHumanEsophagusESCC1.10e-458.22e-010.1122
286451YIPF6P15T-EHumanEsophagusESCC1.69e-468.77e-010.1149
286451YIPF6P16T-EHumanEsophagusESCC3.64e-417.81e-010.1153
286451YIPF6P17T-EHumanEsophagusESCC2.76e-042.32e-010.1278
286451YIPF6P19T-EHumanEsophagusESCC2.37e-084.97e-010.1662
Page: 1 2 3 4 5 6 

check button Transcriptomic changes along malignancy continuum.
TissueExpression DynamicsAbbreviation
EsophagusThe image shows the transcriptomic changes along malignancy continuum.log2FC in expression of this searched gene in stem-like cells from each diseased tissue sample relative to stem-like cells in normal samples in each tissue plotted against the malignancy continuum. Samples are colored based on if they are from different disease stage.
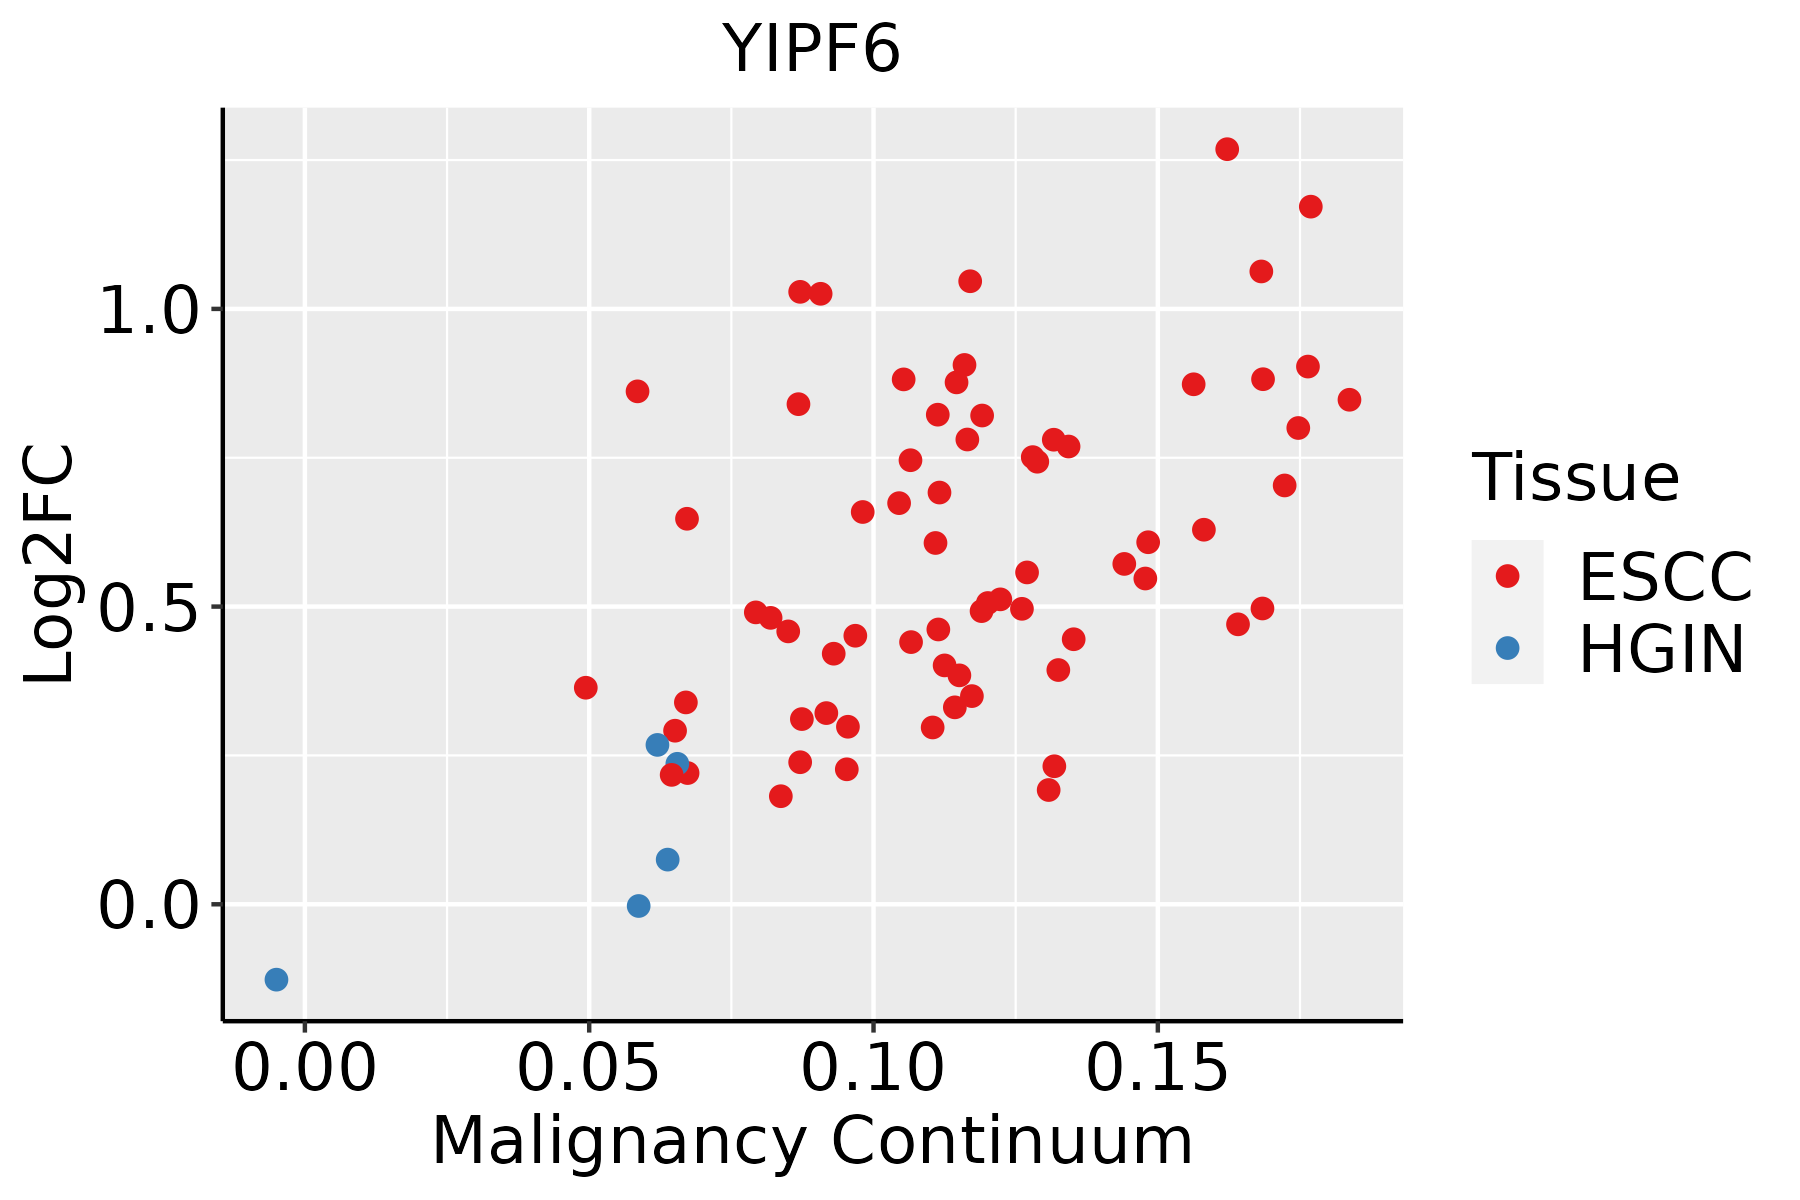
ESCC: Esophageal squamous cell carcinoma
HGIN: High-grade intraepithelial neoplasias
LGIN: Low-grade intraepithelial neoplasias
LiverThe image shows the transcriptomic changes along malignancy continuum.log2FC in expression of this searched gene in stem-like cells from each diseased tissue sample relative to stem-like cells in normal samples in each tissue plotted against the malignancy continuum. Samples are colored based on if they are from different disease stage.HCC: Hepatocellular carcinoma
NAFLD: Non-alcoholic fatty liver disease
Oral CavityThe image shows the transcriptomic changes along malignancy continuum.log2FC in expression of this searched gene in stem-like cells from each diseased tissue sample relative to stem-like cells in normal samples in each tissue plotted against the malignancy continuum. Samples are colored based on if they are from different disease stage.EOLP: Erosive Oral lichen planus
LP: leukoplakia
NEOLP: Non-erosive oral lichen planus
OSCC: Oral squamous cell carcinoma
ProstateThe image shows the transcriptomic changes along malignancy continuum.log2FC in expression of this searched gene in stem-like cells from each diseased tissue sample relative to stem-like cells in normal samples in each tissue plotted against the malignancy continuum. Samples are colored based on if they are from different disease stage.
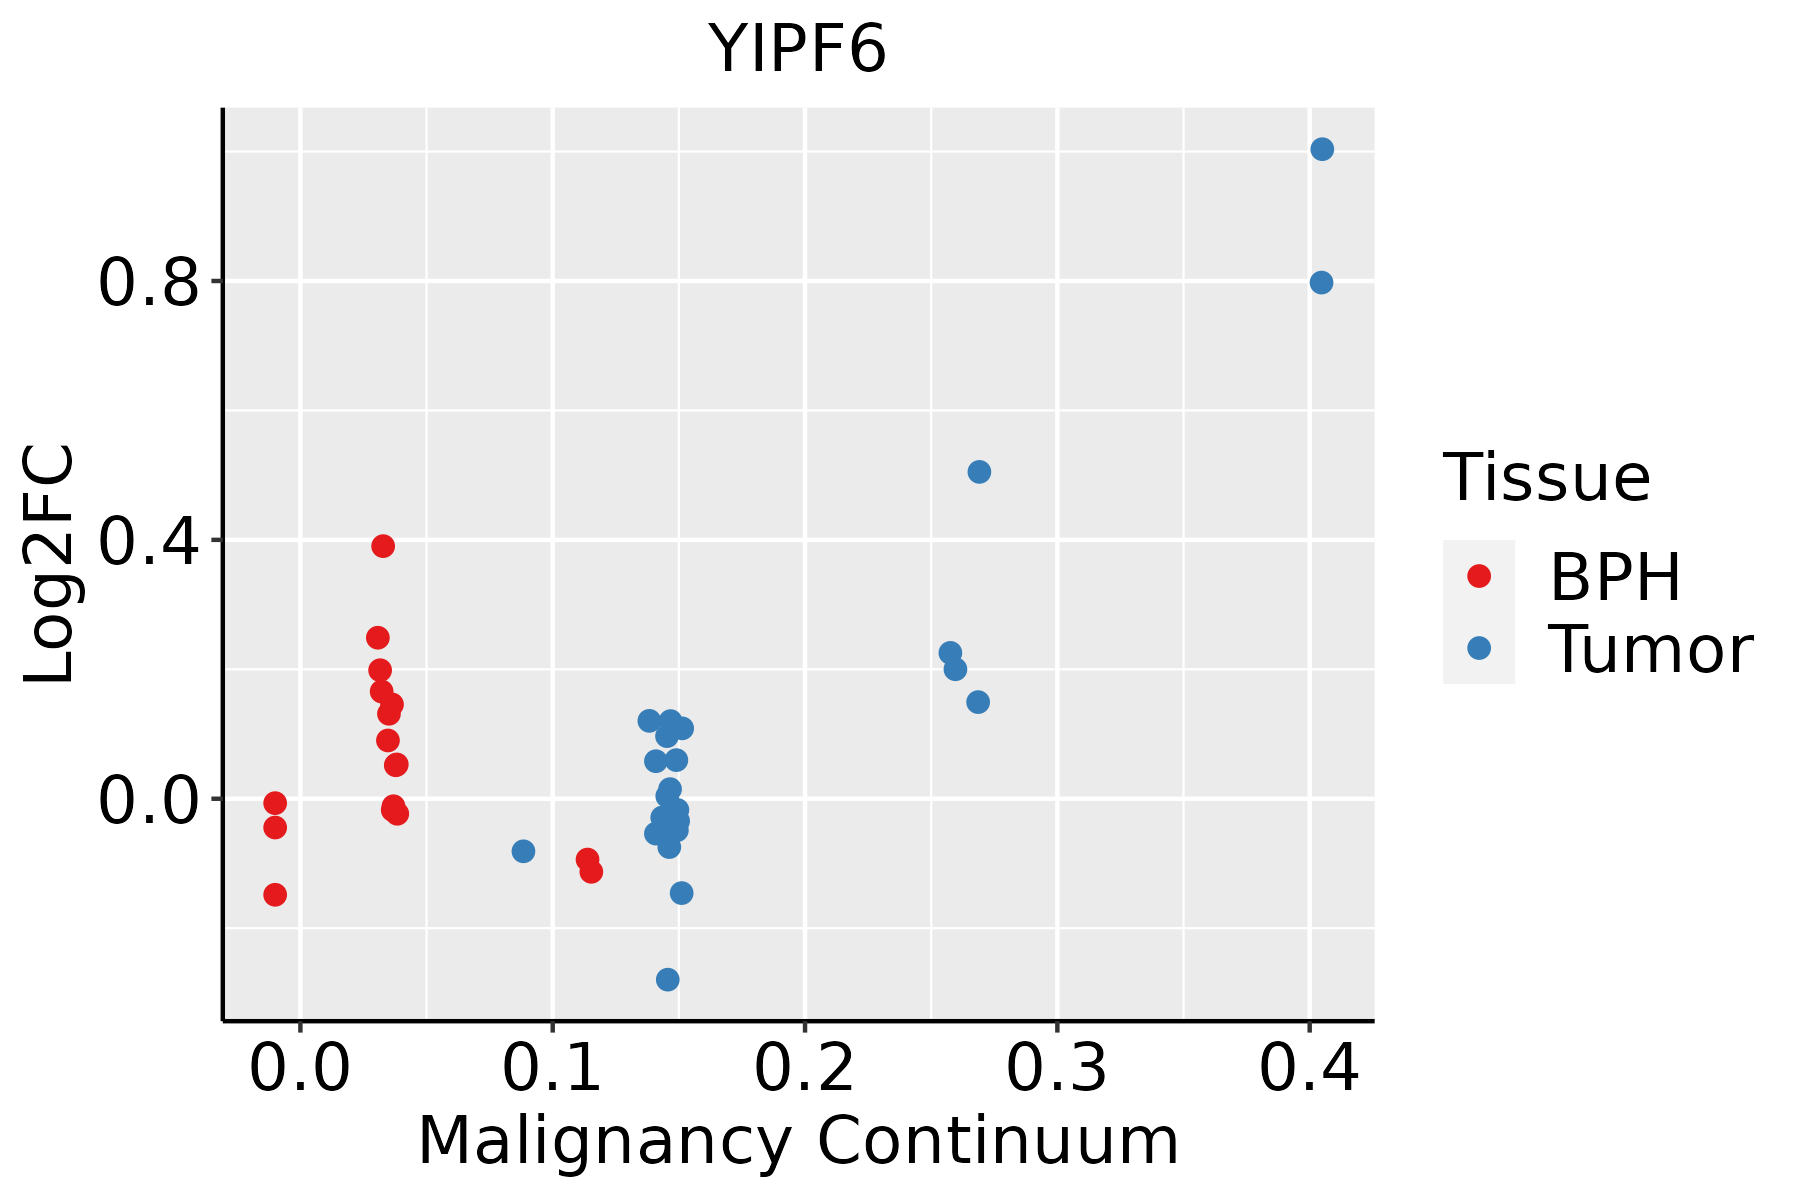
BPH: Benign Prostatic Hyperplasia
ThyroidThe image shows the transcriptomic changes along malignancy continuum.log2FC in expression of this searched gene in stem-like cells from each diseased tissue sample relative to stem-like cells in normal samples in each tissue plotted against the malignancy continuum. Samples are colored based on if they are from different disease stage.
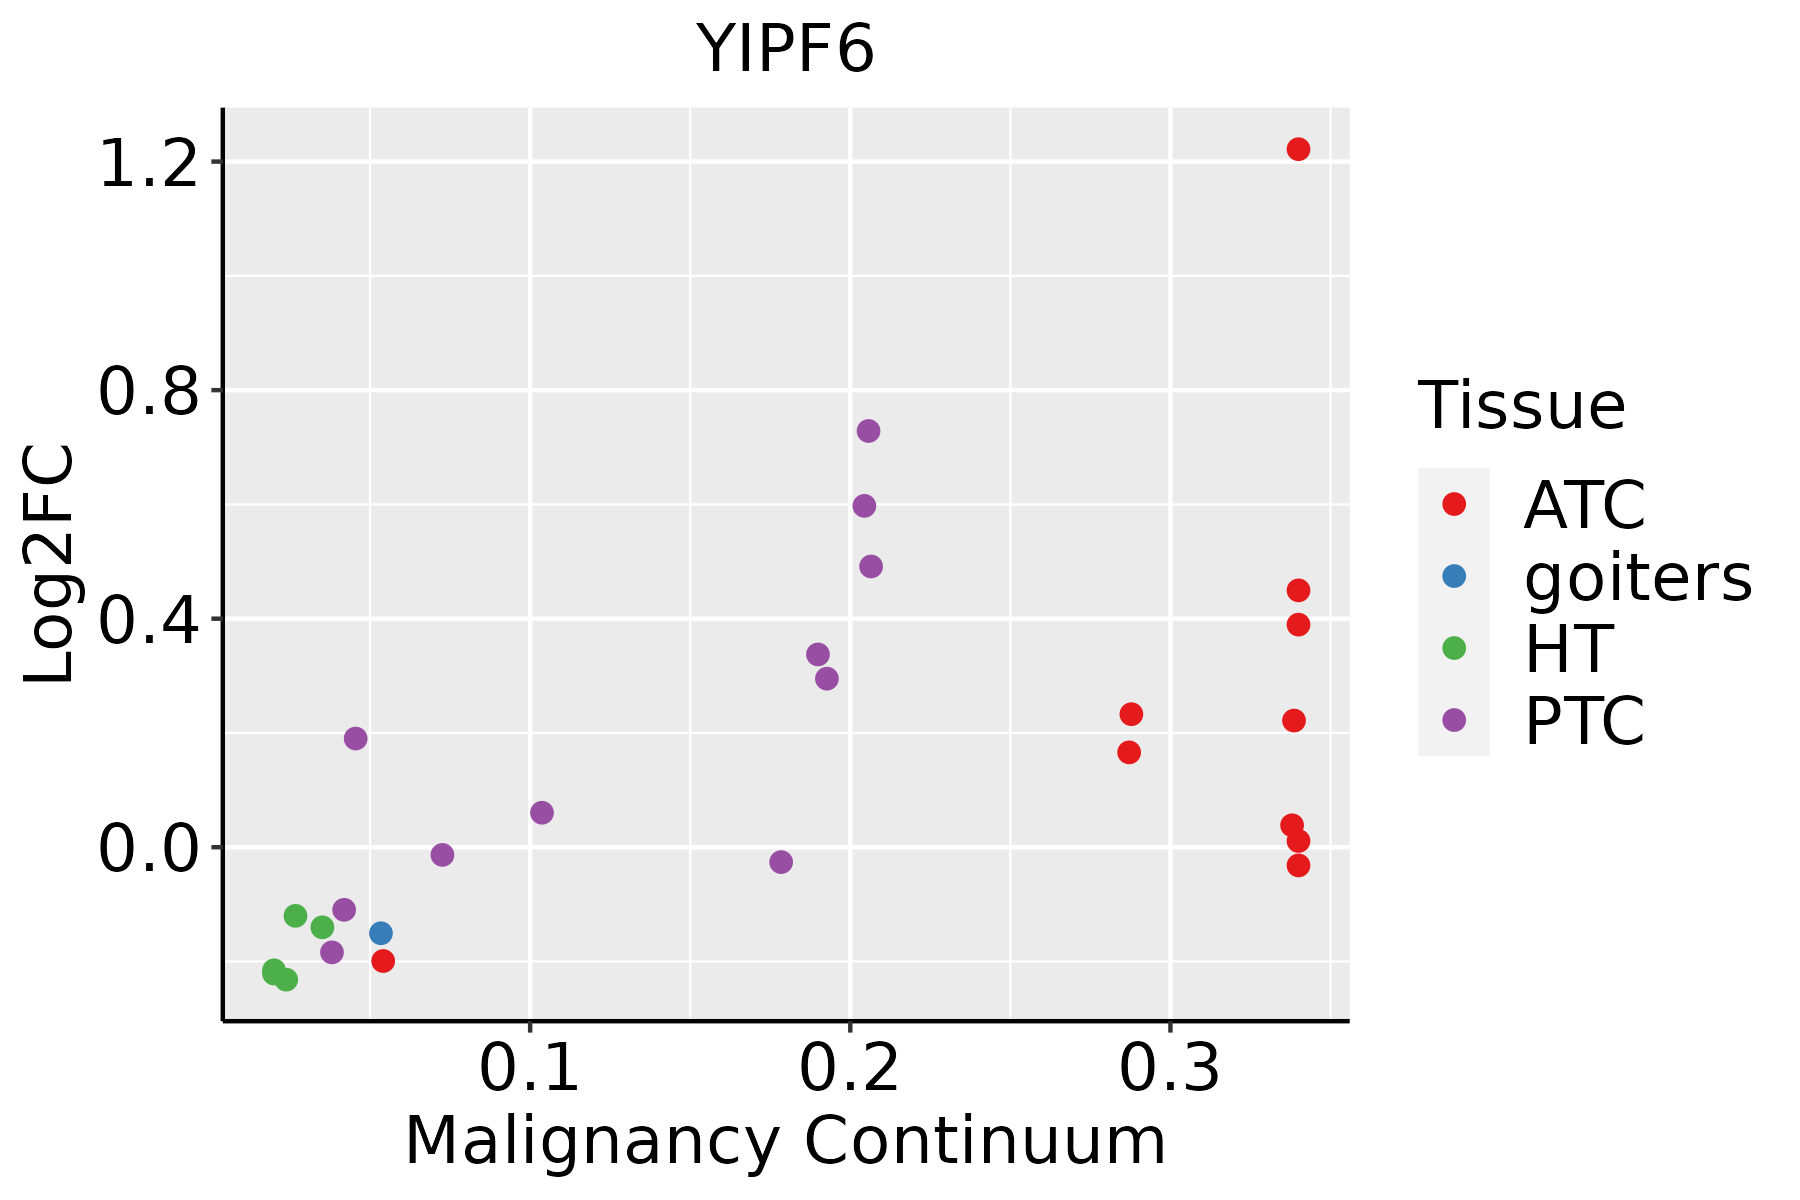
ATC: Anaplastic thyroid cancer
HT: Hashimoto's thyroiditis
PTC: Papillary thyroid cancer
∗log2FC in expression of this searched gene in stem-like cells from each diseased tissue sample relative to stem-like cells in normal samples in each tissue plotted against the malignancy continuum. Samples are colored based on if they are from different disease stage.

Top

Malignant transformation related pathway analysis

check buttonFind out the enriched GO biological processes and KEGG pathways involved in transition from healthy to precancer to cancer
check button Figure of enriched GO biological processes.
TissueDisease StageEnriched GO biological Processes
ColorectumADGO analysis - Figure of enriched GO biological processes: Top 15 enriched GO BP terms are showed in the bar plot of each disease state in each tissue. Each row represents a significant GO biological process which is colored according to the -log10(p.adjust).
ColorectumSERGO analysis - Figure of enriched GO biological processes: Top 15 enriched GO BP terms are showed in the bar plot of each disease state in each tissue. Each row represents a significant GO biological process which is colored according to the -log10(p.adjust).
ColorectumMSSGO analysis - Figure of enriched GO biological processes: Top 15 enriched GO BP terms are showed in the bar plot of each disease state in each tissue. Each row represents a significant GO biological process which is colored according to the -log10(p.adjust).
ColorectumMSI-HGO analysis - Figure of enriched GO biological processes: Top 15 enriched GO BP terms are showed in the bar plot of each disease state in each tissue. Each row represents a significant GO biological process which is colored according to the -log10(p.adjust).
ColorectumFAPGO analysis - Figure of enriched GO biological processes: Top 15 enriched GO BP terms are showed in the bar plot of each disease state in each tissue. Each row represents a significant GO biological process which is colored according to the -log10(p.adjust).
∗Top 15 enriched GO BP terms are showed in the bar plot of each disease state in each tissue. Each row represents a significant GO biological process which is colored according to the -log10(p.adjust).
Page: 1 2 3 4 5 6 7 8 9 

check button Enriched GO biological processes.
GO IDTissueDisease StageDescriptionGene RatioBg Ratiopvaluep.adjustCount
GO:000206420EsophagusESCCepithelial cell development136/8552220/187239.50e-071.21e-05136
GO:00605763EsophagusESCCintestinal epithelial cell development12/855214/187232.51e-031.08e-0212
GO:0002066EsophagusESCCcolumnar/cuboidal epithelial cell development29/855244/187235.41e-032.02e-0229
GO:000206412LiverCirrhoticepithelial cell development80/4634220/187237.63e-058.44e-0480
GO:000206422LiverHCCepithelial cell development114/7958220/187233.19e-031.47e-02114
GO:000206419Oral cavityOSCCepithelial cell development116/7305220/187232.34e-052.21e-04116
GO:00605762Oral cavityOSCCintestinal epithelial cell development10/730514/187231.44e-024.69e-0210
GO:000206417ProstateBPHepithelial cell development85/3107220/187233.16e-154.55e-1385
GO:0060576ProstateBPHintestinal epithelial cell development8/310714/187236.63e-044.46e-038
GO:0060575ProstateBPHintestinal epithelial cell differentiation9/310723/187238.32e-033.60e-029
GO:000206418ProstateTumorepithelial cell development88/3246220/187231.30e-152.38e-1388
GO:00605761ProstateTumorintestinal epithelial cell development8/324614/187238.99e-045.96e-038
GO:00605751ProstateTumorintestinal epithelial cell differentiation9/324623/187231.11e-024.56e-029
GO:000206427ThyroidHTepithelial cell development35/1272220/187232.12e-067.61e-0535
GO:00605764ThyroidHTintestinal epithelial cell development6/127214/187231.82e-042.68e-036
GO:00605752ThyroidHTintestinal epithelial cell differentiation7/127223/187236.13e-047.07e-037
GO:00020651ThyroidHTcolumnar/cuboidal epithelial cell differentiation14/127291/187233.23e-032.55e-0214
GO:00020661ThyroidHTcolumnar/cuboidal epithelial cell development8/127244/187238.78e-034.95e-028
GO:0002064112ThyroidPTCepithelial cell development101/5968220/187238.53e-069.74e-05101
GO:000206428ThyroidATCepithelial cell development103/6293220/187233.06e-052.55e-04103
Page: 1 

check button Enriched KEGG pathways.
Pathway IDTissueDisease StageDescriptionGene RatioBg Ratiopvaluep.adjustqvalueCount
Page: 1 

Top

Cell-cell communication analysis

check buttonIdentification of potential cell-cell interactions between two cell types and their ligand-receptor pairs for different disease states
LigandReceptorLRpairPathwayTissueDisease Stage
Page: 1 

Top

Single-cell gene regulatory network inference analysis

check buttonFind out the significant the regulons (TFs) and the target genes of each regulon across cell types for different disease states
TFCell TypeTissueDisease StageTarget GeneRSSRegulon Activity
∗The dot plots of a searched regulon are shown for all cell subpopulations in each disease state of each tissue based on the regulon specific score inferred using pySCENIC and by calculating the average expression.
Page: 1 

Top

Somatic mutation of malignant transformation related genes

check buttonAnnotation of somatic variants for genes involved in malignant transformation
Hugo SymbolVariant ClassVariant ClassificationdbSNP RSHGVScHGVSpHGVSp ShortSWISSPROTBIOTYPESIFTPolyPhenTumor Sample BarcodeTissueHistologySexAgeStageTherapy TypesDrugsOutcome
YIPF6SNVMissense_Mutationnovelc.28N>Ap.Asp10Asnp.D10NQ96EC8protein_codingdeleterious_low_confidence(0.04)benign(0.027)TCGA-5L-AAT1-01Breastbreast invasive carcinomaFemale<65III/IVHormone TherapyletrozolSD
YIPF6SNVMissense_Mutationc.445N>Gp.Gln149Glup.Q149EQ96EC8protein_codingdeleterious(0)probably_damaging(0.997)TCGA-BH-A18P-01Breastbreast invasive carcinomaFemale<65I/IIUnknownUnknownPD
YIPF6SNVMissense_Mutationc.596N>Tp.Ser199Phep.S199FQ96EC8protein_codingdeleterious(0)probably_damaging(0.984)TCGA-DR-A0ZM-01Cervixcervical & endocervical cancerFemale<65III/IVUnspecificCisplatinSD
YIPF6SNVMissense_Mutationrs763487554c.176N>Ap.Arg59Hisp.R59HQ96EC8protein_codingtolerated(0.06)possibly_damaging(0.489)TCGA-AA-A01D-01Colorectumcolon adenocarcinomaFemale<65III/IVChemotherapycapecitabinePD
YIPF6SNVMissense_Mutationnovelc.312N>Tp.Met104Ilep.M104IQ96EC8protein_codingtolerated(0.36)benign(0.017)TCGA-AG-3726-01Colorectumrectum adenocarcinomaFemale<65I/IIUnknownUnknownSD
YIPF6SNVMissense_Mutationnovelc.100N>Ap.Val34Ilep.V34IQ96EC8protein_codingtolerated(0.26)benign(0.003)TCGA-A5-A0G2-01Endometriumuterine corpus endometrioid carcinomaFemale<65III/IVUnknownUnknownSD
YIPF6SNVMissense_Mutationnovelc.301N>Gp.Leu101Valp.L101VQ96EC8protein_codingtolerated(0.13)possibly_damaging(0.838)TCGA-A5-A0G2-01Endometriumuterine corpus endometrioid carcinomaFemale<65III/IVUnknownUnknownSD
YIPF6SNVMissense_Mutationnovelc.313C>Ap.Leu105Metp.L105MQ96EC8protein_codingdeleterious(0.01)probably_damaging(0.986)TCGA-A5-A1OF-01Endometriumuterine corpus endometrioid carcinomaFemale<65I/IIUnknownUnknownSD
YIPF6SNVMissense_Mutationnovelc.133N>Tp.Arg45Cysp.R45CQ96EC8protein_codingdeleterious(0.05)benign(0.145)TCGA-AJ-A3EL-01Endometriumuterine corpus endometrioid carcinomaFemale<65I/IIUnknownUnknownSD
YIPF6SNVMissense_Mutationc.289N>Ap.Leu97Ilep.L97IQ96EC8protein_codingtolerated(0.17)possibly_damaging(0.679)TCGA-AP-A0LM-01Endometriumuterine corpus endometrioid carcinomaFemale<65III/IVChemotherapycisplatinSD
Page: 1 2 3 4 

Top

Related drugs of malignant transformation related genes

check buttonIdentification of chemicals and drugs interact with genes involved in malignant transfromation
(DGIdb 4.0)
Entrez IDSymbolCategoryInteraction TypesDrug Claim NameDrug NamePMIDs
Page: 1