
|
|||||
|
 | |
| |
| |
| |
| |
| |
|
Gene: YIPF5 |
Gene summary for YIPF5 |
| Gene information | Species | Human | Gene symbol | YIPF5 | Gene ID | 81555 |
| Gene name | Yip1 domain family member 5 | |
| Gene Alias | FinGER5 | |
| Cytomap | 5q31.3 | |
| Gene Type | protein-coding | GO ID | GO:0006810 | UniProtAcc | Q969M3 |
Top |
Malignant transformation analysis |
| Identification of the aberrant gene expression in precancerous and cancerous lesions by comparing the gene expression of stem-like cells in diseased tissues with normal stem cells |
| Entrez ID | Symbol | Replicates | Species | Organ | Tissue | Adj P-value | Log2FC | Malignancy |
| 81555 | YIPF5 | LZE4T | Human | Esophagus | ESCC | 2.50e-14 | 3.51e-01 | 0.0811 |
| 81555 | YIPF5 | LZE7T | Human | Esophagus | ESCC | 6.21e-05 | 3.14e-01 | 0.0667 |
| 81555 | YIPF5 | LZE8T | Human | Esophagus | ESCC | 1.46e-02 | 9.62e-02 | 0.067 |
| 81555 | YIPF5 | LZE20T | Human | Esophagus | ESCC | 1.61e-11 | 2.98e-01 | 0.0662 |
| 81555 | YIPF5 | LZE22T | Human | Esophagus | ESCC | 1.11e-04 | 4.60e-01 | 0.068 |
| 81555 | YIPF5 | LZE24T | Human | Esophagus | ESCC | 6.57e-28 | 6.90e-01 | 0.0596 |
| 81555 | YIPF5 | LZE6T | Human | Esophagus | ESCC | 2.41e-06 | 5.37e-01 | 0.0845 |
| 81555 | YIPF5 | P1T-E | Human | Esophagus | ESCC | 1.96e-05 | 3.93e-01 | 0.0875 |
| 81555 | YIPF5 | P2T-E | Human | Esophagus | ESCC | 2.72e-32 | 5.67e-01 | 0.1177 |
| 81555 | YIPF5 | P4T-E | Human | Esophagus | ESCC | 1.40e-24 | 5.25e-01 | 0.1323 |
| 81555 | YIPF5 | P5T-E | Human | Esophagus | ESCC | 1.75e-27 | 5.99e-01 | 0.1327 |
| 81555 | YIPF5 | P8T-E | Human | Esophagus | ESCC | 4.83e-17 | 3.89e-01 | 0.0889 |
| 81555 | YIPF5 | P9T-E | Human | Esophagus | ESCC | 4.84e-16 | 3.89e-01 | 0.1131 |
| 81555 | YIPF5 | P10T-E | Human | Esophagus | ESCC | 2.10e-31 | 5.15e-01 | 0.116 |
| 81555 | YIPF5 | P11T-E | Human | Esophagus | ESCC | 1.24e-26 | 1.26e+00 | 0.1426 |
| 81555 | YIPF5 | P12T-E | Human | Esophagus | ESCC | 7.40e-35 | 7.04e-01 | 0.1122 |
| 81555 | YIPF5 | P15T-E | Human | Esophagus | ESCC | 3.73e-19 | 4.48e-01 | 0.1149 |
| 81555 | YIPF5 | P16T-E | Human | Esophagus | ESCC | 1.02e-24 | 4.36e-01 | 0.1153 |
| 81555 | YIPF5 | P17T-E | Human | Esophagus | ESCC | 1.88e-11 | 3.35e-01 | 0.1278 |
| 81555 | YIPF5 | P19T-E | Human | Esophagus | ESCC | 1.63e-08 | 6.65e-01 | 0.1662 |
| Page: 1 2 3 4 5 6 7 |
| Tissue | Expression Dynamics | Abbreviation |
| Esophagus | 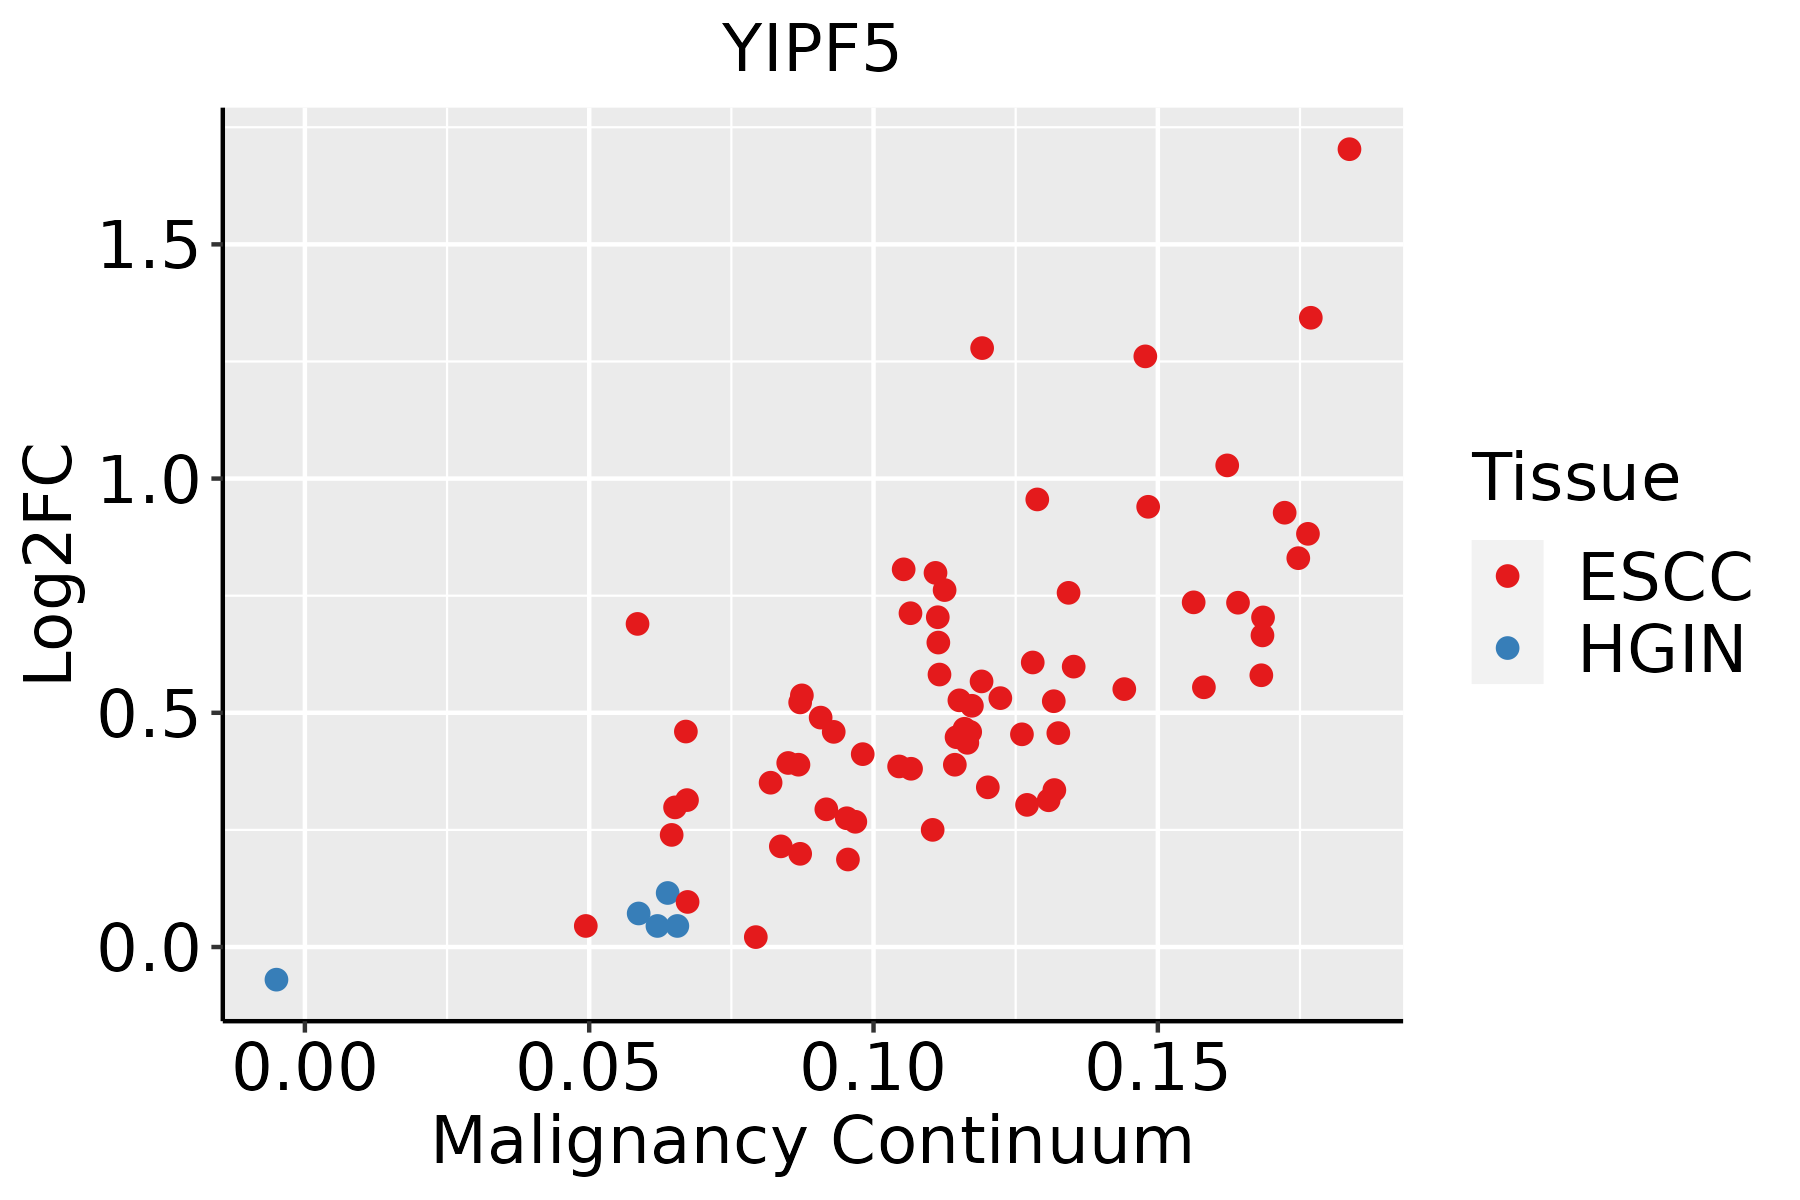 | ESCC: Esophageal squamous cell carcinoma |
| HGIN: High-grade intraepithelial neoplasias | ||
| LGIN: Low-grade intraepithelial neoplasias | ||
| Liver | 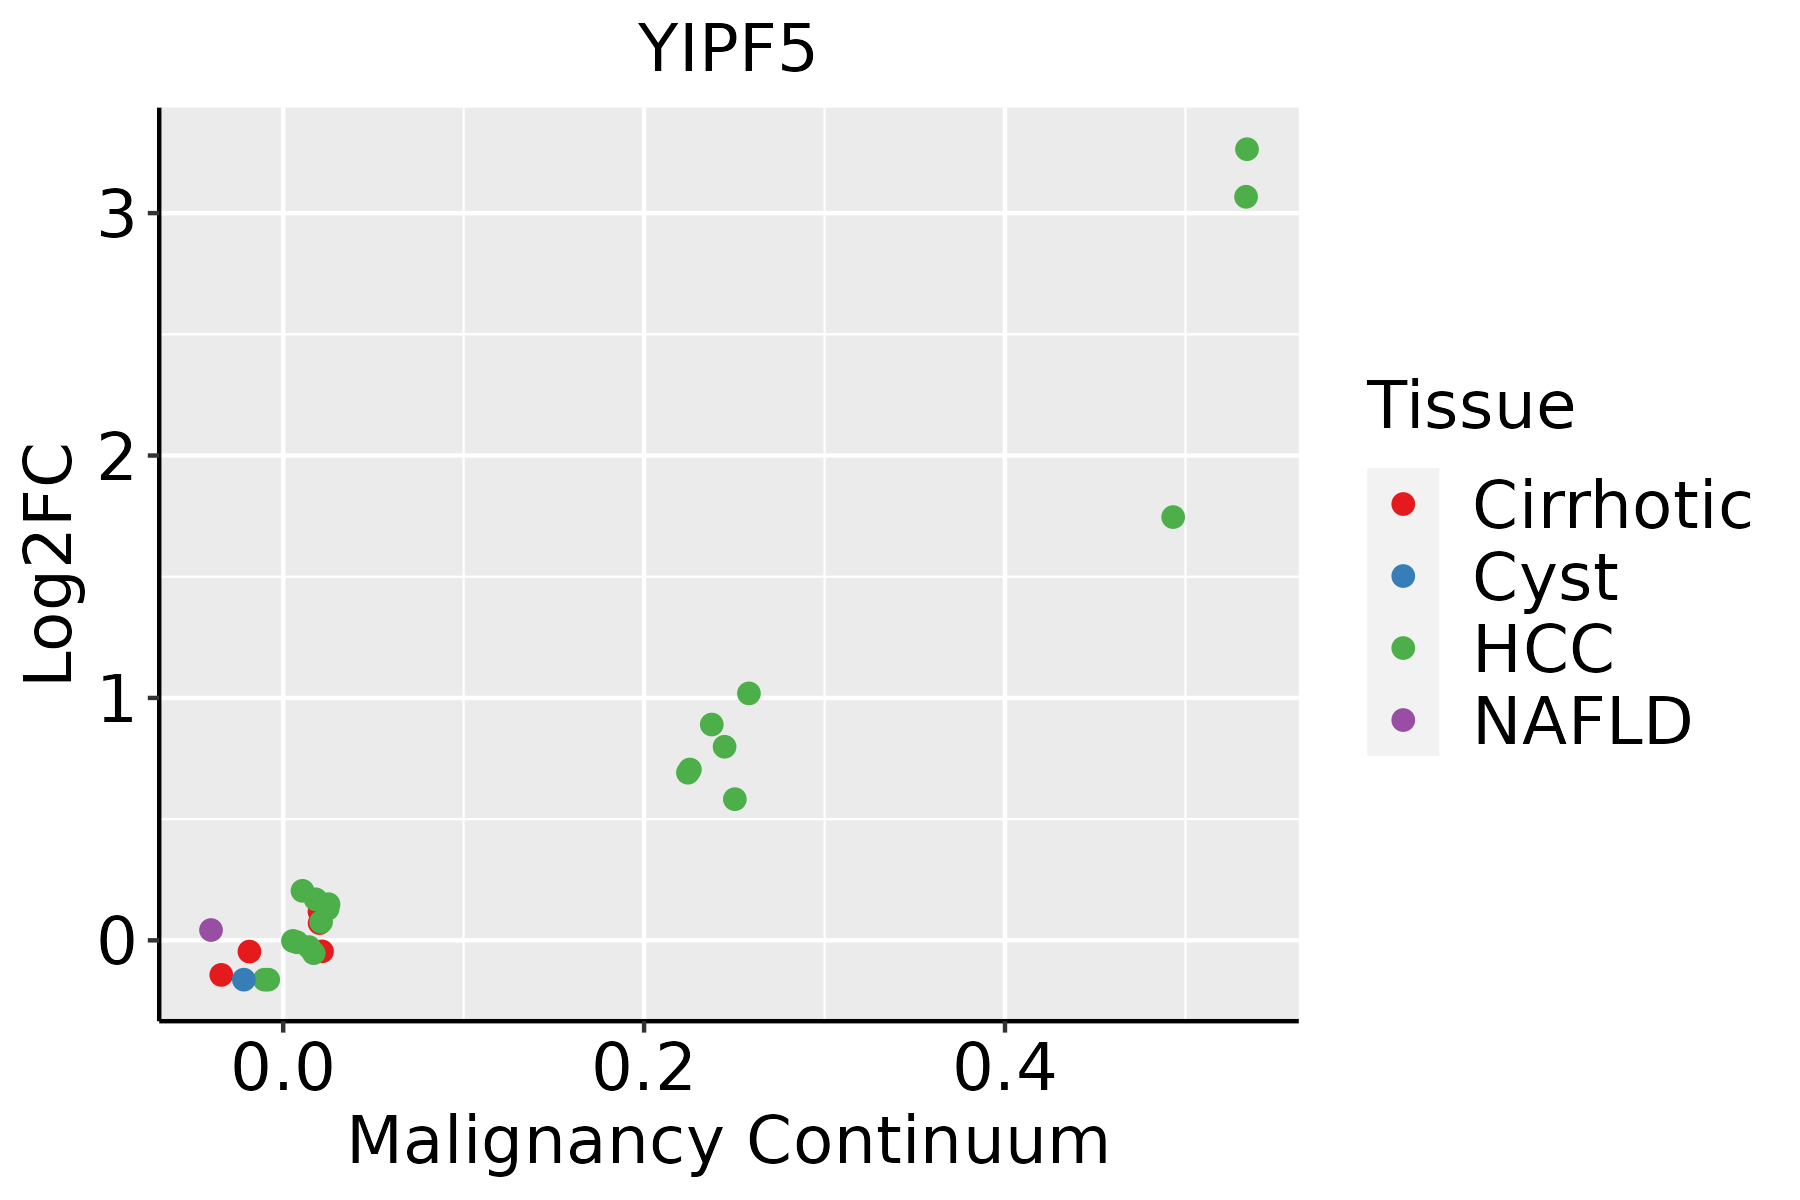 | HCC: Hepatocellular carcinoma |
| NAFLD: Non-alcoholic fatty liver disease | ||
| Oral Cavity | 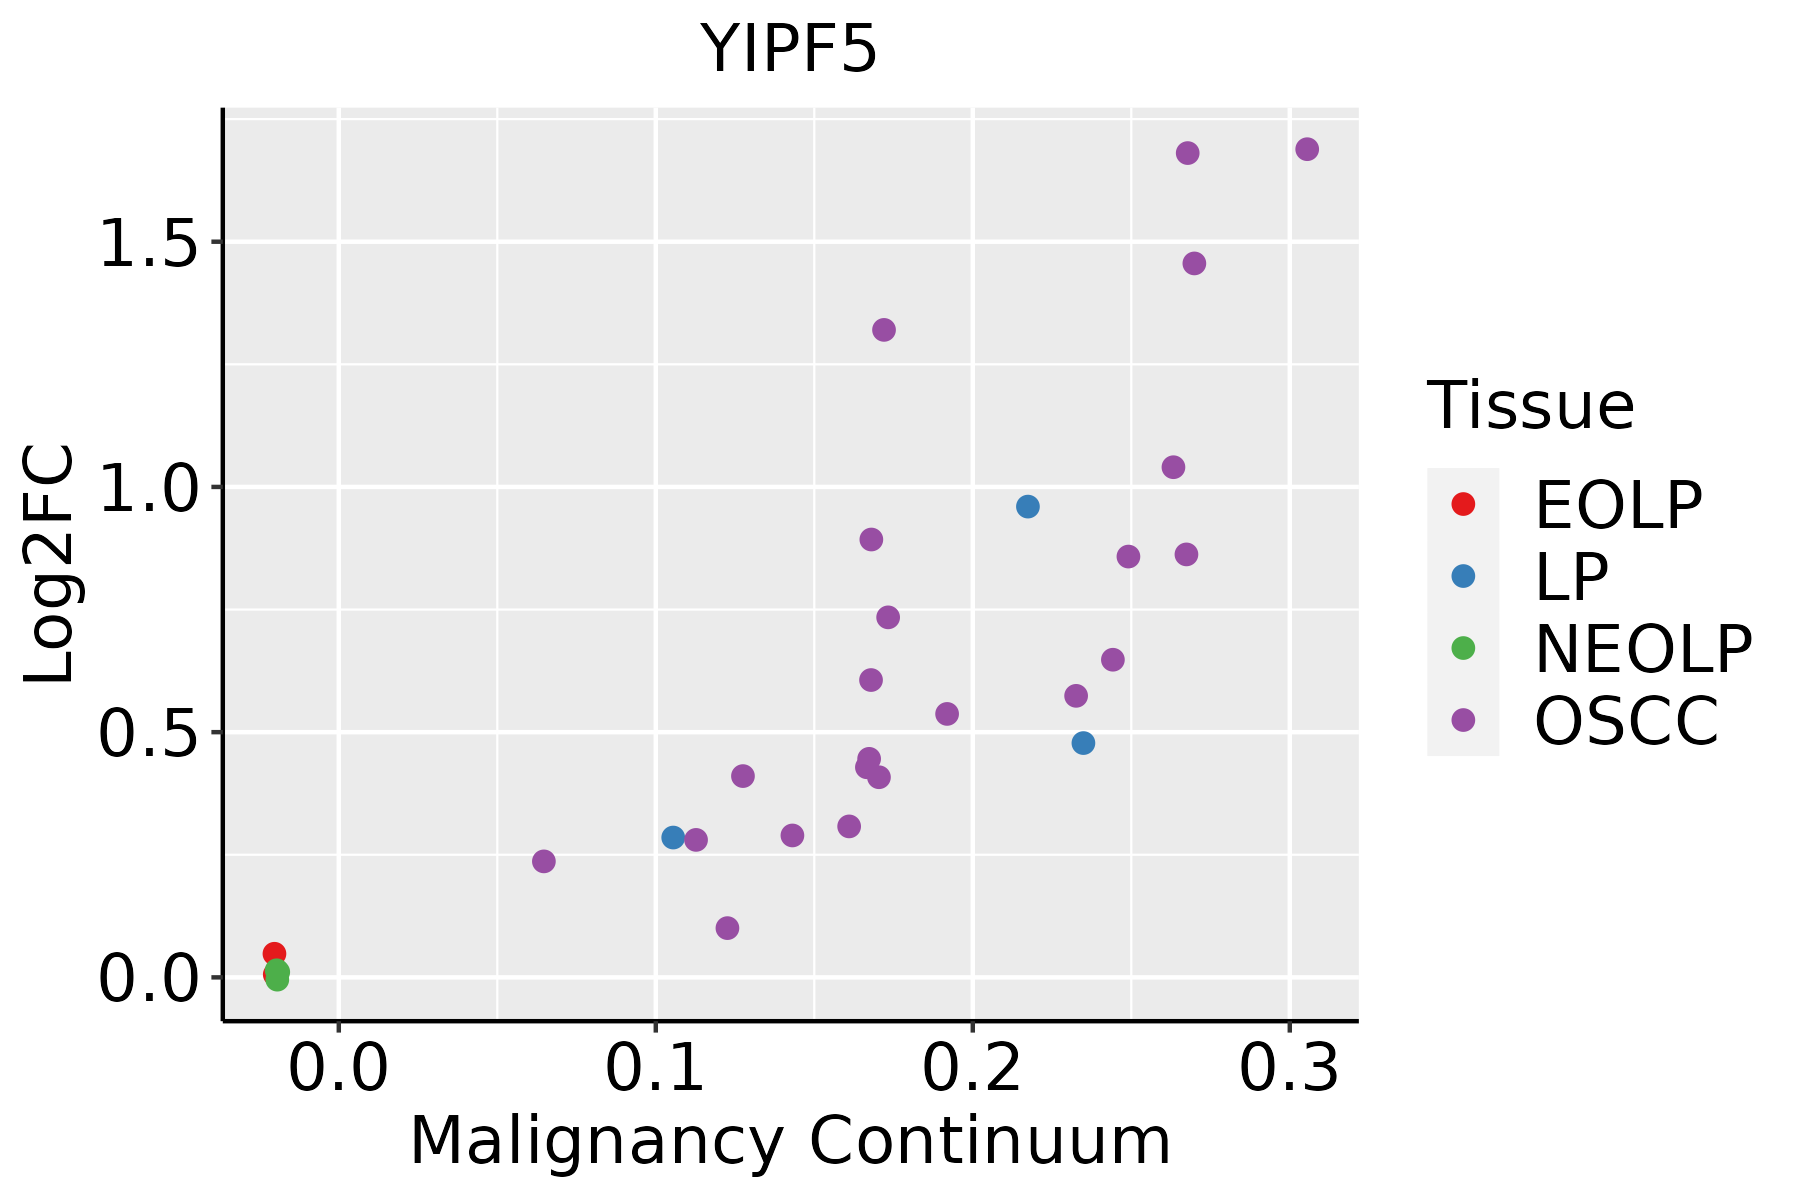 | EOLP: Erosive Oral lichen planus |
| LP: leukoplakia | ||
| NEOLP: Non-erosive oral lichen planus | ||
| OSCC: Oral squamous cell carcinoma | ||
| Skin |  | AK: Actinic keratosis |
| cSCC: Cutaneous squamous cell carcinoma | ||
| SCCIS:squamous cell carcinoma in situ | ||
| Thyroid | 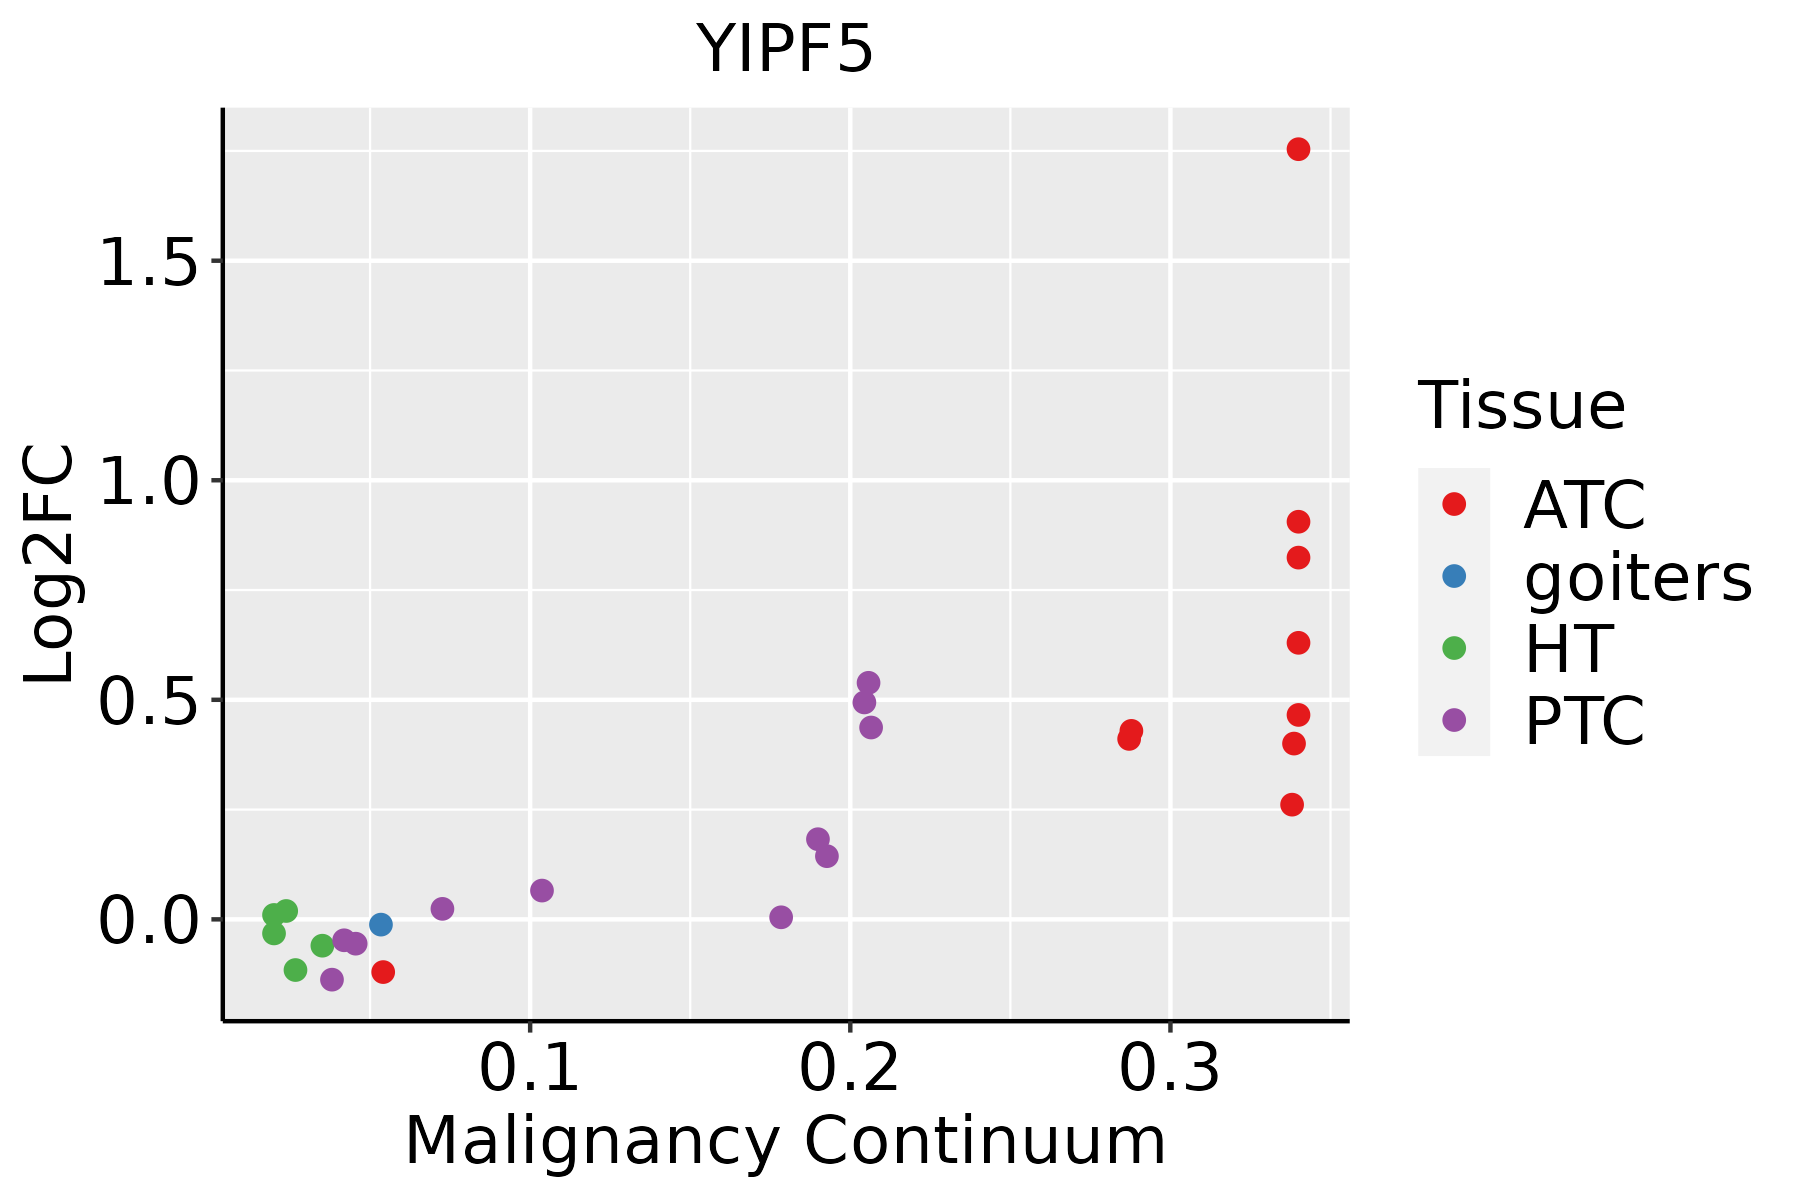 | ATC: Anaplastic thyroid cancer |
| HT: Hashimoto's thyroiditis | ||
| PTC: Papillary thyroid cancer |
| ∗log2FC in expression of this searched gene in stem-like cells from each diseased tissue sample relative to stem-like cells in normal samples in each tissue plotted against the malignancy continuum. Samples are colored based on if they are from different disease stage. |
Top |
Malignant transformation related pathway analysis |
| Find out the enriched GO biological processes and KEGG pathways involved in transition from healthy to precancer to cancer |
| Tissue | Disease Stage | Enriched GO biological Processes |
| Colorectum | AD |  |
| Colorectum | SER |  |
| Colorectum | MSS |  |
| Colorectum | MSI-H |  |
| Colorectum | FAP |  |
| ∗Top 15 enriched GO BP terms are showed in the bar plot of each disease state in each tissue. Each row represents a significant GO biological process which is colored according to the -log10(p.adjust). |
| Page: 1 2 3 4 5 6 7 8 9 |
| GO ID | Tissue | Disease Stage | Description | Gene Ratio | Bg Ratio | pvalue | p.adjust | Count |
| GO:004819318 | Esophagus | ESCC | Golgi vesicle transport | 231/8552 | 296/18723 | 1.82e-30 | 9.63e-28 | 231 |
| GO:003238618 | Esophagus | ESCC | regulation of intracellular transport | 243/8552 | 337/18723 | 3.20e-23 | 7.25e-21 | 243 |
| GO:001605014 | Esophagus | ESCC | vesicle organization | 211/8552 | 300/18723 | 2.85e-18 | 2.87e-16 | 211 |
| GO:000688815 | Esophagus | ESCC | endoplasmic reticulum to Golgi vesicle-mediated transport | 102/8552 | 130/18723 | 1.73e-14 | 9.22e-13 | 102 |
| GO:00482844 | Esophagus | ESCC | organelle fusion | 94/8552 | 141/18723 | 3.72e-07 | 5.16e-06 | 94 |
| GO:00070308 | Esophagus | ESCC | Golgi organization | 101/8552 | 157/18723 | 1.78e-06 | 2.10e-05 | 101 |
| GO:00901743 | Esophagus | ESCC | organelle membrane fusion | 73/8552 | 110/18723 | 9.29e-06 | 8.88e-05 | 73 |
| GO:00069063 | Esophagus | ESCC | vesicle fusion | 70/8552 | 106/18723 | 1.82e-05 | 1.60e-04 | 70 |
| GO:00610254 | Esophagus | ESCC | membrane fusion | 98/8552 | 163/18723 | 1.39e-04 | 9.41e-04 | 98 |
| GO:00482803 | Esophagus | ESCC | vesicle fusion with Golgi apparatus | 9/8552 | 10/18723 | 5.09e-03 | 1.92e-02 | 9 |
| GO:00606281 | Esophagus | ESCC | regulation of ER to Golgi vesicle-mediated transport | 12/8552 | 15/18723 | 7.31e-03 | 2.63e-02 | 12 |
| GO:004819311 | Liver | Cirrhotic | Golgi vesicle transport | 153/4634 | 296/18723 | 1.02e-23 | 6.43e-21 | 153 |
| GO:000688811 | Liver | Cirrhotic | endoplasmic reticulum to Golgi vesicle-mediated transport | 77/4634 | 130/18723 | 5.78e-17 | 7.56e-15 | 77 |
| GO:003238611 | Liver | Cirrhotic | regulation of intracellular transport | 147/4634 | 337/18723 | 1.84e-14 | 1.72e-12 | 147 |
| GO:001605011 | Liver | Cirrhotic | vesicle organization | 133/4634 | 300/18723 | 7.35e-14 | 6.41e-12 | 133 |
| GO:00070301 | Liver | Cirrhotic | Golgi organization | 68/4634 | 157/18723 | 2.57e-07 | 6.41e-06 | 68 |
| GO:0048280 | Liver | Cirrhotic | vesicle fusion with Golgi apparatus | 8/4634 | 10/18723 | 3.84e-04 | 3.19e-03 | 8 |
| GO:00482842 | Liver | Cirrhotic | organelle fusion | 52/4634 | 141/18723 | 8.77e-04 | 6.31e-03 | 52 |
| GO:0006906 | Liver | Cirrhotic | vesicle fusion | 40/4634 | 106/18723 | 2.01e-03 | 1.24e-02 | 40 |
| GO:0090174 | Liver | Cirrhotic | organelle membrane fusion | 40/4634 | 110/18723 | 4.32e-03 | 2.29e-02 | 40 |
| Page: 1 2 3 4 |
| Pathway ID | Tissue | Disease Stage | Description | Gene Ratio | Bg Ratio | pvalue | p.adjust | qvalue | Count |
| Page: 1 |
Top |
Cell-cell communication analysis |
| Identification of potential cell-cell interactions between two cell types and their ligand-receptor pairs for different disease states |
| Ligand | Receptor | LRpair | Pathway | Tissue | Disease Stage |
| Page: 1 |
Top |
Single-cell gene regulatory network inference analysis |
| Find out the significant the regulons (TFs) and the target genes of each regulon across cell types for different disease states |
| TF | Cell Type | Tissue | Disease Stage | Target Gene | RSS | Regulon Activity |
| ∗The dot plots of a searched regulon are shown for all cell subpopulations in each disease state of each tissue based on the regulon specific score inferred using pySCENIC and by calculating the average expression. |
| Page: 1 |
Top |
Somatic mutation of malignant transformation related genes |
| Annotation of somatic variants for genes involved in malignant transformation |
| Hugo Symbol | Variant Class | Variant Classification | dbSNP RS | HGVSc | HGVSp | HGVSp Short | SWISSPROT | BIOTYPE | SIFT | PolyPhen | Tumor Sample Barcode | Tissue | Histology | Sex | Age | Stage | Therapy Types | Drugs | Outcome |
| YIPF5 | insertion | Frame_Shift_Ins | novel | c.319dupA | p.Thr107AsnfsTer18 | p.T107Nfs*18 | Q969M3 | protein_coding | TCGA-EK-A2H0-01 | Cervix | cervical & endocervical cancer | Female | <65 | I/II | Chemotherapy | cisplatin | CR | ||
| YIPF5 | insertion | Frame_Shift_Ins | novel | c.319_320insA | p.Thr107AsnfsTer18 | p.T107Nfs*18 | Q969M3 | protein_coding | TCGA-ZJ-A8QQ-01 | Cervix | cervical & endocervical cancer | Female | <65 | I/II | Chemotherapy | cisplatin | SD | ||
| YIPF5 | SNV | Missense_Mutation | c.319N>G | p.Thr107Ala | p.T107A | Q969M3 | protein_coding | deleterious(0) | possibly_damaging(0.579) | TCGA-A6-6780-01 | Colorectum | colon adenocarcinoma | Male | >=65 | I/II | Unknown | Unknown | SD | |
| YIPF5 | SNV | Missense_Mutation | c.386G>A | p.Gly129Asp | p.G129D | Q969M3 | protein_coding | deleterious(0) | probably_damaging(1) | TCGA-AA-3864-01 | Colorectum | colon adenocarcinoma | Male | >=65 | I/II | Unknown | Unknown | SD | |
| YIPF5 | SNV | Missense_Mutation | rs765875592 | c.134N>T | p.Ser45Leu | p.S45L | Q969M3 | protein_coding | tolerated(0.42) | benign(0.031) | TCGA-AA-3984-01 | Colorectum | colon adenocarcinoma | Female | <65 | I/II | Unknown | Unknown | SD |
| YIPF5 | SNV | Missense_Mutation | novel | c.4N>C | p.Ser2Pro | p.S2P | Q969M3 | protein_coding | deleterious_low_confidence(0.01) | probably_damaging(0.969) | TCGA-A5-A0G2-01 | Endometrium | uterine corpus endometrioid carcinoma | Female | <65 | III/IV | Unknown | Unknown | SD |
| YIPF5 | SNV | Missense_Mutation | novel | c.285G>C | p.Glu95Asp | p.E95D | Q969M3 | protein_coding | tolerated(0.06) | possibly_damaging(0.788) | TCGA-AP-A0LM-01 | Endometrium | uterine corpus endometrioid carcinoma | Female | <65 | III/IV | Chemotherapy | cisplatin | SD |
| YIPF5 | SNV | Missense_Mutation | c.764N>T | p.Ser255Phe | p.S255F | Q969M3 | protein_coding | deleterious(0) | possibly_damaging(0.629) | TCGA-AP-A1DV-01 | Endometrium | uterine corpus endometrioid carcinoma | Female | <65 | I/II | Unknown | Unknown | SD | |
| YIPF5 | SNV | Missense_Mutation | c.149N>G | p.Phe50Cys | p.F50C | Q969M3 | protein_coding | tolerated(0.05) | benign(0.379) | TCGA-B5-A11E-01 | Endometrium | uterine corpus endometrioid carcinoma | Female | <65 | I/II | Unknown | Unknown | SD | |
| YIPF5 | SNV | Missense_Mutation | novel | c.115T>C | p.Tyr39His | p.Y39H | Q969M3 | protein_coding | tolerated(0.53) | benign(0.192) | TCGA-B5-A3FA-01 | Endometrium | uterine corpus endometrioid carcinoma | Female | >=65 | I/II | Unknown | Unknown | SD |
| Page: 1 2 3 |
Top |
Related drugs of malignant transformation related genes |
| Identification of chemicals and drugs interact with genes involved in malignant transfromation |
| (DGIdb 4.0) |
| Entrez ID | Symbol | Category | Interaction Types | Drug Claim Name | Drug Name | PMIDs |
| Page: 1 |

Copyright 2023-Present -The University of Texas Health Science Center at Houston |