
|
|||||
|
 | |
| |
| |
| |
| |
| |
|
Gene: YIPF4 |
Gene summary for YIPF4 |
| Gene information | Species | Human | Gene symbol | YIPF4 | Gene ID | 84272 |
| Gene name | Yip1 domain family member 4 | |
| Gene Alias | FinGER4 | |
| Cytomap | 2p22.3 | |
| Gene Type | protein-coding | GO ID | GO:0006810 | UniProtAcc | Q9BSR8 |
Top |
Malignant transformation analysis |
| Identification of the aberrant gene expression in precancerous and cancerous lesions by comparing the gene expression of stem-like cells in diseased tissues with normal stem cells |
| Entrez ID | Symbol | Replicates | Species | Organ | Tissue | Adj P-value | Log2FC | Malignancy |
| 84272 | YIPF4 | HTA11_1938_2000001011 | Human | Colorectum | AD | 8.89e-07 | 5.61e-01 | -0.0811 |
| 84272 | YIPF4 | HTA11_347_2000001011 | Human | Colorectum | AD | 4.40e-13 | 6.66e-01 | -0.1954 |
| 84272 | YIPF4 | HTA11_411_2000001011 | Human | Colorectum | SER | 2.09e-02 | 6.81e-01 | -0.2602 |
| 84272 | YIPF4 | HTA11_99999965104_69814 | Human | Colorectum | MSS | 2.30e-10 | 7.10e-01 | 0.281 |
| 84272 | YIPF4 | HTA11_99999971662_82457 | Human | Colorectum | MSS | 7.86e-05 | 4.16e-01 | 0.3859 |
| 84272 | YIPF4 | A015-C-203 | Human | Colorectum | FAP | 2.03e-09 | -1.91e-01 | -0.1294 |
| 84272 | YIPF4 | A002-C-201 | Human | Colorectum | FAP | 2.09e-04 | -1.60e-01 | 0.0324 |
| 84272 | YIPF4 | A001-C-108 | Human | Colorectum | FAP | 1.00e-03 | -3.05e-02 | -0.0272 |
| 84272 | YIPF4 | A002-C-205 | Human | Colorectum | FAP | 5.32e-06 | -1.12e-01 | -0.1236 |
| 84272 | YIPF4 | A015-C-006 | Human | Colorectum | FAP | 1.19e-03 | -1.68e-01 | -0.0994 |
| 84272 | YIPF4 | A002-C-114 | Human | Colorectum | FAP | 7.38e-06 | -2.01e-01 | -0.1561 |
| 84272 | YIPF4 | A015-C-104 | Human | Colorectum | FAP | 2.46e-07 | -1.93e-01 | -0.1899 |
| 84272 | YIPF4 | A001-C-014 | Human | Colorectum | FAP | 4.32e-02 | -8.06e-02 | 0.0135 |
| 84272 | YIPF4 | A002-C-016 | Human | Colorectum | FAP | 1.47e-08 | -2.14e-01 | 0.0521 |
| 84272 | YIPF4 | A002-C-116 | Human | Colorectum | FAP | 1.14e-10 | -1.23e-01 | -0.0452 |
| 84272 | YIPF4 | A014-C-008 | Human | Colorectum | FAP | 7.56e-05 | -2.23e-01 | -0.191 |
| 84272 | YIPF4 | A018-E-020 | Human | Colorectum | FAP | 7.11e-06 | -2.06e-01 | -0.2034 |
| 84272 | YIPF4 | F034 | Human | Colorectum | FAP | 7.08e-05 | -1.48e-01 | -0.0665 |
| 84272 | YIPF4 | LZE2T | Human | Esophagus | ESCC | 1.10e-02 | 9.22e-01 | 0.082 |
| 84272 | YIPF4 | LZE4T | Human | Esophagus | ESCC | 7.34e-25 | 8.95e-01 | 0.0811 |
| Page: 1 2 3 4 5 6 7 |
| Tissue | Expression Dynamics | Abbreviation |
| Colorectum (GSE201348) | 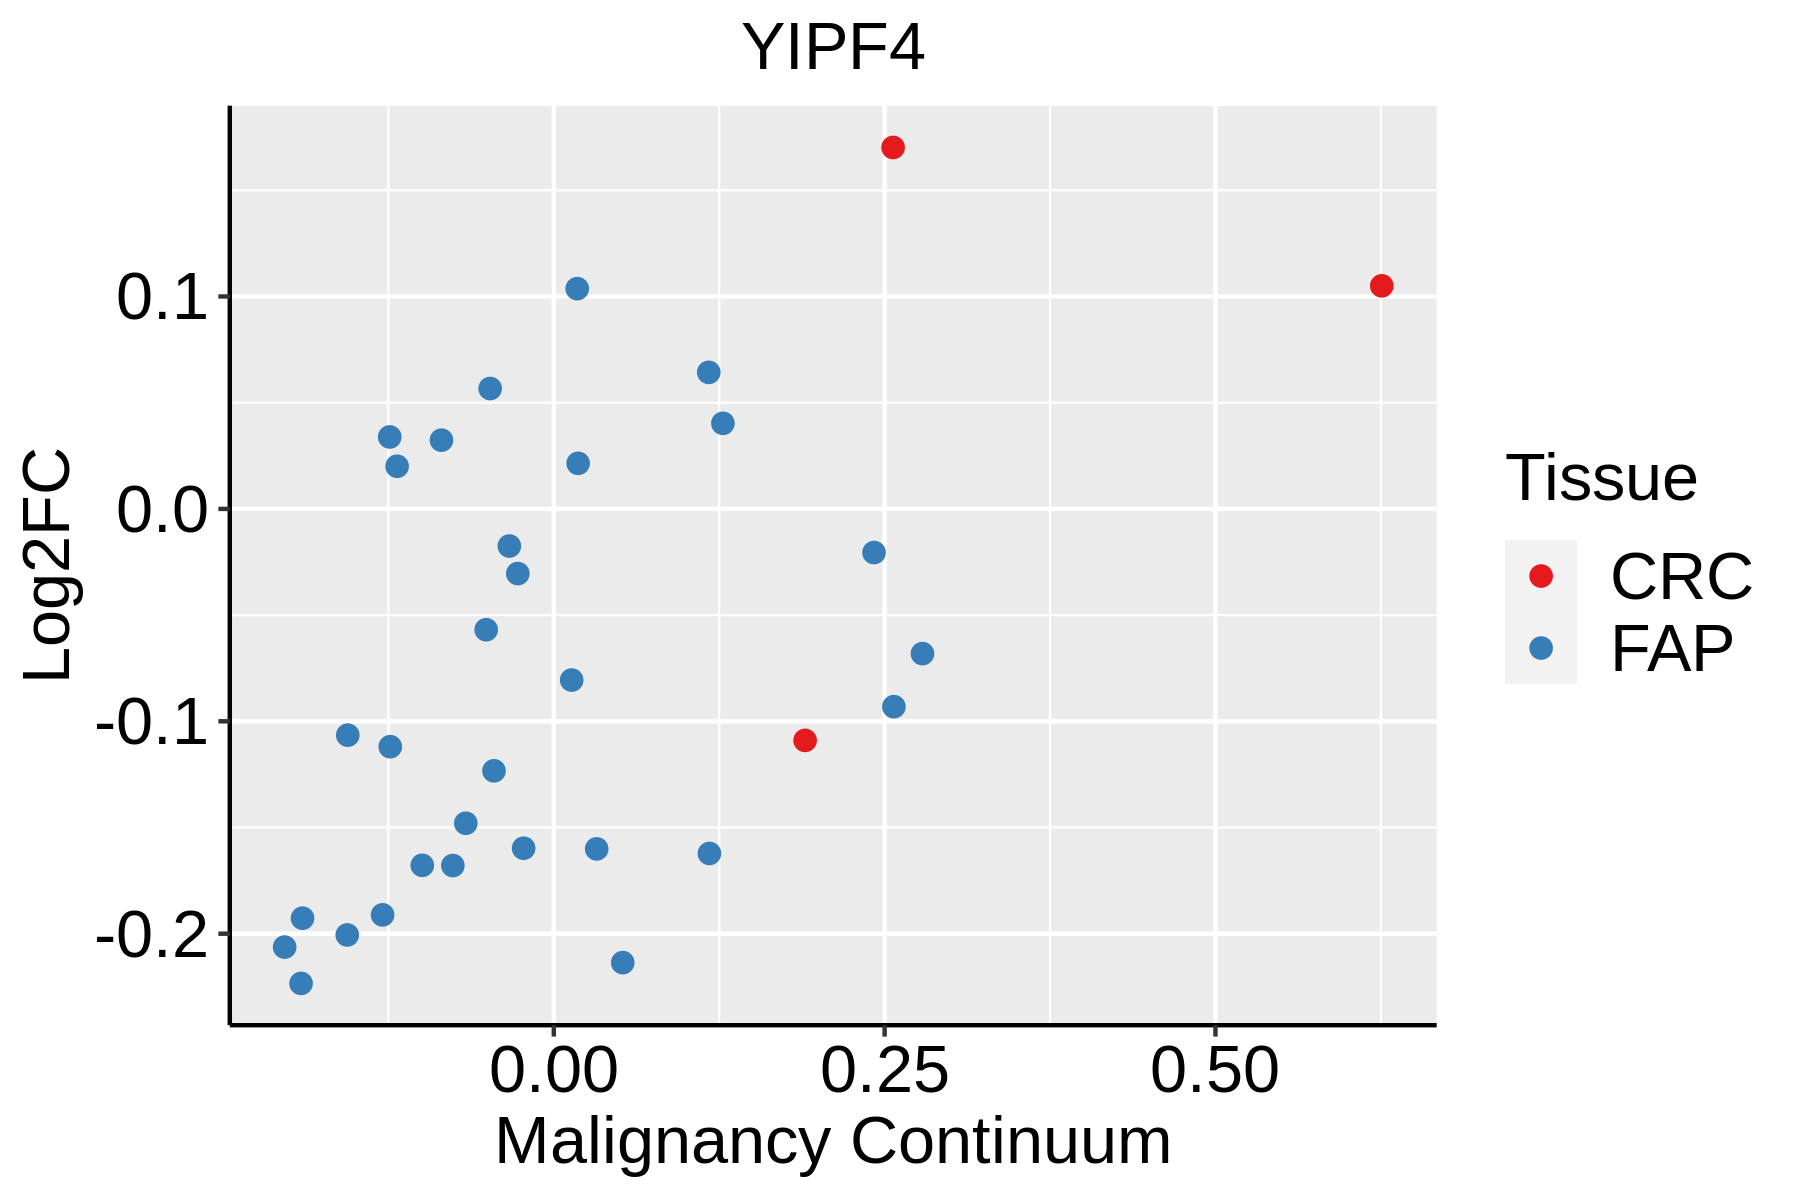 | FAP: Familial adenomatous polyposis |
| CRC: Colorectal cancer | ||
| Colorectum (HTA11) |  | AD: Adenomas |
| SER: Sessile serrated lesions | ||
| MSI-H: Microsatellite-high colorectal cancer | ||
| MSS: Microsatellite stable colorectal cancer | ||
| Esophagus |  | ESCC: Esophageal squamous cell carcinoma |
| HGIN: High-grade intraepithelial neoplasias | ||
| LGIN: Low-grade intraepithelial neoplasias | ||
| Liver |  | HCC: Hepatocellular carcinoma |
| NAFLD: Non-alcoholic fatty liver disease | ||
| Oral Cavity | 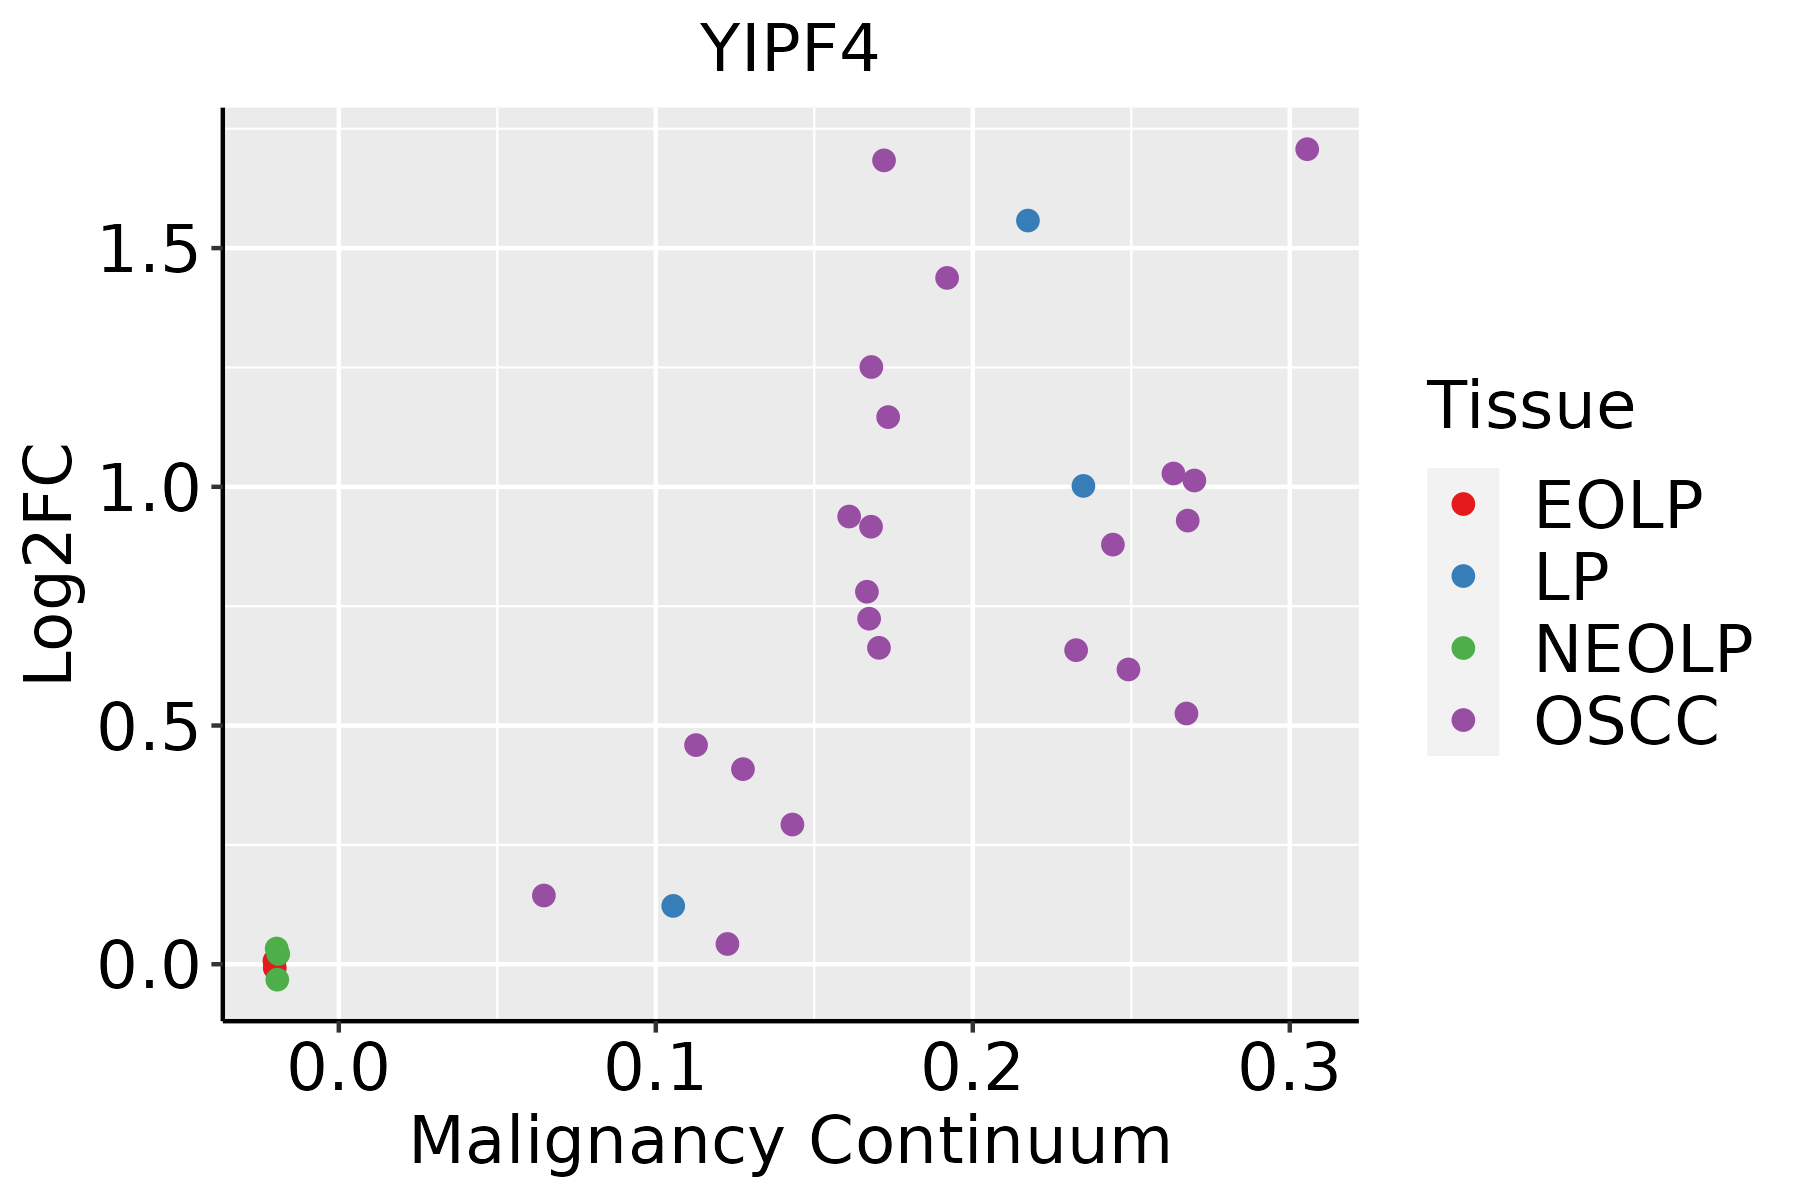 | EOLP: Erosive Oral lichen planus |
| LP: leukoplakia | ||
| NEOLP: Non-erosive oral lichen planus | ||
| OSCC: Oral squamous cell carcinoma | ||
| Skin | 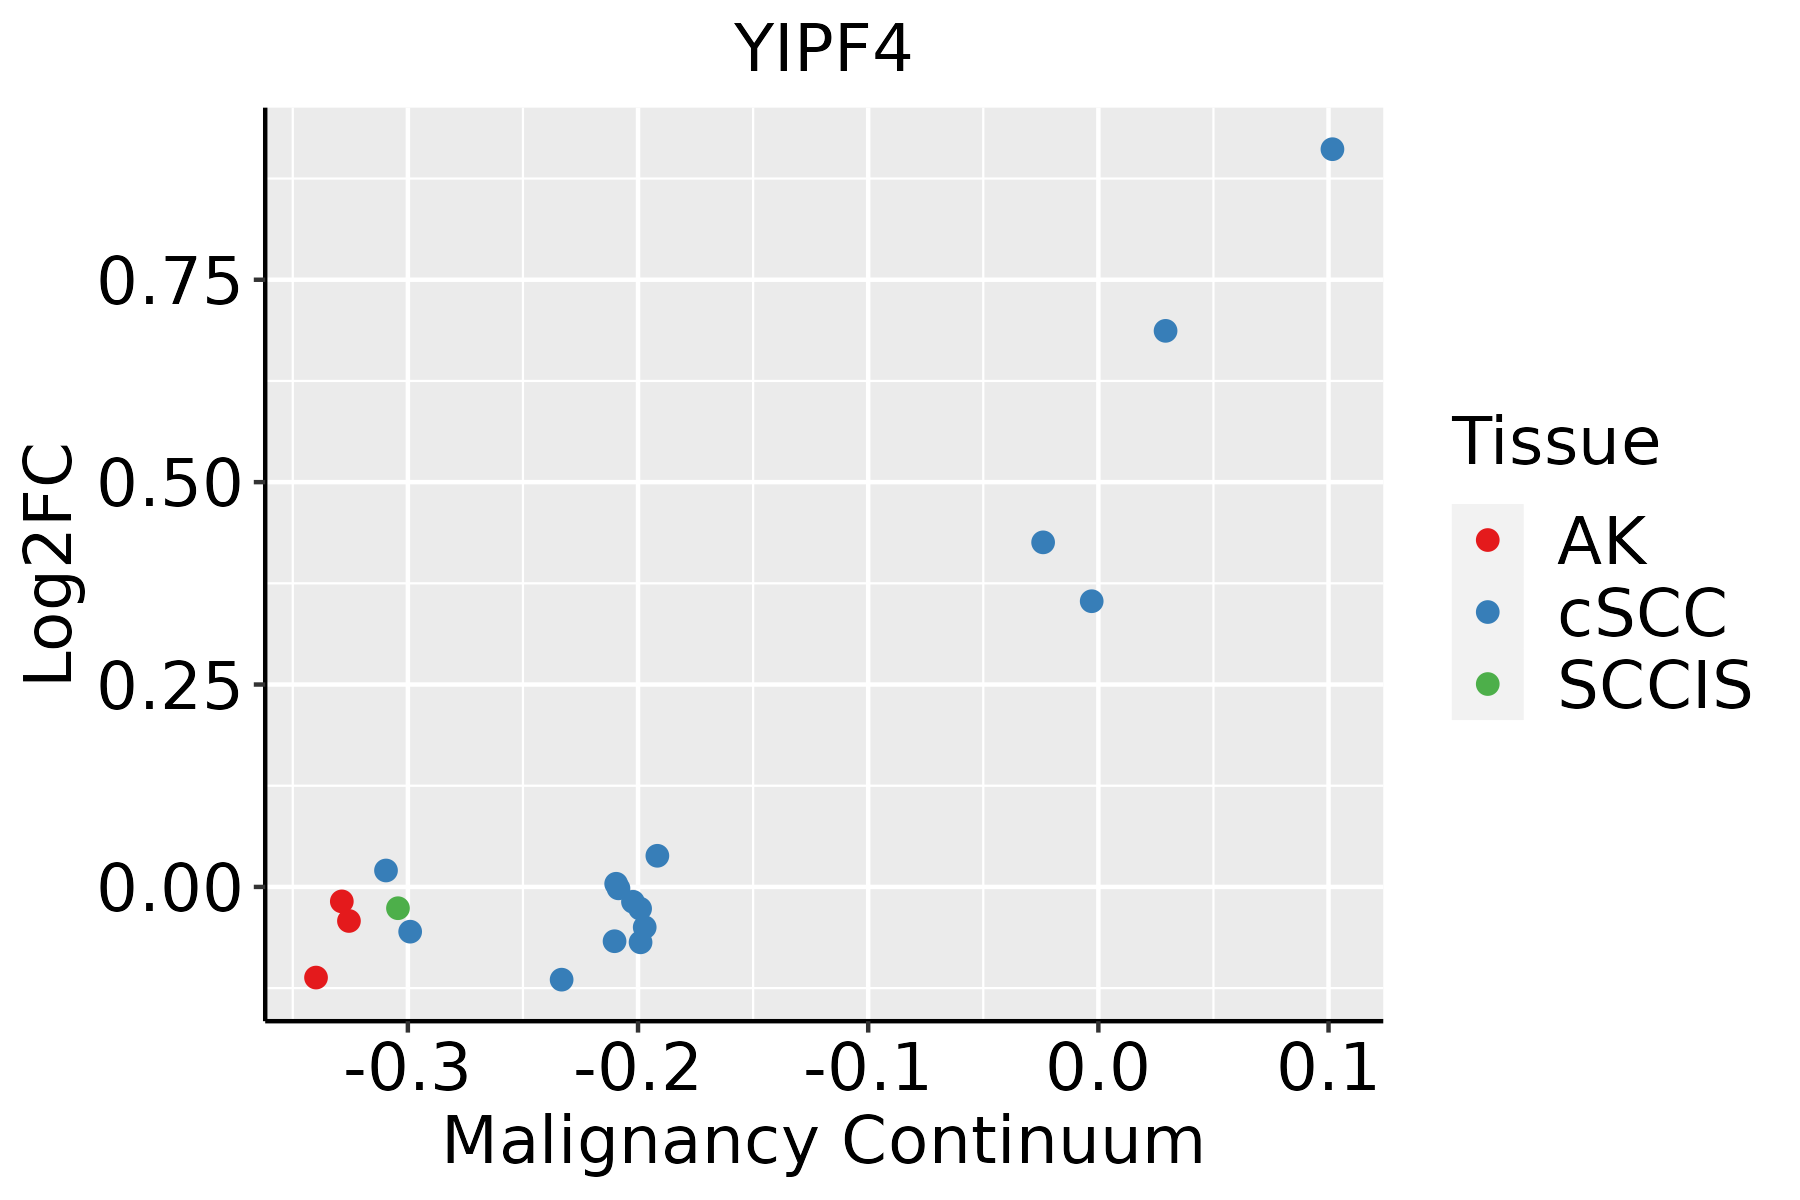 | AK: Actinic keratosis |
| cSCC: Cutaneous squamous cell carcinoma | ||
| SCCIS:squamous cell carcinoma in situ | ||
| Thyroid | 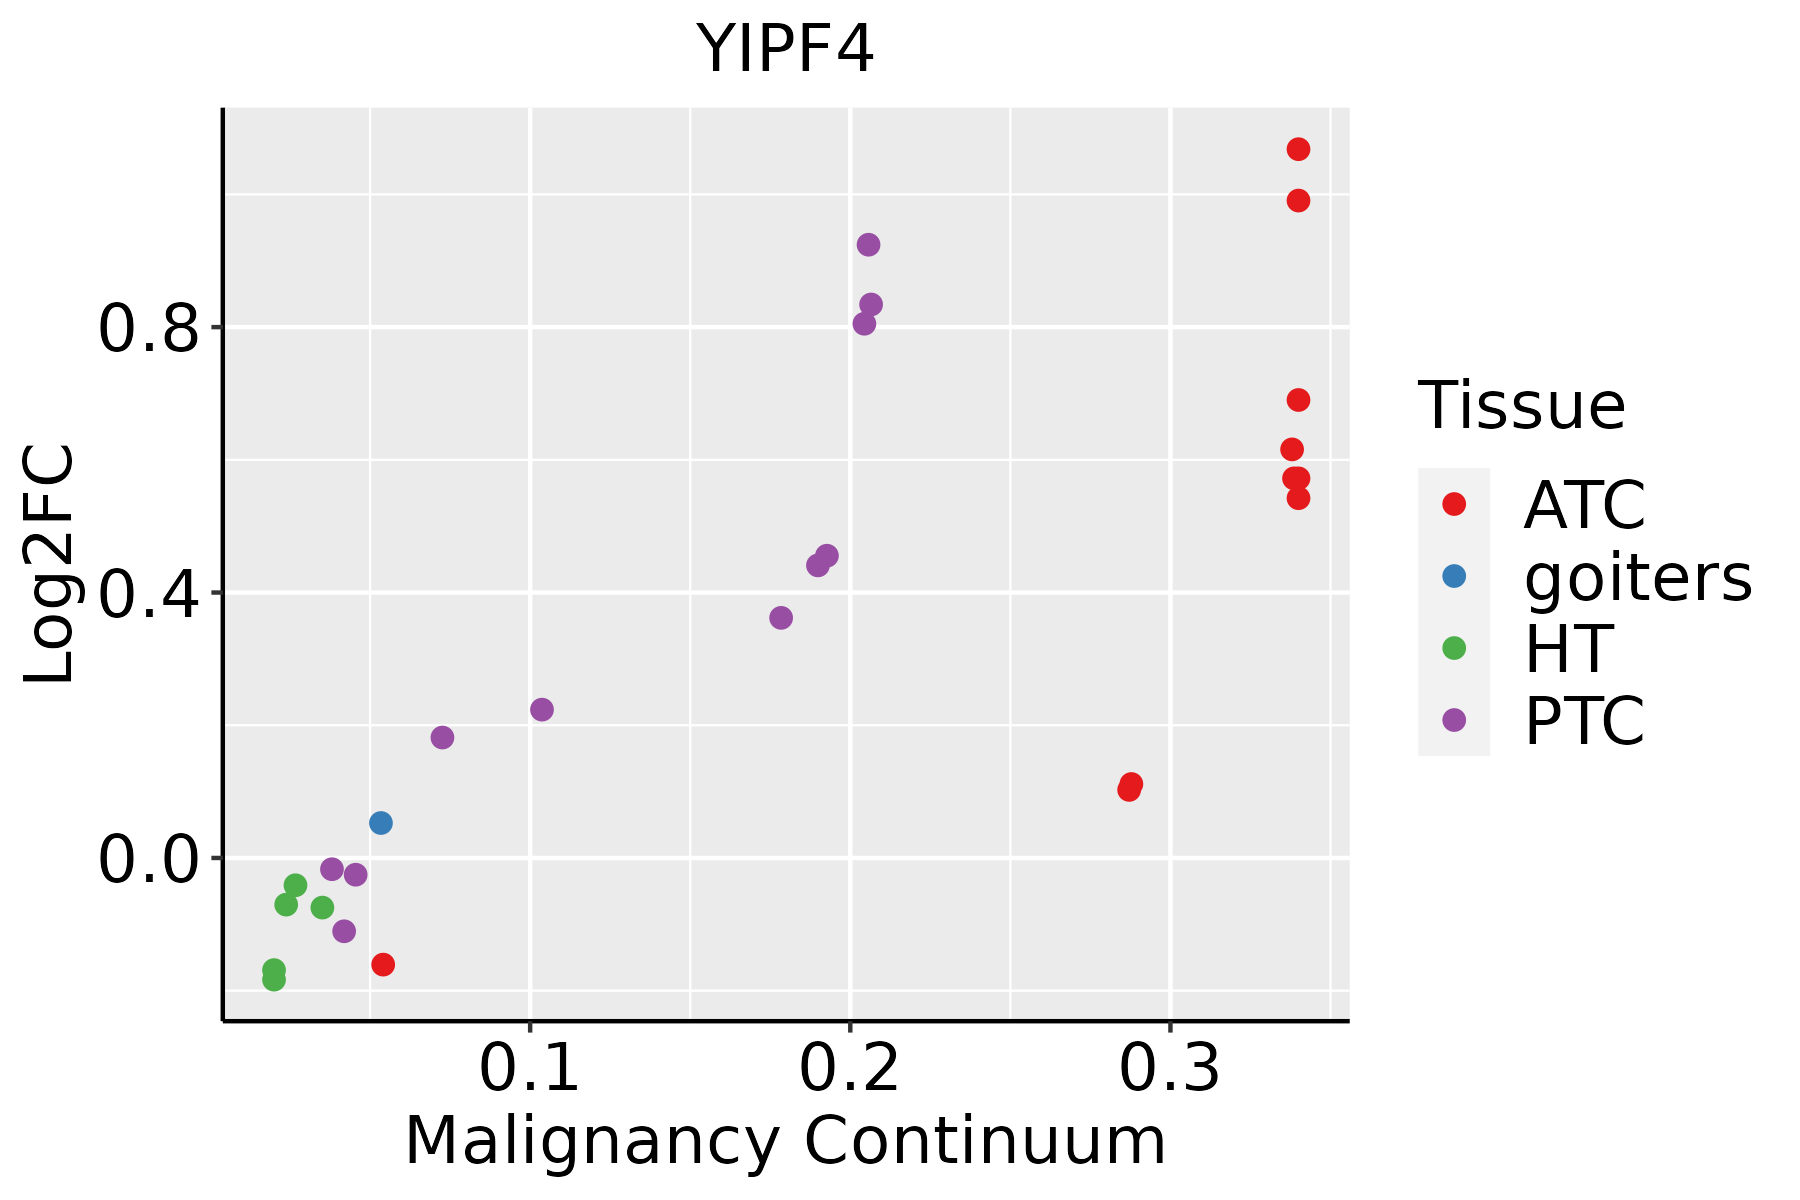 | ATC: Anaplastic thyroid cancer |
| HT: Hashimoto's thyroiditis | ||
| PTC: Papillary thyroid cancer |
| ∗log2FC in expression of this searched gene in stem-like cells from each diseased tissue sample relative to stem-like cells in normal samples in each tissue plotted against the malignancy continuum. Samples are colored based on if they are from different disease stage. |
Top |
Malignant transformation related pathway analysis |
| Find out the enriched GO biological processes and KEGG pathways involved in transition from healthy to precancer to cancer |
| Tissue | Disease Stage | Enriched GO biological Processes |
| Colorectum | AD |  |
| Colorectum | SER |  |
| Colorectum | MSS |  |
| Colorectum | MSI-H |  |
| Colorectum | FAP |  |
| ∗Top 15 enriched GO BP terms are showed in the bar plot of each disease state in each tissue. Each row represents a significant GO biological process which is colored according to the -log10(p.adjust). |
| Page: 1 2 3 4 5 6 7 8 9 |
| GO ID | Tissue | Disease Stage | Description | Gene Ratio | Bg Ratio | pvalue | p.adjust | Count |
| GO:0048193 | Colorectum | AD | Golgi vesicle transport | 109/3918 | 296/18723 | 1.80e-10 | 1.68e-08 | 109 |
| GO:0016050 | Colorectum | AD | vesicle organization | 101/3918 | 300/18723 | 1.65e-07 | 7.17e-06 | 101 |
| GO:0006888 | Colorectum | AD | endoplasmic reticulum to Golgi vesicle-mediated transport | 44/3918 | 130/18723 | 4.13e-04 | 4.68e-03 | 44 |
| GO:0048284 | Colorectum | AD | organelle fusion | 42/3918 | 141/18723 | 8.04e-03 | 4.73e-02 | 42 |
| GO:00481931 | Colorectum | SER | Golgi vesicle transport | 79/2897 | 296/18723 | 4.20e-07 | 2.15e-05 | 79 |
| GO:00160501 | Colorectum | SER | vesicle organization | 69/2897 | 300/18723 | 3.59e-04 | 5.61e-03 | 69 |
| GO:00068881 | Colorectum | SER | endoplasmic reticulum to Golgi vesicle-mediated transport | 34/2897 | 130/18723 | 1.13e-03 | 1.29e-02 | 34 |
| GO:00481932 | Colorectum | MSS | Golgi vesicle transport | 101/3467 | 296/18723 | 9.09e-11 | 9.77e-09 | 101 |
| GO:00160502 | Colorectum | MSS | vesicle organization | 93/3467 | 300/18723 | 1.04e-07 | 4.97e-06 | 93 |
| GO:00068882 | Colorectum | MSS | endoplasmic reticulum to Golgi vesicle-mediated transport | 44/3467 | 130/18723 | 2.17e-05 | 4.60e-04 | 44 |
| GO:00482841 | Colorectum | MSS | organelle fusion | 39/3467 | 141/18723 | 4.91e-03 | 3.42e-02 | 39 |
| GO:00481934 | Colorectum | FAP | Golgi vesicle transport | 77/2622 | 296/18723 | 2.86e-08 | 2.62e-06 | 77 |
| GO:00160503 | Colorectum | FAP | vesicle organization | 74/2622 | 300/18723 | 5.16e-07 | 2.66e-05 | 74 |
| GO:00068884 | Colorectum | FAP | endoplasmic reticulum to Golgi vesicle-mediated transport | 30/2622 | 130/18723 | 3.51e-03 | 2.53e-02 | 30 |
| GO:004819318 | Esophagus | ESCC | Golgi vesicle transport | 231/8552 | 296/18723 | 1.82e-30 | 9.63e-28 | 231 |
| GO:001605014 | Esophagus | ESCC | vesicle organization | 211/8552 | 300/18723 | 2.85e-18 | 2.87e-16 | 211 |
| GO:000688815 | Esophagus | ESCC | endoplasmic reticulum to Golgi vesicle-mediated transport | 102/8552 | 130/18723 | 1.73e-14 | 9.22e-13 | 102 |
| GO:00482844 | Esophagus | ESCC | organelle fusion | 94/8552 | 141/18723 | 3.72e-07 | 5.16e-06 | 94 |
| GO:00070308 | Esophagus | ESCC | Golgi organization | 101/8552 | 157/18723 | 1.78e-06 | 2.10e-05 | 101 |
| GO:00901743 | Esophagus | ESCC | organelle membrane fusion | 73/8552 | 110/18723 | 9.29e-06 | 8.88e-05 | 73 |
| Page: 1 2 3 4 5 |
| Pathway ID | Tissue | Disease Stage | Description | Gene Ratio | Bg Ratio | pvalue | p.adjust | qvalue | Count |
| Page: 1 |
Top |
Cell-cell communication analysis |
| Identification of potential cell-cell interactions between two cell types and their ligand-receptor pairs for different disease states |
| Ligand | Receptor | LRpair | Pathway | Tissue | Disease Stage |
| Page: 1 |
Top |
Single-cell gene regulatory network inference analysis |
| Find out the significant the regulons (TFs) and the target genes of each regulon across cell types for different disease states |
| TF | Cell Type | Tissue | Disease Stage | Target Gene | RSS | Regulon Activity |
| ∗The dot plots of a searched regulon are shown for all cell subpopulations in each disease state of each tissue based on the regulon specific score inferred using pySCENIC and by calculating the average expression. |
| Page: 1 |
Top |
Somatic mutation of malignant transformation related genes |
| Annotation of somatic variants for genes involved in malignant transformation |
| Hugo Symbol | Variant Class | Variant Classification | dbSNP RS | HGVSc | HGVSp | HGVSp Short | SWISSPROT | BIOTYPE | SIFT | PolyPhen | Tumor Sample Barcode | Tissue | Histology | Sex | Age | Stage | Therapy Types | Drugs | Outcome |
| YIPF4 | SNV | Missense_Mutation | c.638N>C | p.Leu213Ser | p.L213S | Q9BSR8 | protein_coding | deleterious(0) | possibly_damaging(0.683) | TCGA-AA-3697-01 | Colorectum | colon adenocarcinoma | Male | >=65 | I/II | Unknown | Unknown | SD | |
| YIPF4 | SNV | Missense_Mutation | c.607G>A | p.Val203Met | p.V203M | Q9BSR8 | protein_coding | deleterious(0) | probably_damaging(0.995) | TCGA-AD-6964-01 | Colorectum | colon adenocarcinoma | Male | <65 | III/IV | Chemotherapy | folfox | PD | |
| YIPF4 | SNV | Missense_Mutation | c.724A>G | p.Thr242Ala | p.T242A | Q9BSR8 | protein_coding | deleterious(0.01) | benign(0.076) | TCGA-AU-6004-01 | Colorectum | colon adenocarcinoma | Female | >=65 | I/II | Unknown | Unknown | SD | |
| YIPF4 | SNV | Missense_Mutation | novel | c.344N>G | p.Phe115Cys | p.F115C | Q9BSR8 | protein_coding | deleterious(0) | probably_damaging(0.995) | TCGA-A5-A0G2-01 | Endometrium | uterine corpus endometrioid carcinoma | Female | <65 | III/IV | Unknown | Unknown | SD |
| YIPF4 | SNV | Missense_Mutation | novel | c.100T>C | p.Ser34Pro | p.S34P | Q9BSR8 | protein_coding | tolerated(0.2) | benign(0) | TCGA-B5-A1MX-01 | Endometrium | uterine corpus endometrioid carcinoma | Female | <65 | I/II | Hormone Therapy | megace | SD |
| YIPF4 | SNV | Missense_Mutation | c.130N>T | p.Asp44Tyr | p.D44Y | Q9BSR8 | protein_coding | tolerated(0.05) | benign(0) | TCGA-BS-A0UF-01 | Endometrium | uterine corpus endometrioid carcinoma | Female | >=65 | I/II | Unknown | Unknown | SD | |
| YIPF4 | SNV | Missense_Mutation | c.711N>G | p.Phe237Leu | p.F237L | Q9BSR8 | protein_coding | tolerated(0.08) | benign(0.038) | TCGA-BS-A0UF-01 | Endometrium | uterine corpus endometrioid carcinoma | Female | >=65 | I/II | Unknown | Unknown | SD | |
| YIPF4 | SNV | Missense_Mutation | novel | c.250G>T | p.Asp84Tyr | p.D84Y | Q9BSR8 | protein_coding | deleterious(0) | probably_damaging(0.998) | TCGA-E6-A1LX-01 | Endometrium | uterine corpus endometrioid carcinoma | Female | <65 | I/II | Unknown | Unknown | SD |
| YIPF4 | SNV | Missense_Mutation | novel | c.728G>A | p.Gly243Asp | p.G243D | Q9BSR8 | protein_coding | deleterious(0) | benign(0.211) | TCGA-EO-A22R-01 | Endometrium | uterine corpus endometrioid carcinoma | Female | <65 | I/II | Unknown | Unknown | SD |
| YIPF4 | SNV | Missense_Mutation | novel | c.460N>A | p.Leu154Met | p.L154M | Q9BSR8 | protein_coding | deleterious(0.01) | probably_damaging(0.992) | TCGA-EO-A22U-01 | Endometrium | uterine corpus endometrioid carcinoma | Female | >=65 | I/II | Unknown | Unknown | SD |
| Page: 1 2 3 |
Top |
Related drugs of malignant transformation related genes |
| Identification of chemicals and drugs interact with genes involved in malignant transfromation |
| (DGIdb 4.0) |
| Entrez ID | Symbol | Category | Interaction Types | Drug Claim Name | Drug Name | PMIDs |
| Page: 1 |

Copyright 2023-Present -The University of Texas Health Science Center at Houston |