
|
|||||
|
 | |
| |
| |
| |
| |
| |
|
Gene: YIF1B |
Gene summary for YIF1B |
| Gene information | Species | Human | Gene symbol | YIF1B | Gene ID | 90522 |
| Gene name | Yip1 interacting factor homolog B, membrane trafficking protein | |
| Gene Alias | FinGER8 | |
| Cytomap | 19q13.2 | |
| Gene Type | protein-coding | GO ID | GO:0000003 | UniProtAcc | Q9H5F7 |
Top |
Malignant transformation analysis |
| Identification of the aberrant gene expression in precancerous and cancerous lesions by comparing the gene expression of stem-like cells in diseased tissues with normal stem cells |
| Entrez ID | Symbol | Replicates | Species | Organ | Tissue | Adj P-value | Log2FC | Malignancy |
| 90522 | YIF1B | LZE2T | Human | Esophagus | ESCC | 7.99e-05 | 4.55e-01 | 0.082 |
| 90522 | YIF1B | LZE4T | Human | Esophagus | ESCC | 1.14e-18 | 4.79e-01 | 0.0811 |
| 90522 | YIF1B | LZE5T | Human | Esophagus | ESCC | 3.10e-08 | 4.06e-01 | 0.0514 |
| 90522 | YIF1B | LZE7T | Human | Esophagus | ESCC | 8.45e-18 | 7.86e-01 | 0.0667 |
| 90522 | YIF1B | LZE8T | Human | Esophagus | ESCC | 1.50e-10 | 3.36e-01 | 0.067 |
| 90522 | YIF1B | LZE22T | Human | Esophagus | ESCC | 2.73e-05 | 5.48e-01 | 0.068 |
| 90522 | YIF1B | LZE24T | Human | Esophagus | ESCC | 2.93e-24 | 6.49e-01 | 0.0596 |
| 90522 | YIF1B | LZE21T | Human | Esophagus | ESCC | 3.45e-04 | 4.49e-01 | 0.0655 |
| 90522 | YIF1B | LZE6T | Human | Esophagus | ESCC | 1.55e-09 | 4.18e-01 | 0.0845 |
| 90522 | YIF1B | P1T-E | Human | Esophagus | ESCC | 2.92e-24 | 1.12e+00 | 0.0875 |
| 90522 | YIF1B | P2T-E | Human | Esophagus | ESCC | 5.05e-54 | 9.11e-01 | 0.1177 |
| 90522 | YIF1B | P4T-E | Human | Esophagus | ESCC | 1.14e-39 | 9.33e-01 | 0.1323 |
| 90522 | YIF1B | P5T-E | Human | Esophagus | ESCC | 2.73e-41 | 7.78e-01 | 0.1327 |
| 90522 | YIF1B | P8T-E | Human | Esophagus | ESCC | 1.64e-26 | 5.27e-01 | 0.0889 |
| 90522 | YIF1B | P9T-E | Human | Esophagus | ESCC | 9.59e-23 | 5.53e-01 | 0.1131 |
| 90522 | YIF1B | P10T-E | Human | Esophagus | ESCC | 1.13e-57 | 9.46e-01 | 0.116 |
| 90522 | YIF1B | P11T-E | Human | Esophagus | ESCC | 3.22e-31 | 1.11e+00 | 0.1426 |
| 90522 | YIF1B | P12T-E | Human | Esophagus | ESCC | 1.51e-38 | 6.84e-01 | 0.1122 |
| 90522 | YIF1B | P15T-E | Human | Esophagus | ESCC | 3.43e-37 | 8.61e-01 | 0.1149 |
| 90522 | YIF1B | P16T-E | Human | Esophagus | ESCC | 2.72e-29 | 4.54e-01 | 0.1153 |
| Page: 1 2 3 4 5 6 |
| Tissue | Expression Dynamics | Abbreviation |
| Esophagus | 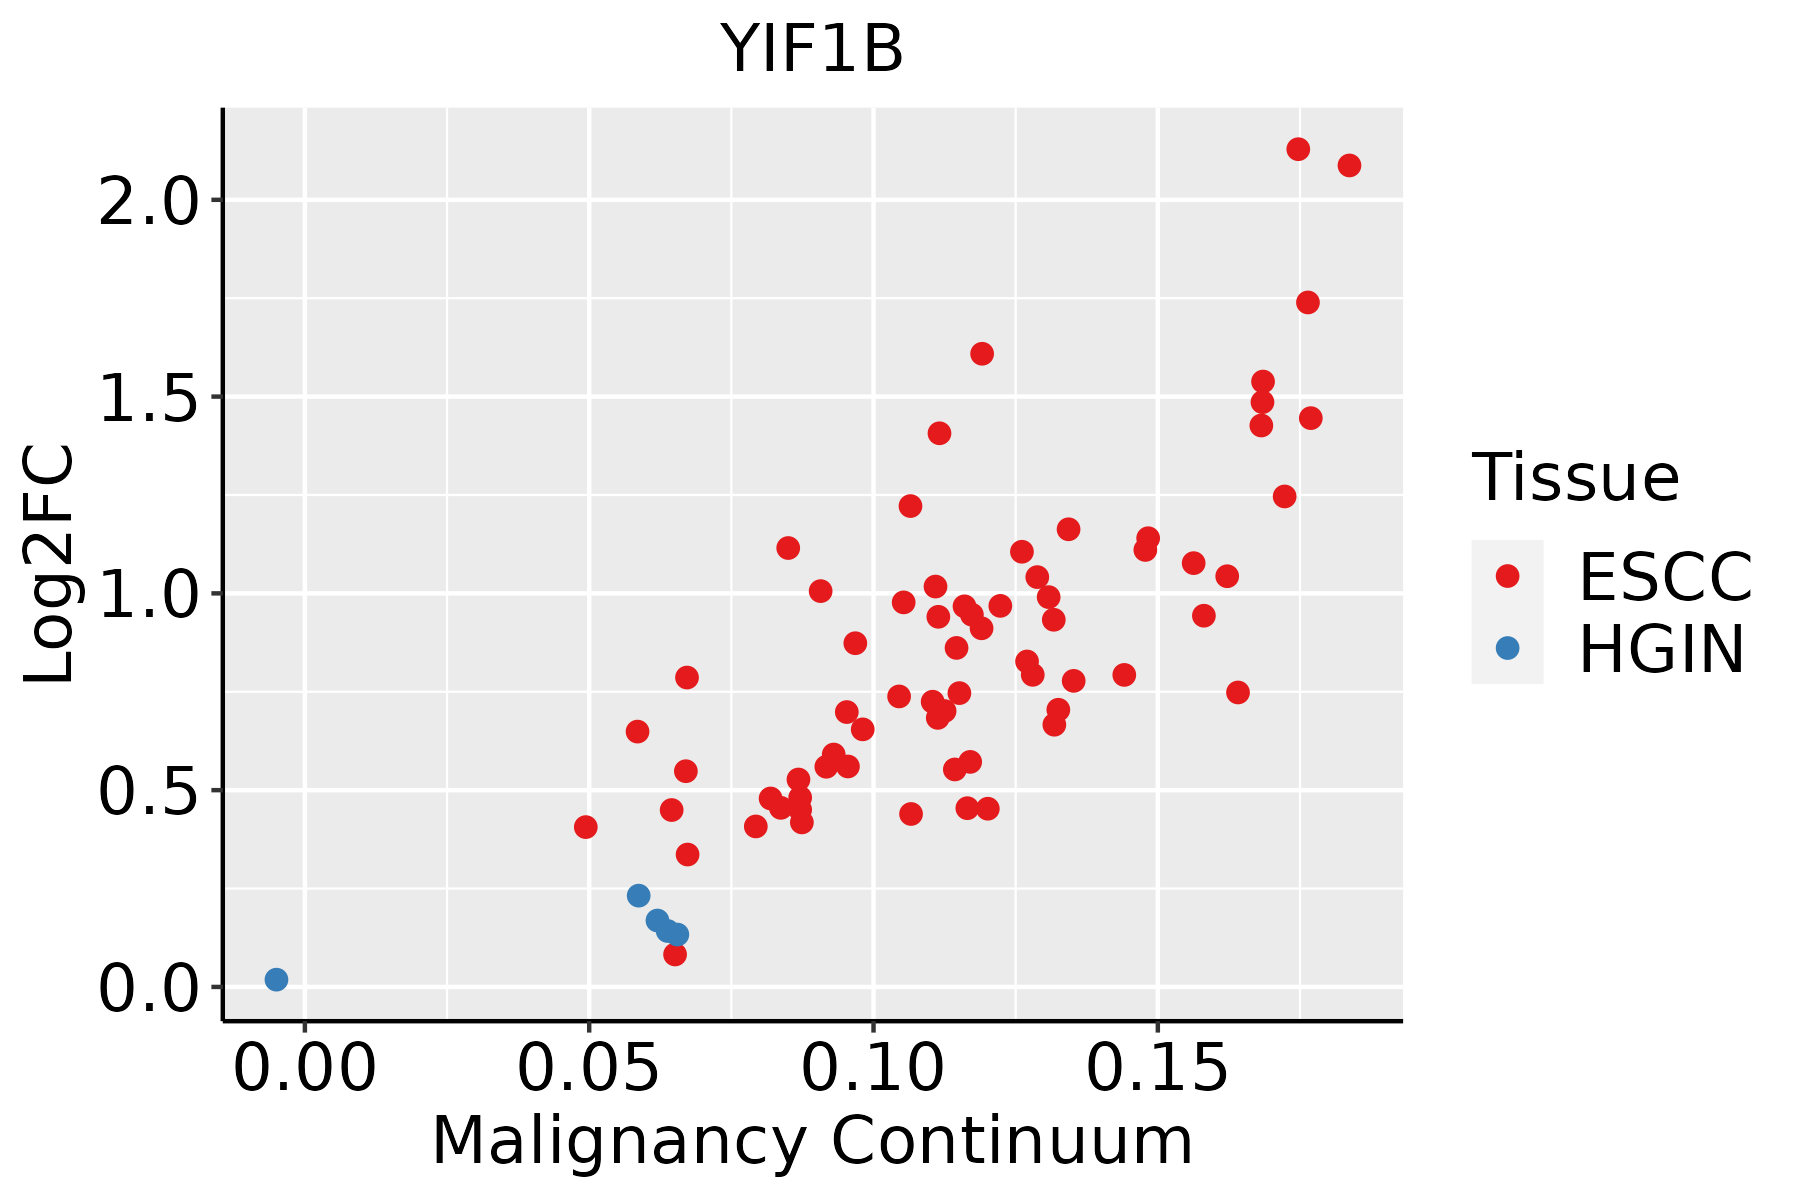 | ESCC: Esophageal squamous cell carcinoma |
| HGIN: High-grade intraepithelial neoplasias | ||
| LGIN: Low-grade intraepithelial neoplasias | ||
| Liver | 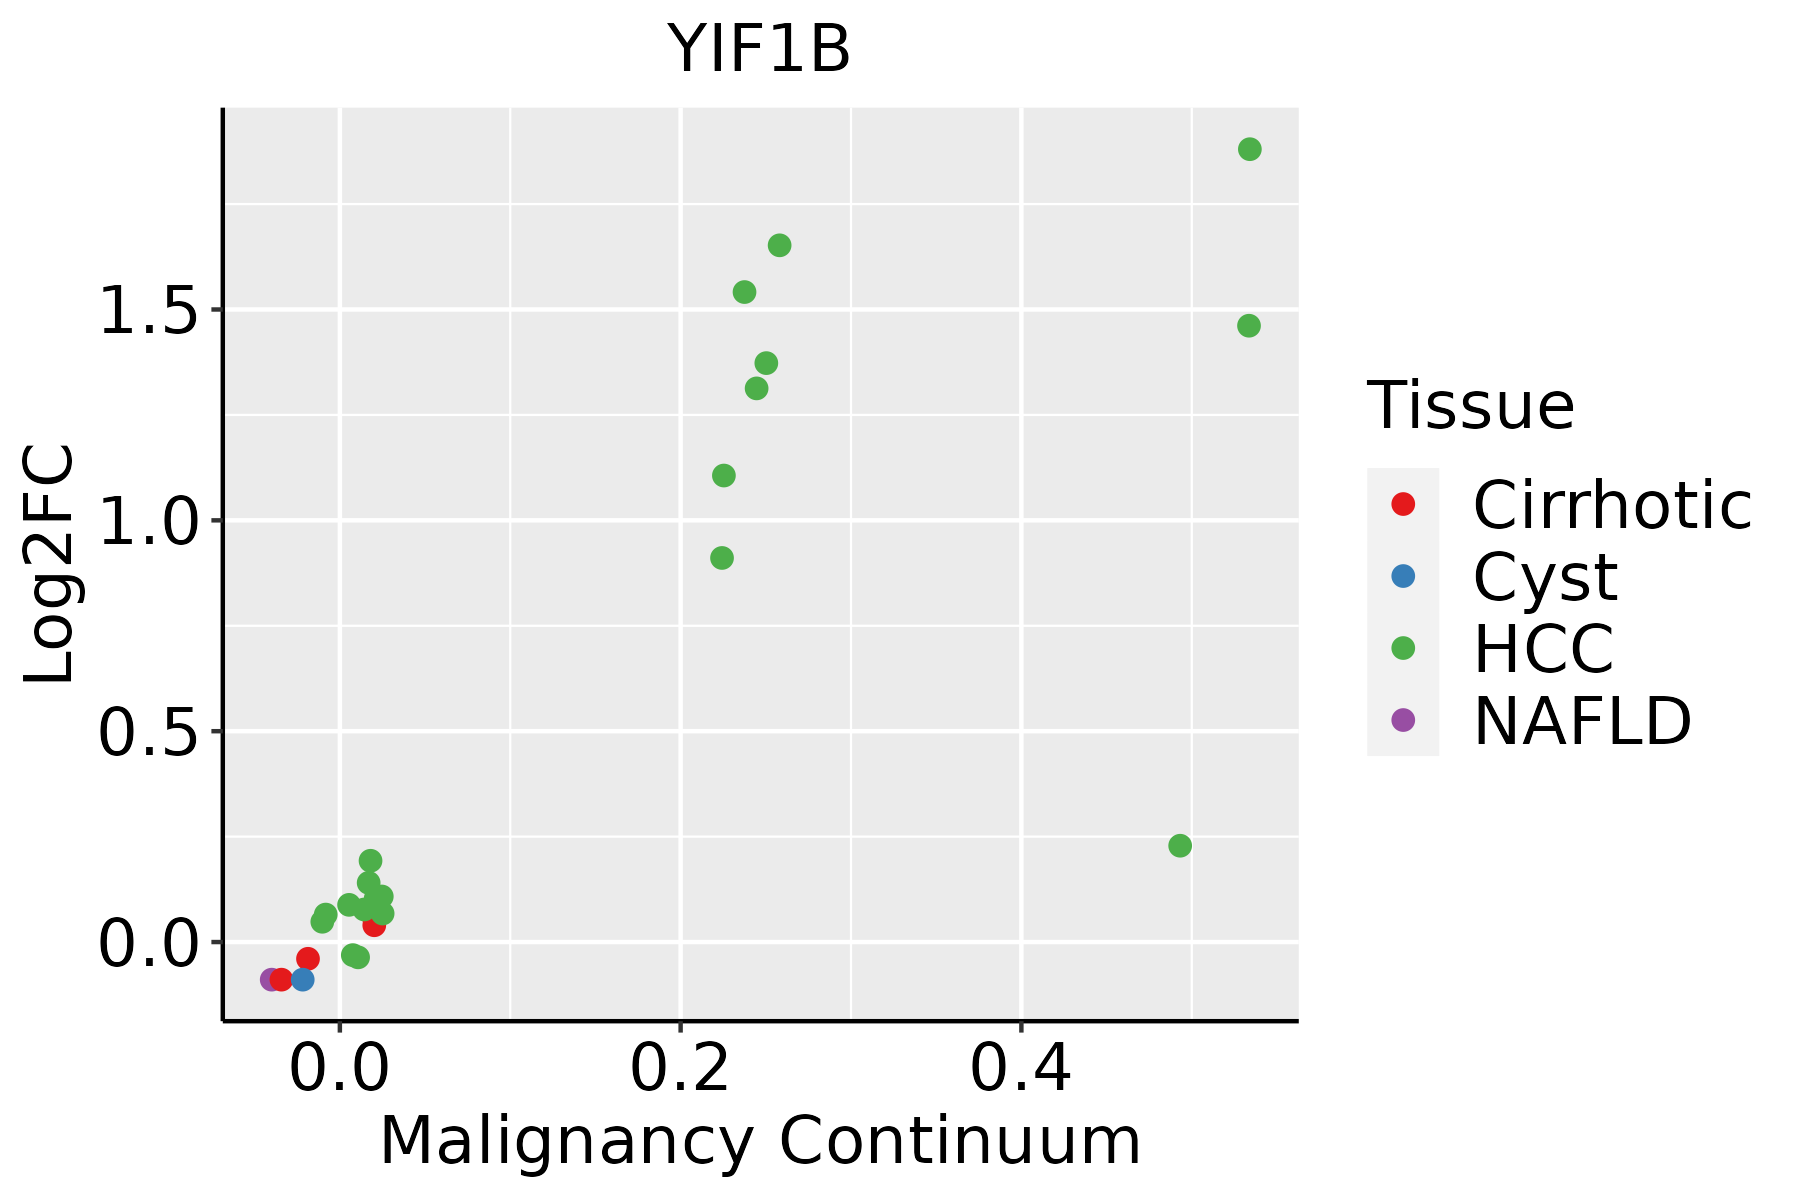 | HCC: Hepatocellular carcinoma |
| NAFLD: Non-alcoholic fatty liver disease | ||
| Oral Cavity | 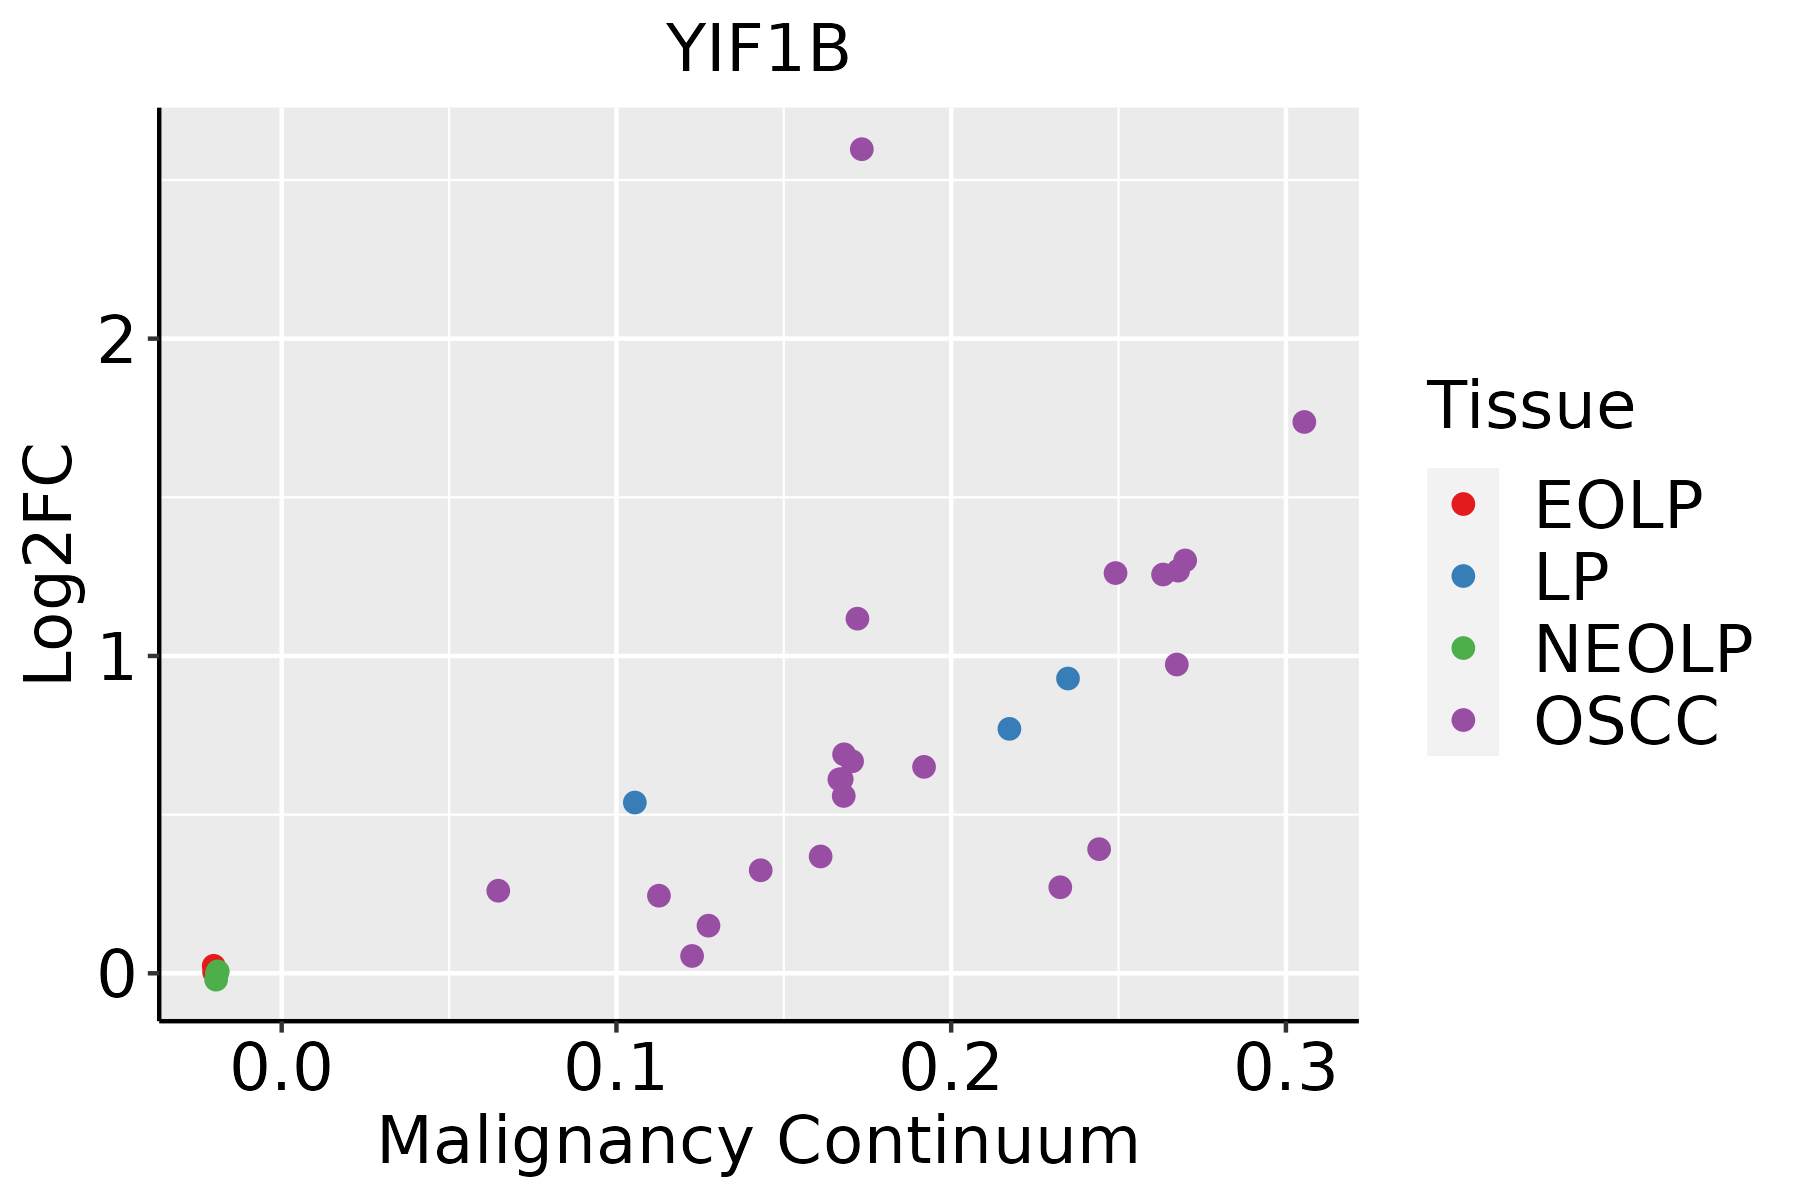 | EOLP: Erosive Oral lichen planus |
| LP: leukoplakia | ||
| NEOLP: Non-erosive oral lichen planus | ||
| OSCC: Oral squamous cell carcinoma | ||
| Skin | 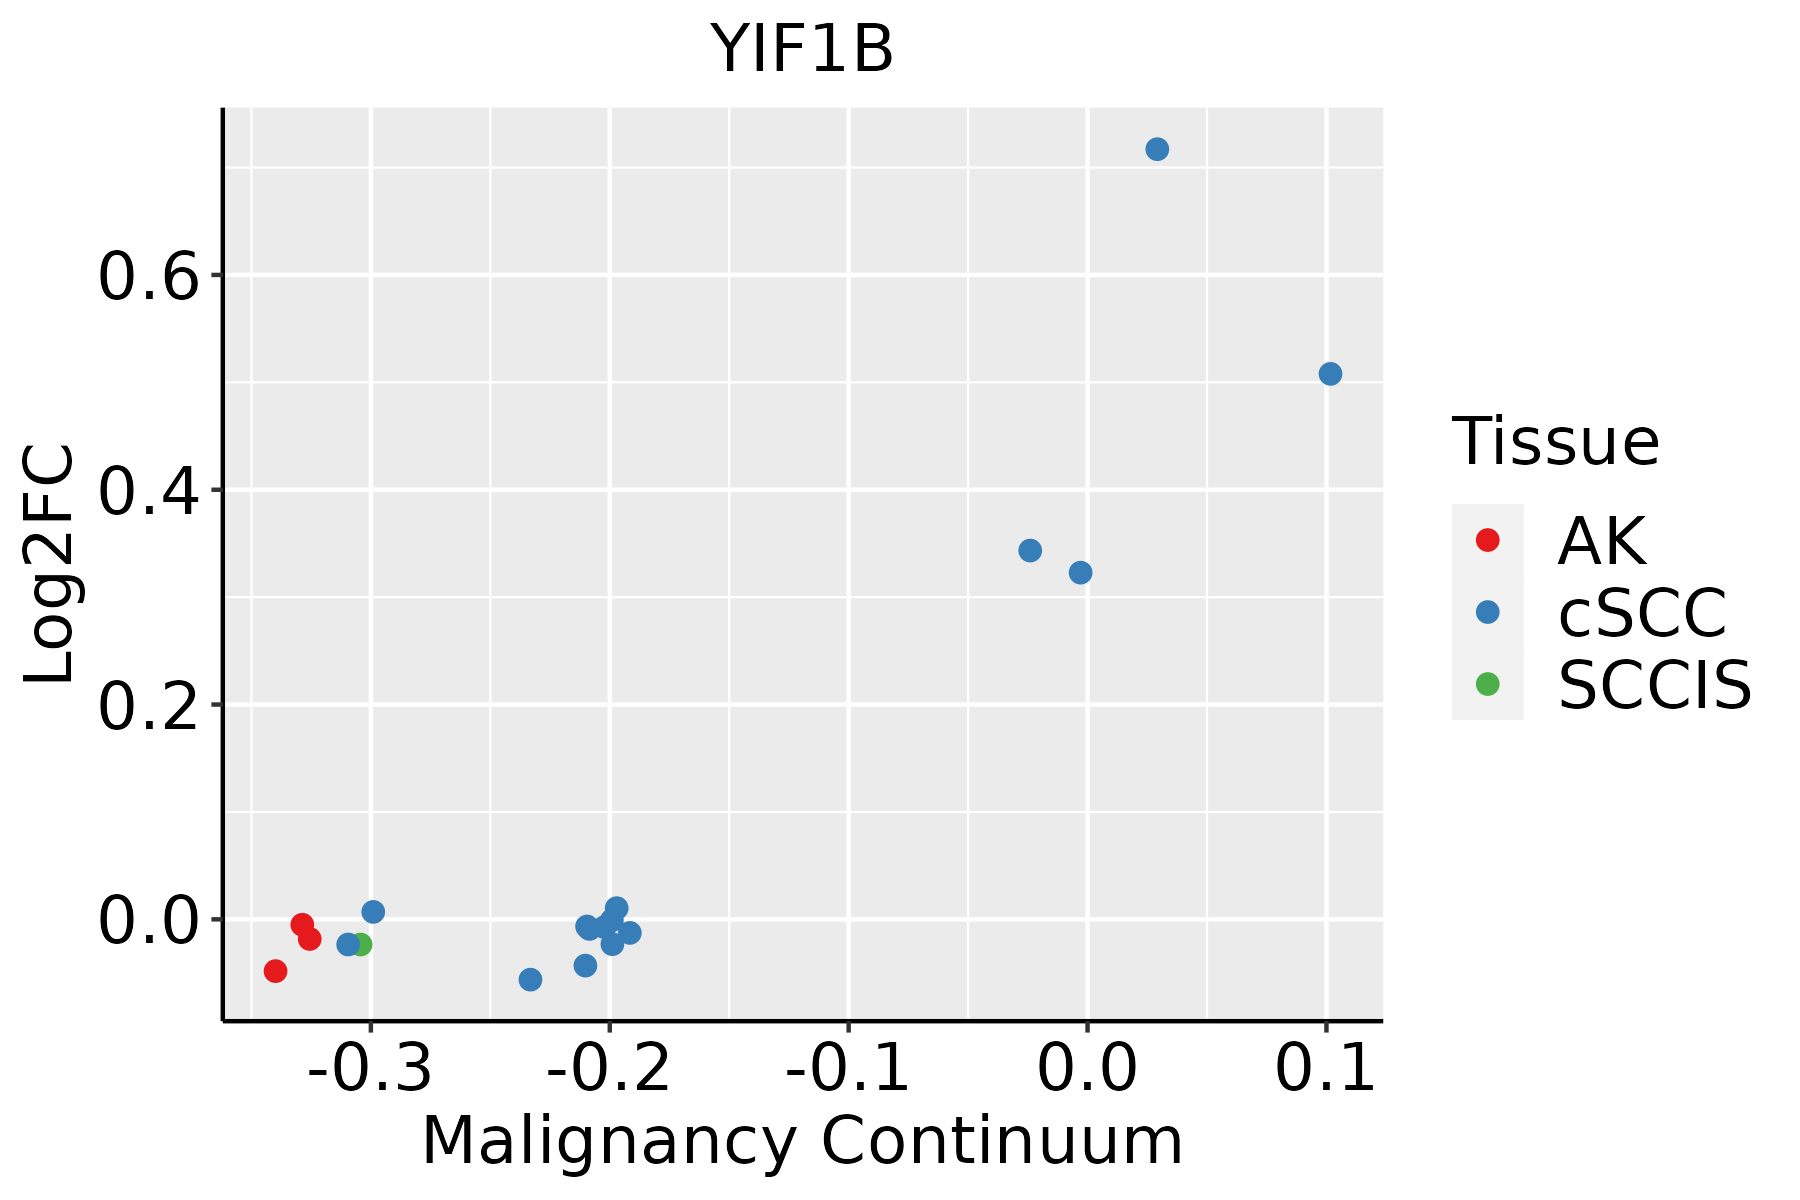 | AK: Actinic keratosis |
| cSCC: Cutaneous squamous cell carcinoma | ||
| SCCIS:squamous cell carcinoma in situ | ||
| Thyroid | 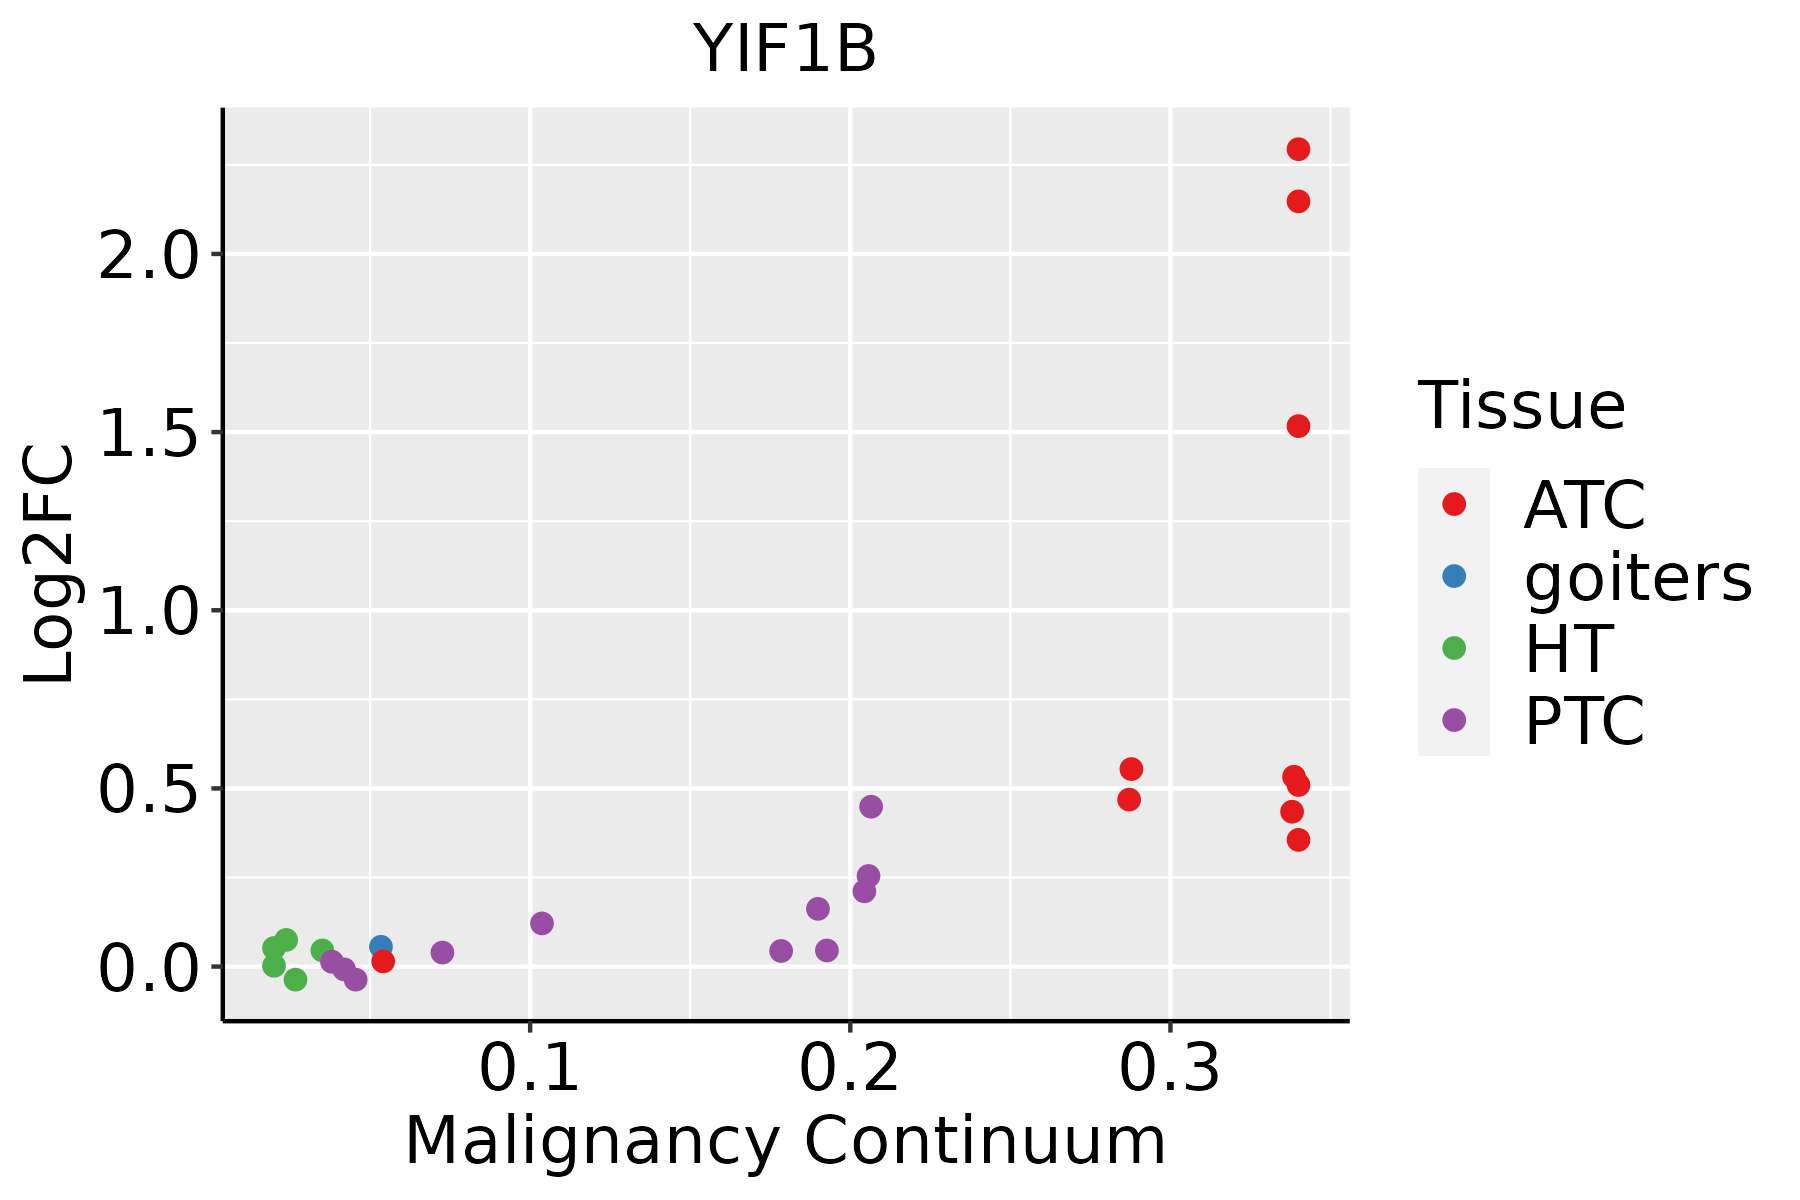 | ATC: Anaplastic thyroid cancer |
| HT: Hashimoto's thyroiditis | ||
| PTC: Papillary thyroid cancer |
| ∗log2FC in expression of this searched gene in stem-like cells from each diseased tissue sample relative to stem-like cells in normal samples in each tissue plotted against the malignancy continuum. Samples are colored based on if they are from different disease stage. |
Top |
Malignant transformation related pathway analysis |
| Find out the enriched GO biological processes and KEGG pathways involved in transition from healthy to precancer to cancer |
| Tissue | Disease Stage | Enriched GO biological Processes |
| Colorectum | AD |  |
| Colorectum | SER |  |
| Colorectum | MSS |  |
| Colorectum | MSI-H |  |
| Colorectum | FAP |  |
| ∗Top 15 enriched GO BP terms are showed in the bar plot of each disease state in each tissue. Each row represents a significant GO biological process which is colored according to the -log10(p.adjust). |
| Page: 1 2 3 4 5 6 7 8 9 |
| GO ID | Tissue | Disease Stage | Description | Gene Ratio | Bg Ratio | pvalue | p.adjust | Count |
| GO:004819318 | Esophagus | ESCC | Golgi vesicle transport | 231/8552 | 296/18723 | 1.82e-30 | 9.63e-28 | 231 |
| GO:0006605111 | Esophagus | ESCC | protein targeting | 229/8552 | 314/18723 | 4.93e-23 | 1.01e-20 | 229 |
| GO:0090150110 | Esophagus | ESCC | establishment of protein localization to membrane | 182/8552 | 260/18723 | 1.27e-15 | 8.19e-14 | 182 |
| GO:000688815 | Esophagus | ESCC | endoplasmic reticulum to Golgi vesicle-mediated transport | 102/8552 | 130/18723 | 1.73e-14 | 9.22e-13 | 102 |
| GO:00066124 | Esophagus | ESCC | protein targeting to membrane | 83/8552 | 131/18723 | 3.31e-05 | 2.73e-04 | 83 |
| GO:004819311 | Liver | Cirrhotic | Golgi vesicle transport | 153/4634 | 296/18723 | 1.02e-23 | 6.43e-21 | 153 |
| GO:00066057 | Liver | Cirrhotic | protein targeting | 148/4634 | 314/18723 | 3.86e-18 | 6.20e-16 | 148 |
| GO:000688811 | Liver | Cirrhotic | endoplasmic reticulum to Golgi vesicle-mediated transport | 77/4634 | 130/18723 | 5.78e-17 | 7.56e-15 | 77 |
| GO:00901507 | Liver | Cirrhotic | establishment of protein localization to membrane | 123/4634 | 260/18723 | 1.85e-15 | 2.15e-13 | 123 |
| GO:00066122 | Liver | Cirrhotic | protein targeting to membrane | 53/4634 | 131/18723 | 5.17e-05 | 5.95e-04 | 53 |
| GO:004819321 | Liver | HCC | Golgi vesicle transport | 217/7958 | 296/18723 | 2.58e-27 | 1.02e-24 | 217 |
| GO:000660512 | Liver | HCC | protein targeting | 219/7958 | 314/18723 | 7.74e-23 | 1.49e-20 | 219 |
| GO:000688821 | Liver | HCC | endoplasmic reticulum to Golgi vesicle-mediated transport | 100/7958 | 130/18723 | 1.15e-15 | 8.67e-14 | 100 |
| GO:009015012 | Liver | HCC | establishment of protein localization to membrane | 168/7958 | 260/18723 | 4.07e-13 | 2.13e-11 | 168 |
| GO:00066121 | Liver | HCC | protein targeting to membrane | 75/7958 | 131/18723 | 4.58e-04 | 3.04e-03 | 75 |
| GO:004819315 | Oral cavity | OSCC | Golgi vesicle transport | 209/7305 | 296/18723 | 1.39e-28 | 6.30e-26 | 209 |
| GO:000660520 | Oral cavity | OSCC | protein targeting | 204/7305 | 314/18723 | 6.78e-21 | 1.13e-18 | 204 |
| GO:00068888 | Oral cavity | OSCC | endoplasmic reticulum to Golgi vesicle-mediated transport | 97/7305 | 130/18723 | 1.42e-16 | 1.15e-14 | 97 |
| GO:009015018 | Oral cavity | OSCC | establishment of protein localization to membrane | 163/7305 | 260/18723 | 7.13e-15 | 4.47e-13 | 163 |
| GO:00066123 | Oral cavity | OSCC | protein targeting to membrane | 75/7305 | 131/18723 | 1.72e-05 | 1.69e-04 | 75 |
| Page: 1 2 |
| Pathway ID | Tissue | Disease Stage | Description | Gene Ratio | Bg Ratio | pvalue | p.adjust | qvalue | Count |
| Page: 1 |
Top |
Cell-cell communication analysis |
| Identification of potential cell-cell interactions between two cell types and their ligand-receptor pairs for different disease states |
| Ligand | Receptor | LRpair | Pathway | Tissue | Disease Stage |
| Page: 1 |
Top |
Single-cell gene regulatory network inference analysis |
| Find out the significant the regulons (TFs) and the target genes of each regulon across cell types for different disease states |
| TF | Cell Type | Tissue | Disease Stage | Target Gene | RSS | Regulon Activity |
| ∗The dot plots of a searched regulon are shown for all cell subpopulations in each disease state of each tissue based on the regulon specific score inferred using pySCENIC and by calculating the average expression. |
| Page: 1 |
Top |
Somatic mutation of malignant transformation related genes |
| Annotation of somatic variants for genes involved in malignant transformation |
| Hugo Symbol | Variant Class | Variant Classification | dbSNP RS | HGVSc | HGVSp | HGVSp Short | SWISSPROT | BIOTYPE | SIFT | PolyPhen | Tumor Sample Barcode | Tissue | Histology | Sex | Age | Stage | Therapy Types | Drugs | Outcome |
| YIF1B | SNV | Missense_Mutation | c.559G>T | p.Gly187Trp | p.G187W | Q5BJH7 | protein_coding | deleterious(0) | probably_damaging(1) | TCGA-AO-A128-01 | Breast | breast invasive carcinoma | Female | <65 | I/II | Chemotherapy | doxorubicin | SD | |
| YIF1B | SNV | Missense_Mutation | c.310N>G | p.Ile104Val | p.I104V | Q5BJH7 | protein_coding | tolerated(0.69) | benign(0.224) | TCGA-AA-3821-01 | Colorectum | colon adenocarcinoma | Female | >=65 | I/II | Unknown | Unknown | SD | |
| YIF1B | SNV | Missense_Mutation | c.313N>A | p.Pro105Thr | p.P105T | Q5BJH7 | protein_coding | tolerated(0.16) | possibly_damaging(0.833) | TCGA-WS-AB45-01 | Colorectum | colon adenocarcinoma | Female | <65 | I/II | Unknown | Unknown | SD | |
| YIF1B | SNV | Missense_Mutation | c.740N>A | p.Gly247Asp | p.G247D | Q5BJH7 | protein_coding | deleterious(0) | probably_damaging(0.968) | TCGA-AG-A02N-01 | Colorectum | rectum adenocarcinoma | Male | >=65 | I/II | Chemotherapy | folinic | CR | |
| YIF1B | deletion | Frame_Shift_Del | c.445delN | p.Arg149AlafsTer49 | p.R149Afs*49 | Q5BJH7 | protein_coding | TCGA-A6-2686-01 | Colorectum | colon adenocarcinoma | Female | >=65 | I/II | Unknown | Unknown | SD | |||
| YIF1B | SNV | Missense_Mutation | rs370851309 | c.769N>A | p.Val257Ile | p.V257I | Q5BJH7 | protein_coding | tolerated(0.93) | benign(0.007) | TCGA-AP-A059-01 | Endometrium | uterine corpus endometrioid carcinoma | Female | >=65 | I/II | Unknown | Unknown | SD |
| YIF1B | SNV | Missense_Mutation | rs371785520 | c.89N>T | p.Pro30Leu | p.P30L | Q5BJH7 | protein_coding | tolerated(0.24) | benign(0) | TCGA-AP-A059-01 | Endometrium | uterine corpus endometrioid carcinoma | Female | >=65 | I/II | Unknown | Unknown | SD |
| YIF1B | SNV | Missense_Mutation | c.530N>T | p.Thr177Ile | p.T177I | Q5BJH7 | protein_coding | tolerated(0.71) | probably_damaging(0.999) | TCGA-AX-A05Y-01 | Endometrium | uterine corpus endometrioid carcinoma | Female | <65 | I/II | Unknown | Unknown | PD | |
| YIF1B | SNV | Missense_Mutation | c.512N>T | p.Ala171Val | p.A171V | Q5BJH7 | protein_coding | deleterious(0) | probably_damaging(0.999) | TCGA-B5-A11Y-01 | Endometrium | uterine corpus endometrioid carcinoma | Female | <65 | I/II | Unknown | Unknown | SD | |
| YIF1B | SNV | Missense_Mutation | c.626A>G | p.Tyr209Cys | p.Y209C | Q5BJH7 | protein_coding | deleterious(0) | probably_damaging(0.999) | TCGA-BK-A0C9-01 | Endometrium | uterine corpus endometrioid carcinoma | Female | <65 | I/II | Unknown | Unknown | SD |
| Page: 1 2 3 |
Top |
Related drugs of malignant transformation related genes |
| Identification of chemicals and drugs interact with genes involved in malignant transfromation |
| (DGIdb 4.0) |
| Entrez ID | Symbol | Category | Interaction Types | Drug Claim Name | Drug Name | PMIDs |
| Page: 1 |

Copyright 2023-Present -The University of Texas Health Science Center at Houston |