
|
|||||
|
 | |
| |
| |
| |
| |
| |
|
Gene: YIF1A |
Gene summary for YIF1A |
| Gene information | Species | Human | Gene symbol | YIF1A | Gene ID | 10897 |
| Gene name | Yip1 interacting factor homolog A, membrane trafficking protein | |
| Gene Alias | 54TM | |
| Cytomap | 11q13.2 | |
| Gene Type | protein-coding | GO ID | GO:0006810 | UniProtAcc | A6NGW1 |
Top |
Malignant transformation analysis |
| Identification of the aberrant gene expression in precancerous and cancerous lesions by comparing the gene expression of stem-like cells in diseased tissues with normal stem cells |
| Entrez ID | Symbol | Replicates | Species | Organ | Tissue | Adj P-value | Log2FC | Malignancy |
| 10897 | YIF1A | GSM4909282 | Human | Breast | IDC | 3.87e-02 | 2.64e-01 | -0.0288 |
| 10897 | YIF1A | GSM4909285 | Human | Breast | IDC | 6.27e-08 | 3.68e-01 | 0.21 |
| 10897 | YIF1A | GSM4909290 | Human | Breast | IDC | 4.34e-05 | 3.90e-01 | 0.2096 |
| 10897 | YIF1A | GSM4909296 | Human | Breast | IDC | 1.02e-13 | 3.79e-01 | 0.1524 |
| 10897 | YIF1A | GSM4909297 | Human | Breast | IDC | 6.76e-06 | -7.14e-02 | 0.1517 |
| 10897 | YIF1A | GSM4909301 | Human | Breast | IDC | 7.73e-07 | 2.42e-01 | 0.1577 |
| 10897 | YIF1A | GSM4909304 | Human | Breast | IDC | 8.22e-22 | 6.09e-01 | 0.1636 |
| 10897 | YIF1A | GSM4909307 | Human | Breast | IDC | 1.45e-03 | 2.89e-01 | 0.1569 |
| 10897 | YIF1A | GSM4909308 | Human | Breast | IDC | 5.86e-11 | 4.50e-01 | 0.158 |
| 10897 | YIF1A | GSM4909311 | Human | Breast | IDC | 1.07e-25 | -1.84e-03 | 0.1534 |
| 10897 | YIF1A | GSM4909312 | Human | Breast | IDC | 1.35e-26 | 5.40e-01 | 0.1552 |
| 10897 | YIF1A | GSM4909315 | Human | Breast | IDC | 1.07e-04 | 3.41e-01 | 0.21 |
| 10897 | YIF1A | GSM4909316 | Human | Breast | IDC | 4.59e-04 | 2.83e-01 | 0.21 |
| 10897 | YIF1A | GSM4909317 | Human | Breast | IDC | 2.65e-05 | 3.53e-01 | 0.1355 |
| 10897 | YIF1A | GSM4909319 | Human | Breast | IDC | 6.72e-28 | -3.53e-02 | 0.1563 |
| 10897 | YIF1A | GSM4909320 | Human | Breast | IDC | 4.51e-10 | 3.61e-01 | 0.1575 |
| 10897 | YIF1A | GSM4909321 | Human | Breast | IDC | 5.54e-15 | 2.18e-01 | 0.1559 |
| 10897 | YIF1A | brca1 | Human | Breast | Precancer | 2.35e-16 | 5.48e-01 | -0.0338 |
| 10897 | YIF1A | brca2 | Human | Breast | Precancer | 3.27e-09 | 3.51e-01 | -0.024 |
| 10897 | YIF1A | brca3 | Human | Breast | Precancer | 9.80e-07 | 2.77e-01 | -0.0263 |
| Page: 1 2 3 4 5 6 7 8 9 10 11 |
| Tissue | Expression Dynamics | Abbreviation |
| Breast |  | IDC: Invasive ductal carcinoma |
| DCIS: Ductal carcinoma in situ | ||
| Precancer(BRCA1-mut): Precancerous lesion from BRCA1 mutation carriers | ||
| Colorectum (GSE201348) |  | FAP: Familial adenomatous polyposis |
| CRC: Colorectal cancer | ||
| Colorectum (HTA11) | 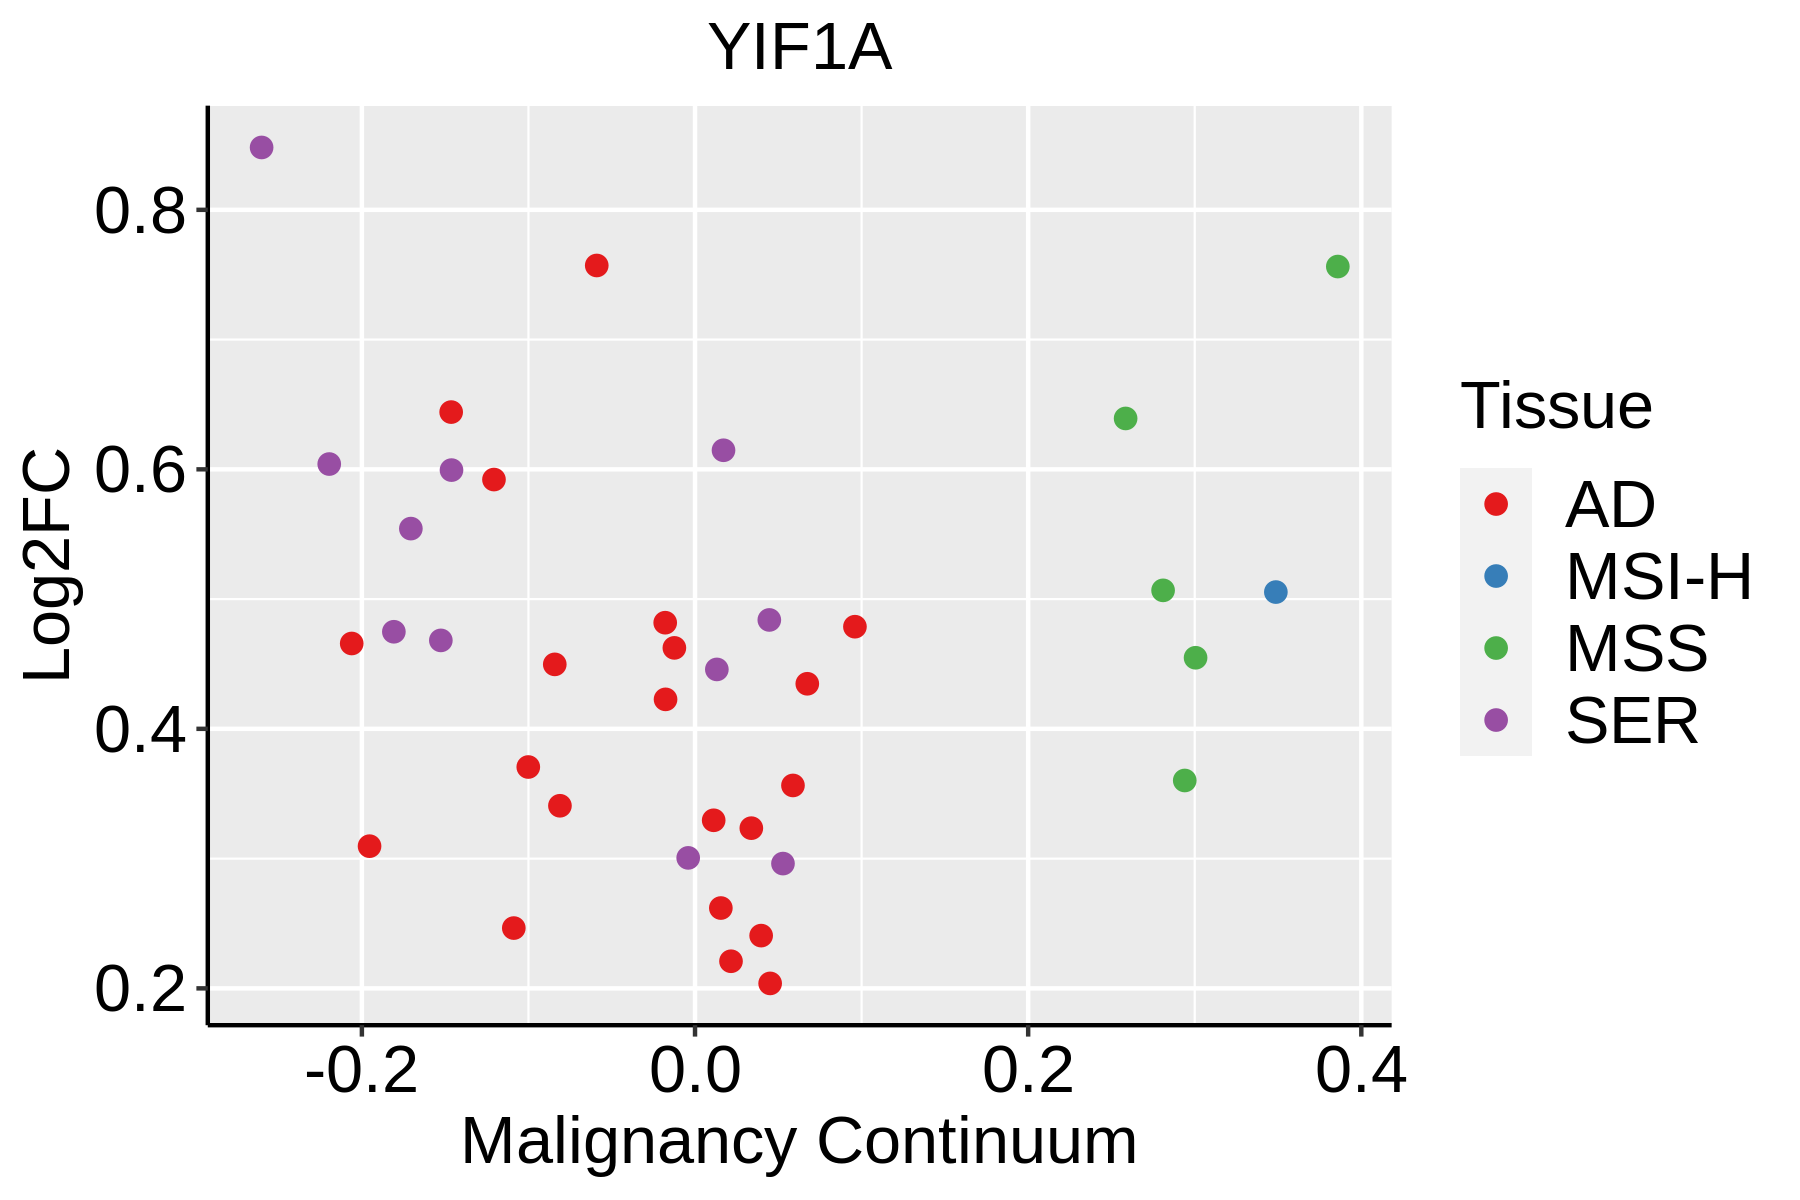 | AD: Adenomas |
| SER: Sessile serrated lesions | ||
| MSI-H: Microsatellite-high colorectal cancer | ||
| MSS: Microsatellite stable colorectal cancer | ||
| Endometrium | 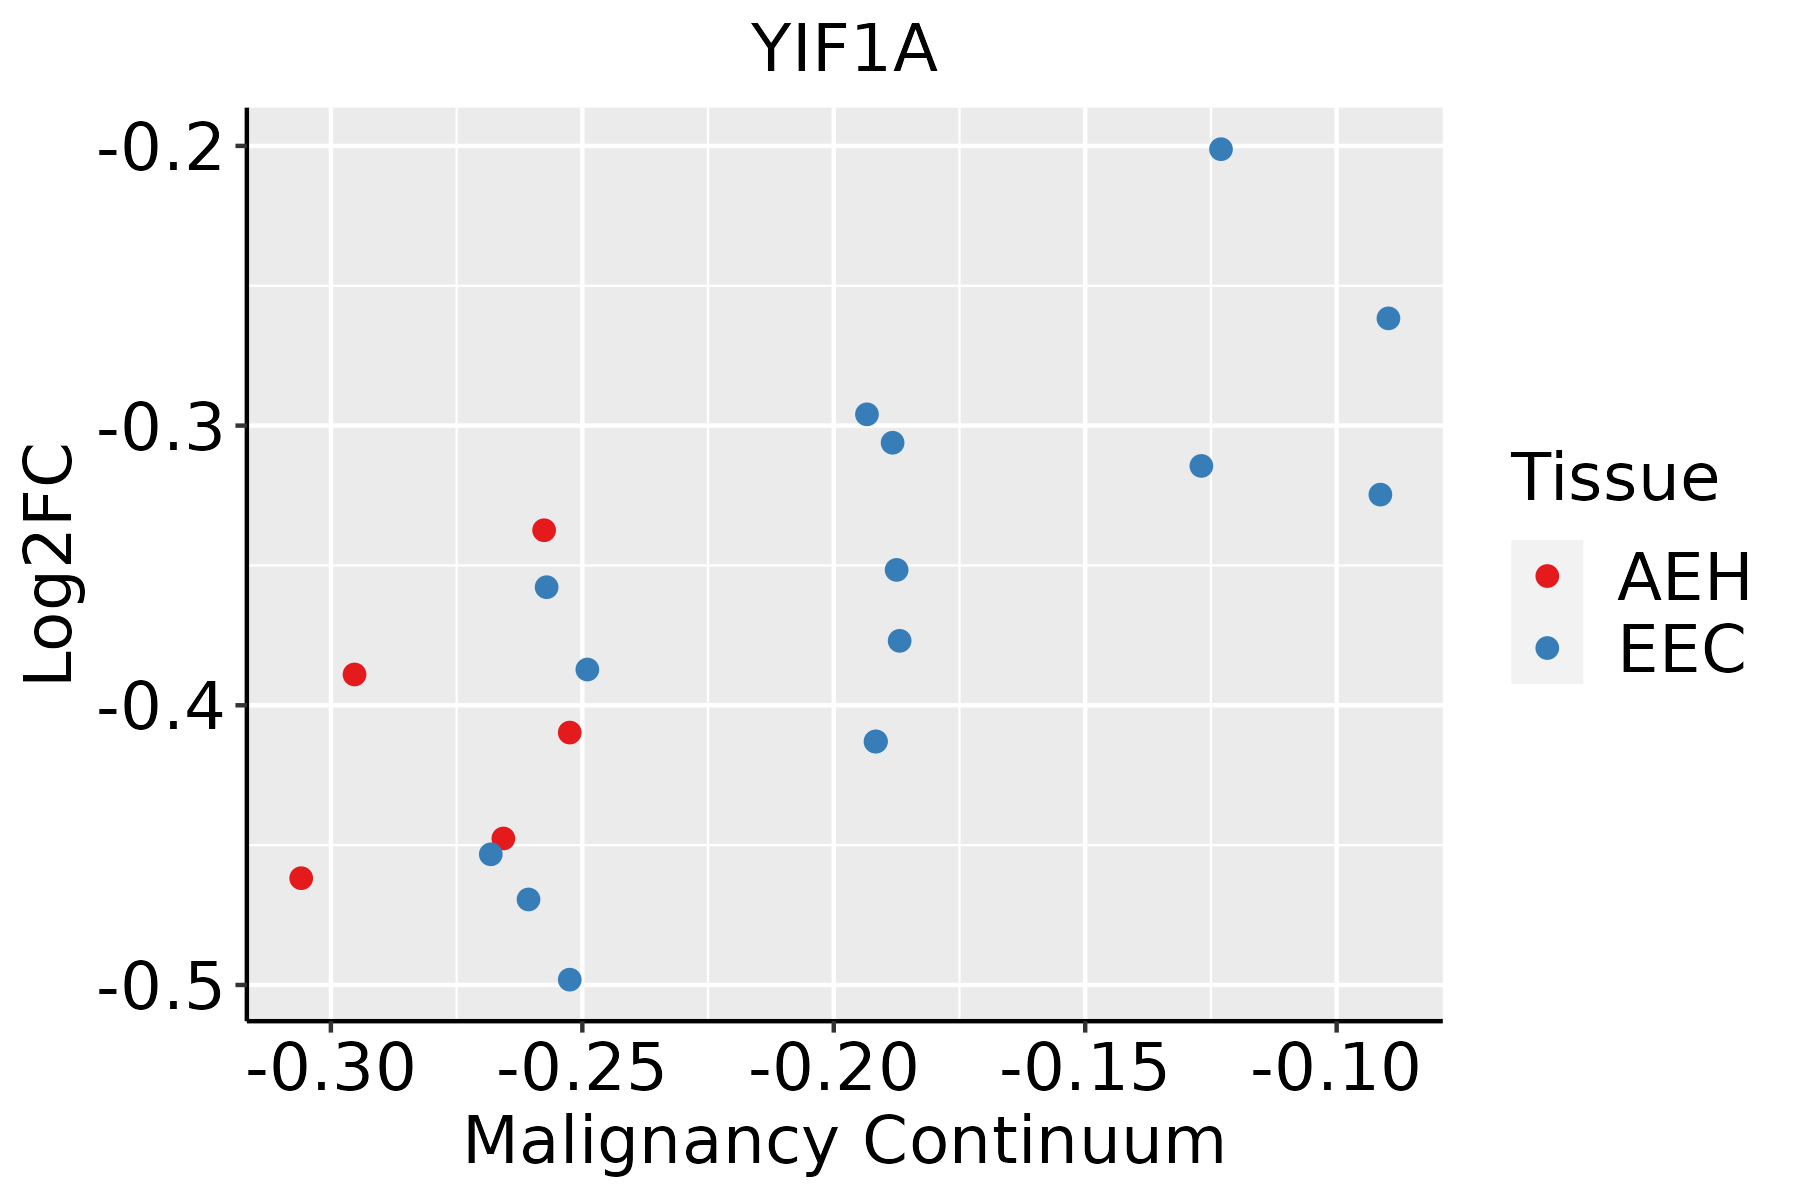 | AEH: Atypical endometrial hyperplasia |
| EEC: Endometrioid Cancer | ||
| Esophagus | 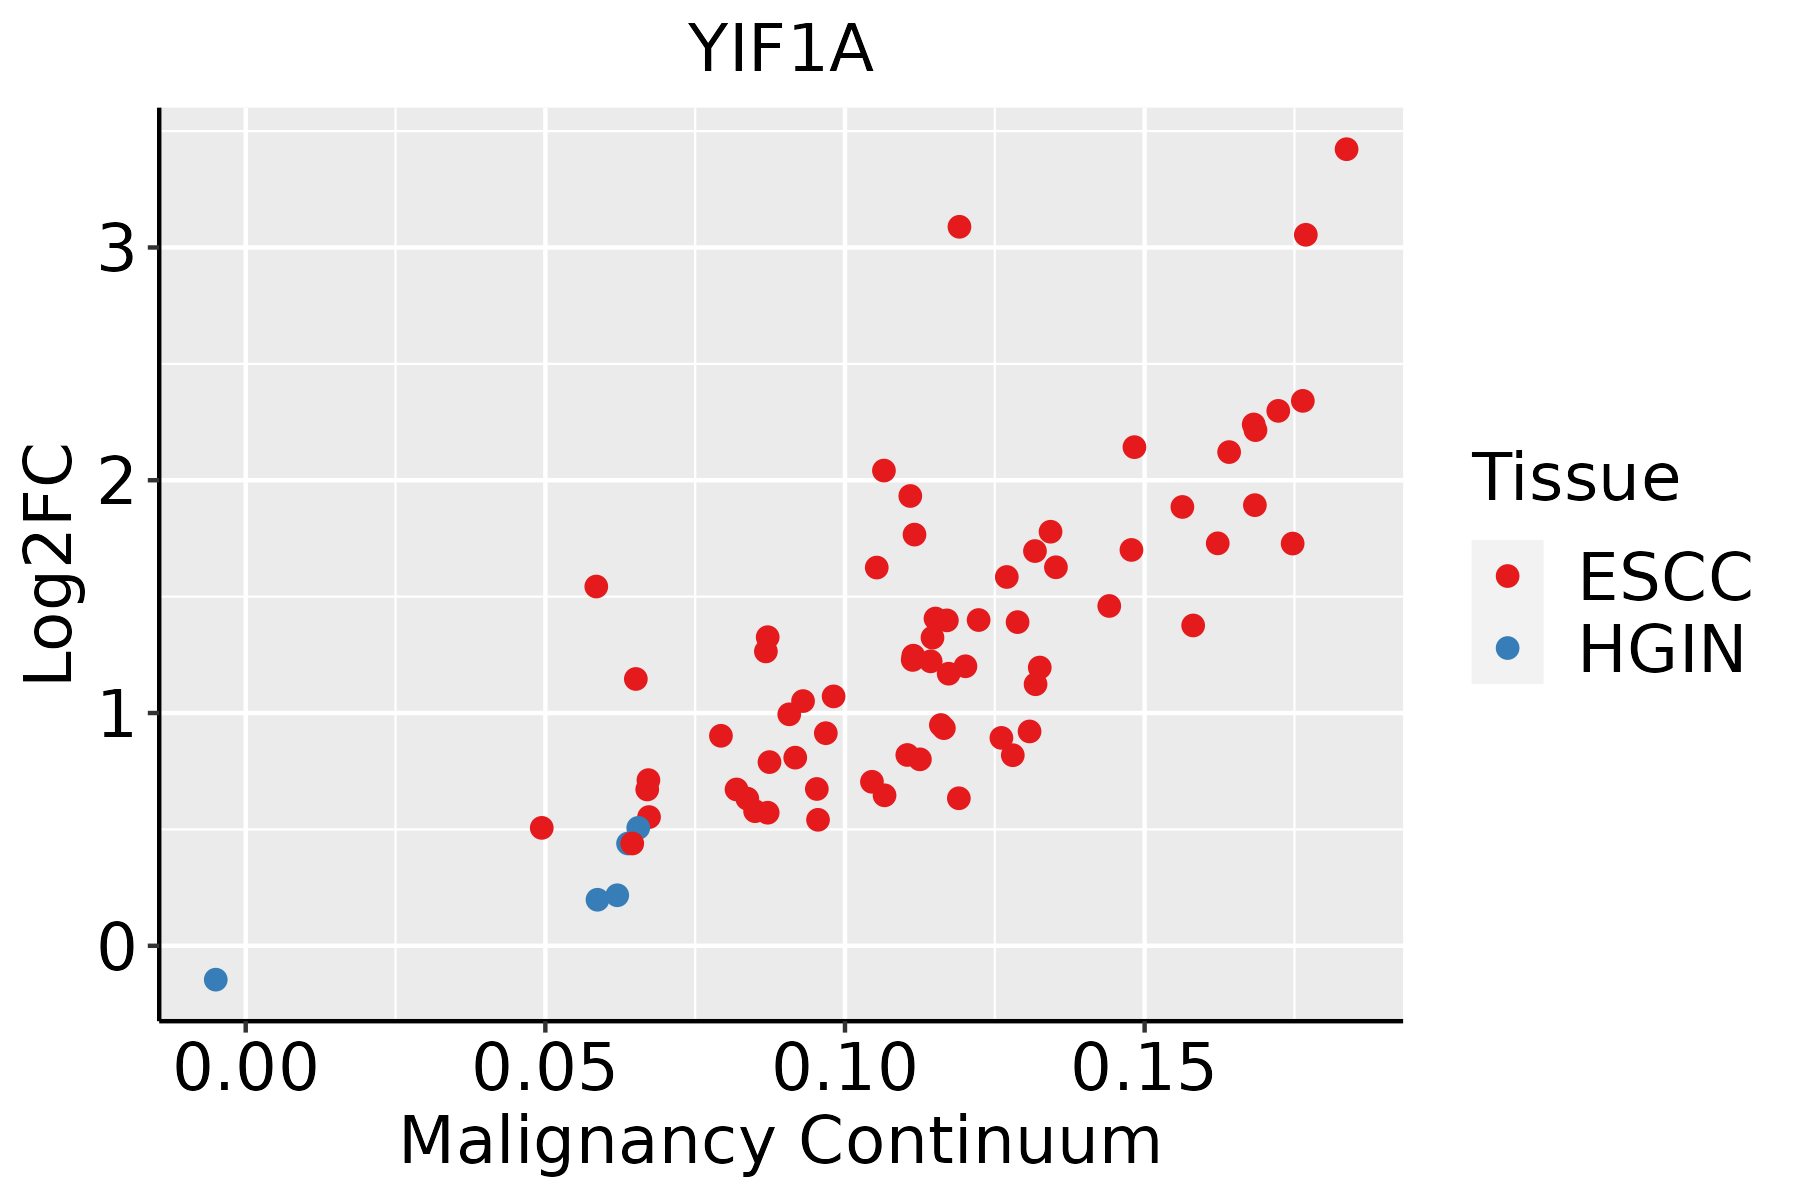 | ESCC: Esophageal squamous cell carcinoma |
| HGIN: High-grade intraepithelial neoplasias | ||
| LGIN: Low-grade intraepithelial neoplasias | ||
| Liver | 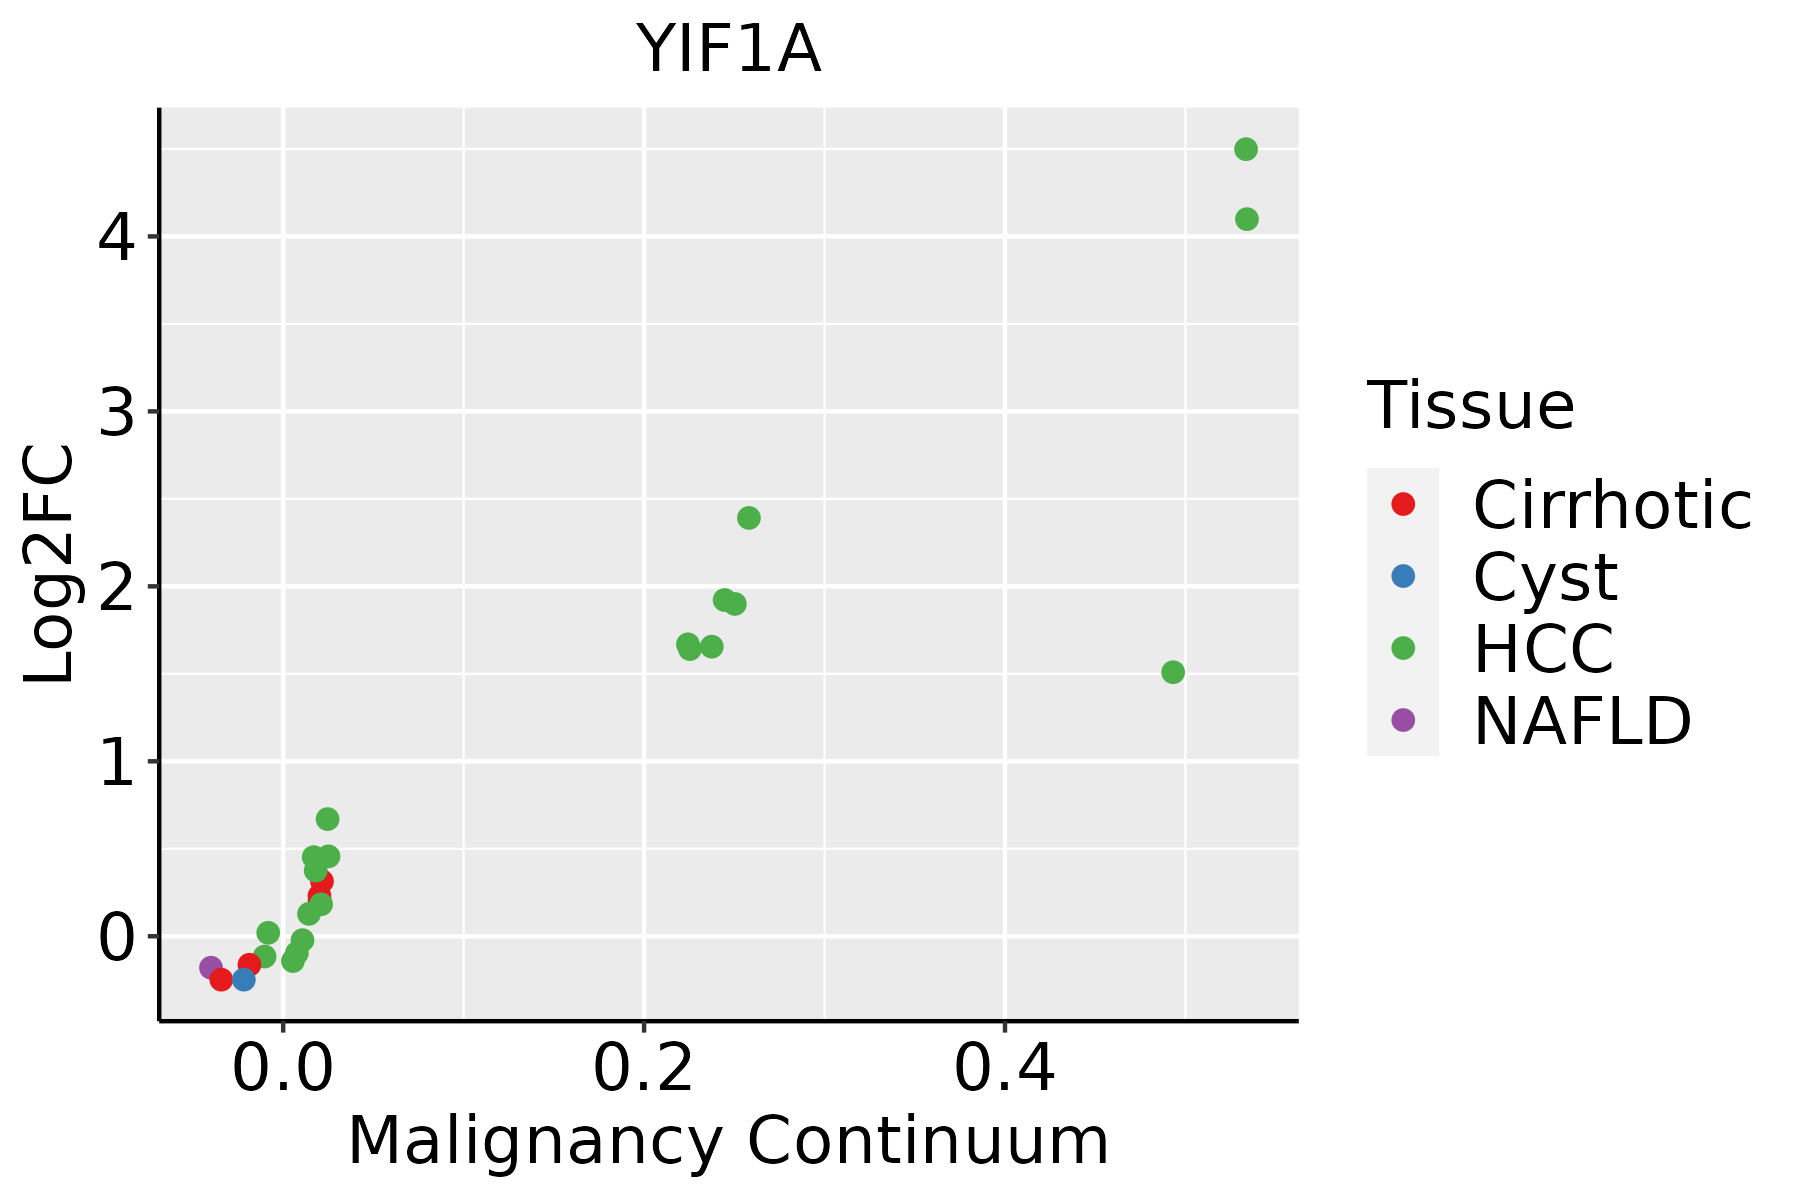 | HCC: Hepatocellular carcinoma |
| NAFLD: Non-alcoholic fatty liver disease | ||
| Oral Cavity | 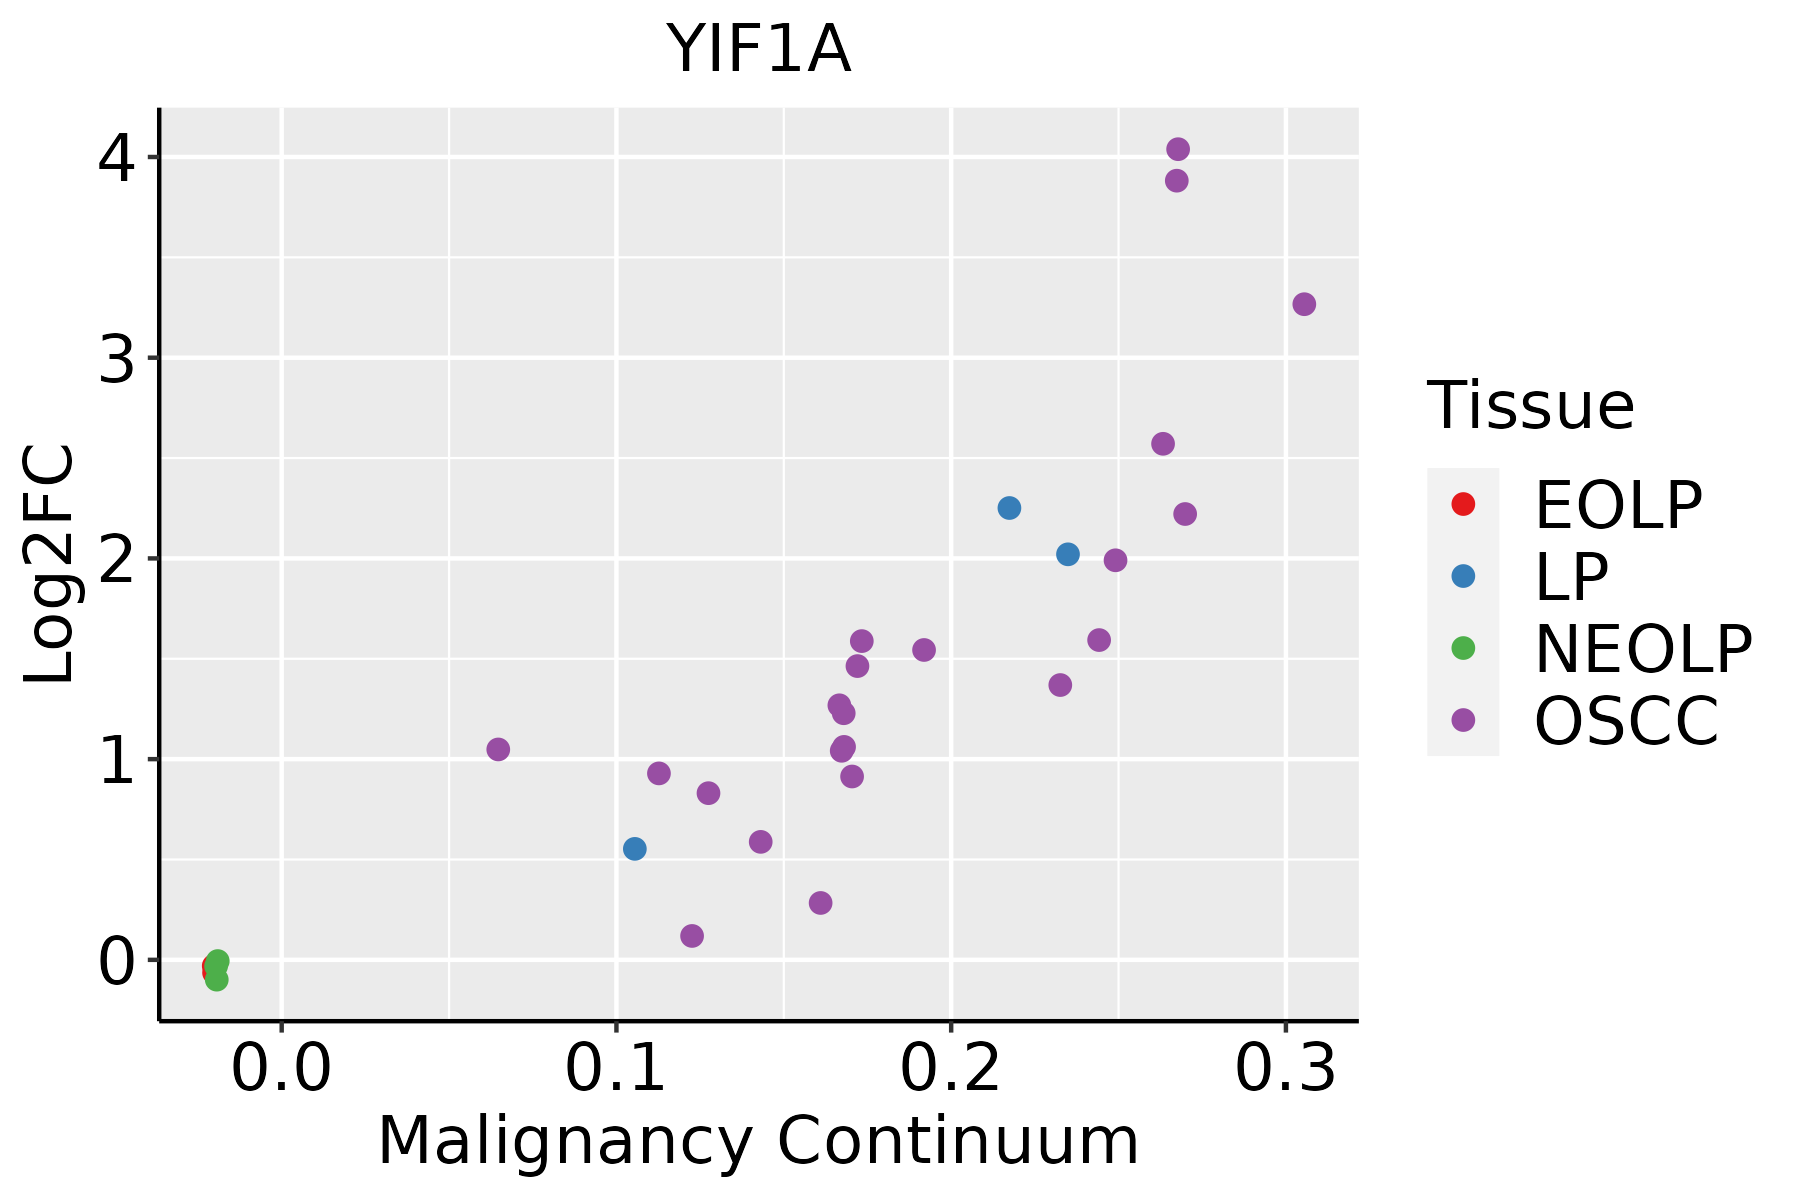 | EOLP: Erosive Oral lichen planus |
| LP: leukoplakia | ||
| NEOLP: Non-erosive oral lichen planus | ||
| OSCC: Oral squamous cell carcinoma | ||
| Prostate | 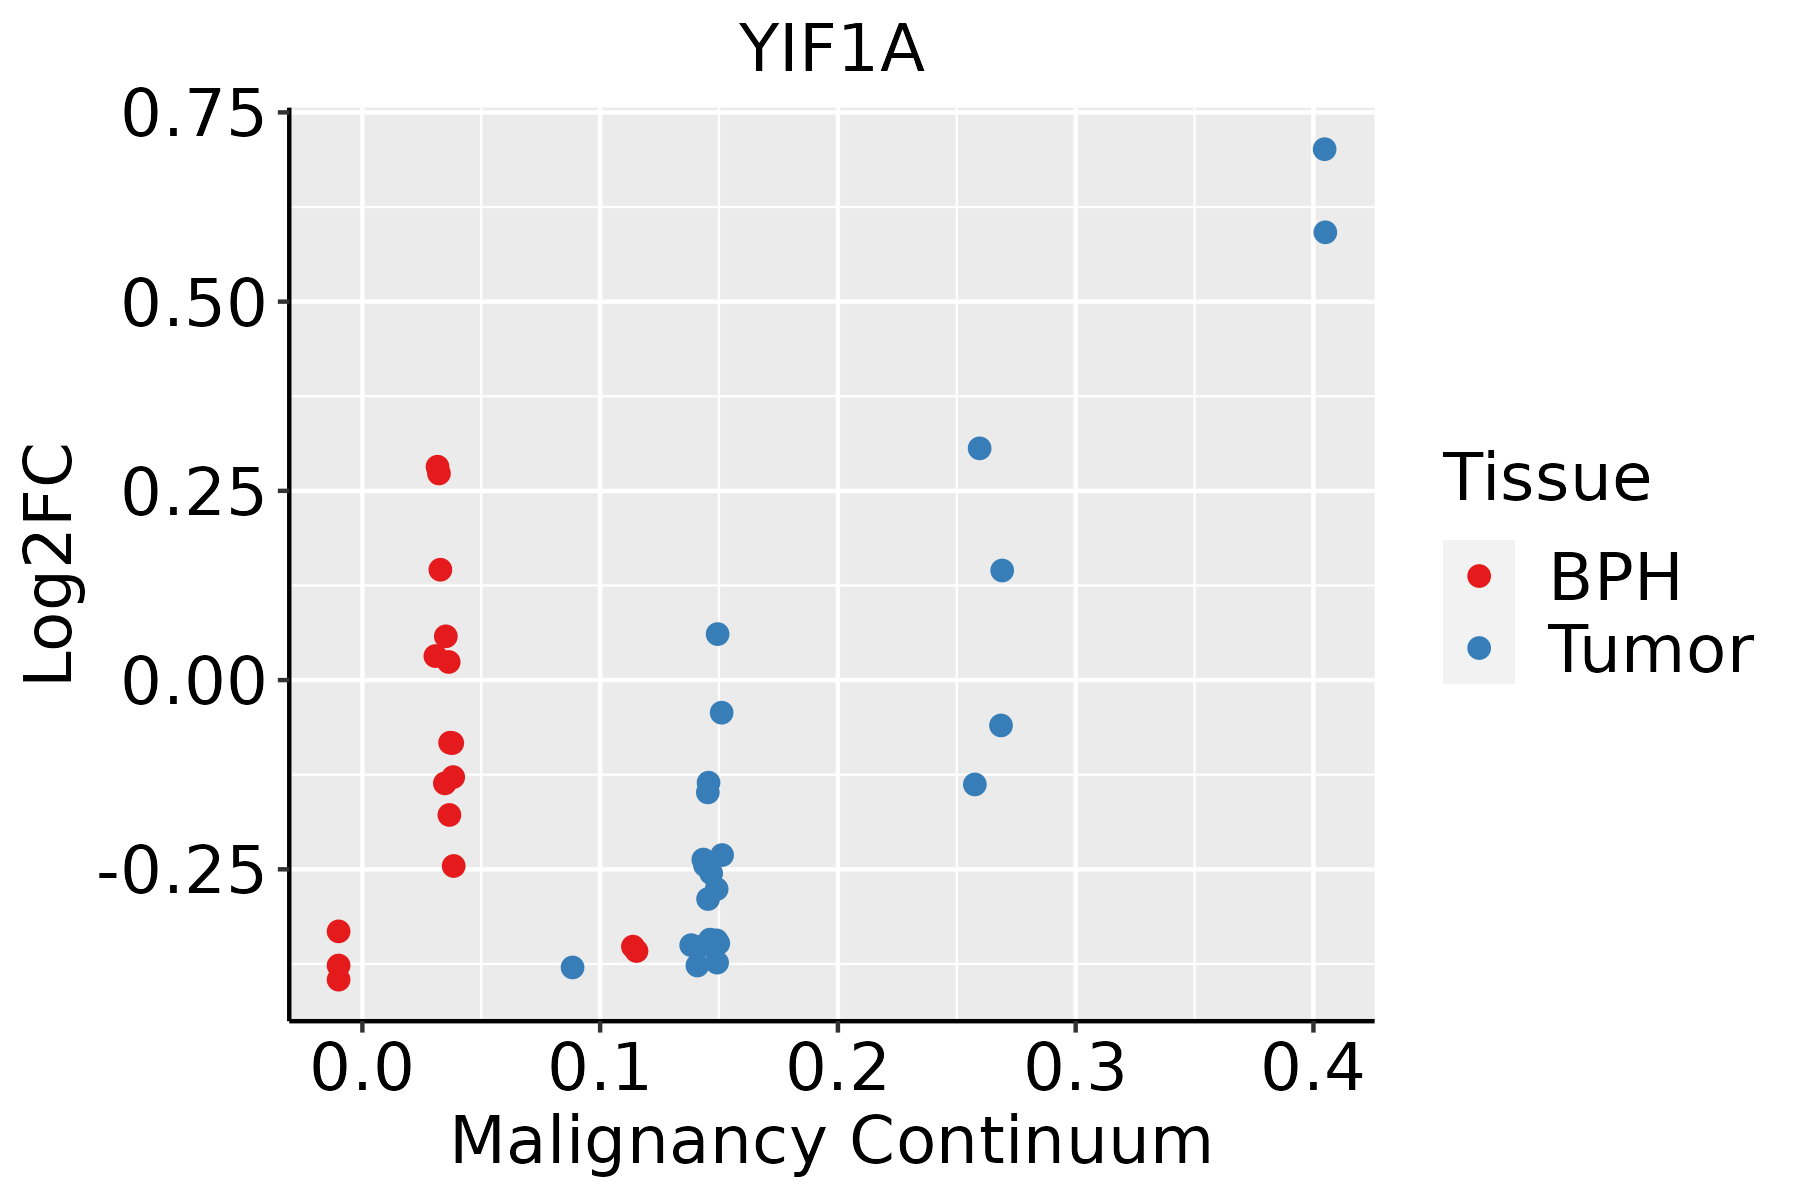 | BPH: Benign Prostatic Hyperplasia |
| Skin | 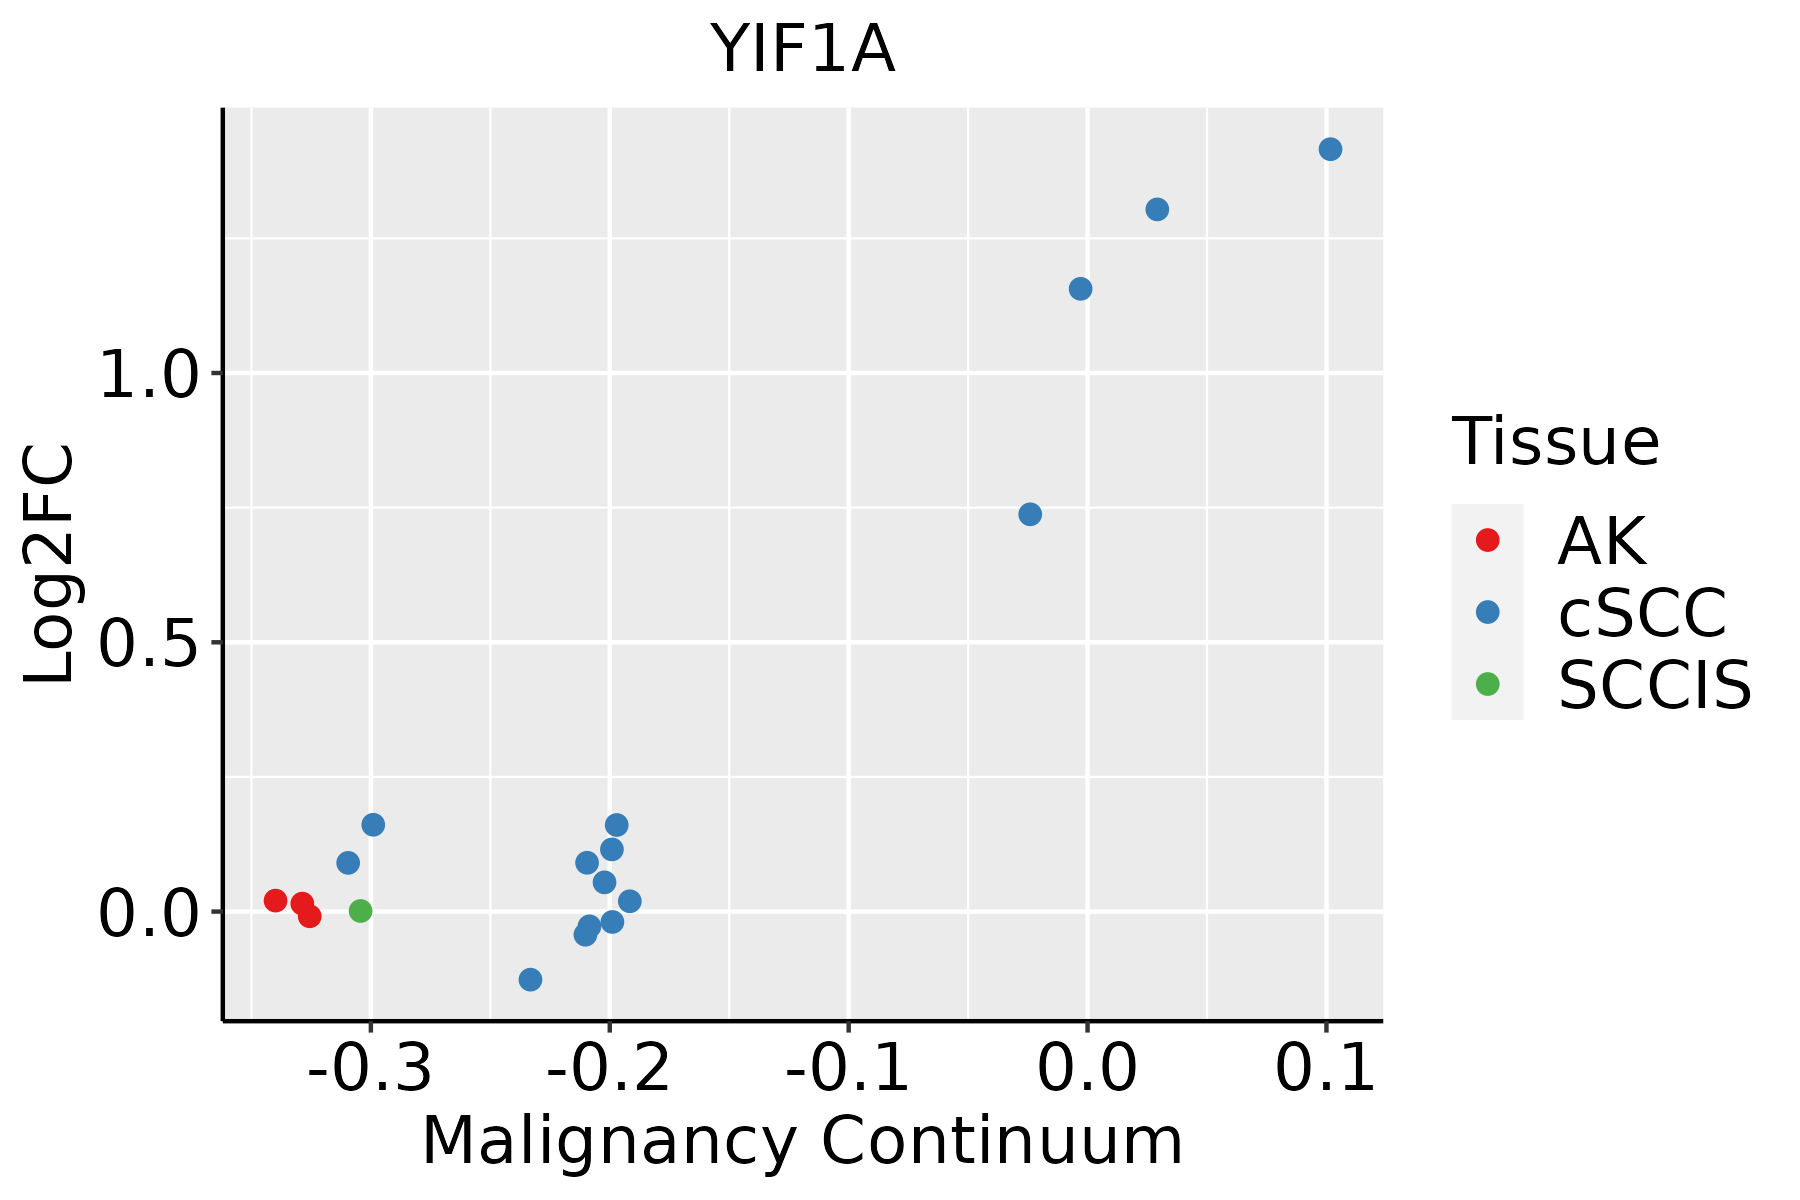 | AK: Actinic keratosis |
| cSCC: Cutaneous squamous cell carcinoma | ||
| SCCIS:squamous cell carcinoma in situ | ||
| Thyroid |  | ATC: Anaplastic thyroid cancer |
| HT: Hashimoto's thyroiditis | ||
| PTC: Papillary thyroid cancer |
| ∗log2FC in expression of this searched gene in stem-like cells from each diseased tissue sample relative to stem-like cells in normal samples in each tissue plotted against the malignancy continuum. Samples are colored based on if they are from different disease stage. |
Top |
Malignant transformation related pathway analysis |
| Find out the enriched GO biological processes and KEGG pathways involved in transition from healthy to precancer to cancer |
| Tissue | Disease Stage | Enriched GO biological Processes |
| Colorectum | AD |  |
| Colorectum | SER |  |
| Colorectum | MSS |  |
| Colorectum | MSI-H |  |
| Colorectum | FAP |  |
| ∗Top 15 enriched GO BP terms are showed in the bar plot of each disease state in each tissue. Each row represents a significant GO biological process which is colored according to the -log10(p.adjust). |
| Page: 1 2 3 4 5 6 7 8 9 |
| GO ID | Tissue | Disease Stage | Description | Gene Ratio | Bg Ratio | pvalue | p.adjust | Count |
| GO:0048193 | Colorectum | AD | Golgi vesicle transport | 109/3918 | 296/18723 | 1.80e-10 | 1.68e-08 | 109 |
| GO:0006888 | Colorectum | AD | endoplasmic reticulum to Golgi vesicle-mediated transport | 44/3918 | 130/18723 | 4.13e-04 | 4.68e-03 | 44 |
| GO:00481931 | Colorectum | SER | Golgi vesicle transport | 79/2897 | 296/18723 | 4.20e-07 | 2.15e-05 | 79 |
| GO:00068881 | Colorectum | SER | endoplasmic reticulum to Golgi vesicle-mediated transport | 34/2897 | 130/18723 | 1.13e-03 | 1.29e-02 | 34 |
| GO:00481932 | Colorectum | MSS | Golgi vesicle transport | 101/3467 | 296/18723 | 9.09e-11 | 9.77e-09 | 101 |
| GO:00068882 | Colorectum | MSS | endoplasmic reticulum to Golgi vesicle-mediated transport | 44/3467 | 130/18723 | 2.17e-05 | 4.60e-04 | 44 |
| GO:00068883 | Colorectum | MSI-H | endoplasmic reticulum to Golgi vesicle-mediated transport | 22/1319 | 130/18723 | 1.05e-04 | 3.24e-03 | 22 |
| GO:00481933 | Colorectum | MSI-H | Golgi vesicle transport | 39/1319 | 296/18723 | 1.17e-04 | 3.51e-03 | 39 |
| GO:00481939 | Endometrium | AEH | Golgi vesicle transport | 60/2100 | 296/18723 | 3.65e-06 | 9.79e-05 | 60 |
| GO:00068886 | Endometrium | AEH | endoplasmic reticulum to Golgi vesicle-mediated transport | 29/2100 | 130/18723 | 2.11e-04 | 2.59e-03 | 29 |
| GO:004819313 | Endometrium | EEC | Golgi vesicle transport | 60/2168 | 296/18723 | 9.91e-06 | 2.17e-04 | 60 |
| GO:000688812 | Endometrium | EEC | endoplasmic reticulum to Golgi vesicle-mediated transport | 29/2168 | 130/18723 | 3.63e-04 | 3.95e-03 | 29 |
| GO:004819318 | Esophagus | ESCC | Golgi vesicle transport | 231/8552 | 296/18723 | 1.82e-30 | 9.63e-28 | 231 |
| GO:000688815 | Esophagus | ESCC | endoplasmic reticulum to Golgi vesicle-mediated transport | 102/8552 | 130/18723 | 1.73e-14 | 9.22e-13 | 102 |
| GO:004819311 | Liver | Cirrhotic | Golgi vesicle transport | 153/4634 | 296/18723 | 1.02e-23 | 6.43e-21 | 153 |
| GO:000688811 | Liver | Cirrhotic | endoplasmic reticulum to Golgi vesicle-mediated transport | 77/4634 | 130/18723 | 5.78e-17 | 7.56e-15 | 77 |
| GO:004819321 | Liver | HCC | Golgi vesicle transport | 217/7958 | 296/18723 | 2.58e-27 | 1.02e-24 | 217 |
| GO:000688821 | Liver | HCC | endoplasmic reticulum to Golgi vesicle-mediated transport | 100/7958 | 130/18723 | 1.15e-15 | 8.67e-14 | 100 |
| GO:004819315 | Oral cavity | OSCC | Golgi vesicle transport | 209/7305 | 296/18723 | 1.39e-28 | 6.30e-26 | 209 |
| GO:00068888 | Oral cavity | OSCC | endoplasmic reticulum to Golgi vesicle-mediated transport | 97/7305 | 130/18723 | 1.42e-16 | 1.15e-14 | 97 |
| Page: 1 2 |
| Pathway ID | Tissue | Disease Stage | Description | Gene Ratio | Bg Ratio | pvalue | p.adjust | qvalue | Count |
| Page: 1 |
Top |
Cell-cell communication analysis |
| Identification of potential cell-cell interactions between two cell types and their ligand-receptor pairs for different disease states |
| Ligand | Receptor | LRpair | Pathway | Tissue | Disease Stage |
| Page: 1 |
Top |
Single-cell gene regulatory network inference analysis |
| Find out the significant the regulons (TFs) and the target genes of each regulon across cell types for different disease states |
| TF | Cell Type | Tissue | Disease Stage | Target Gene | RSS | Regulon Activity |
| ∗The dot plots of a searched regulon are shown for all cell subpopulations in each disease state of each tissue based on the regulon specific score inferred using pySCENIC and by calculating the average expression. |
| Page: 1 |
Top |
Somatic mutation of malignant transformation related genes |
| Annotation of somatic variants for genes involved in malignant transformation |
| Hugo Symbol | Variant Class | Variant Classification | dbSNP RS | HGVSc | HGVSp | HGVSp Short | SWISSPROT | BIOTYPE | SIFT | PolyPhen | Tumor Sample Barcode | Tissue | Histology | Sex | Age | Stage | Therapy Types | Drugs | Outcome |
| YIF1A | SNV | Missense_Mutation | novel | c.645G>T | p.Met215Ile | p.M215I | O95070 | protein_coding | deleterious(0.05) | benign(0.124) | TCGA-AC-A23H-01 | Breast | breast invasive carcinoma | Female | >=65 | I/II | Unknown | Unknown | PD |
| YIF1A | SNV | Missense_Mutation | c.91N>A | p.Gly31Ser | p.G31S | O95070 | protein_coding | tolerated(1) | benign(0.015) | TCGA-BH-A0HQ-01 | Breast | breast invasive carcinoma | Female | <65 | I/II | Hormone Therapy | arimidex | SD | |
| YIF1A | insertion | Nonsense_Mutation | novel | c.319_320insTATAAACCATACTGTAGGA | p.Gly107ValfsTer2 | p.G107Vfs*2 | O95070 | protein_coding | TCGA-B6-A0IK-01 | Breast | breast invasive carcinoma | Female | <65 | III/IV | Unknown | Unknown | PD | ||
| YIF1A | SNV | Missense_Mutation | c.359N>C | p.Val120Ala | p.V120A | O95070 | protein_coding | deleterious(0) | benign(0.202) | TCGA-A6-5665-01 | Colorectum | colon adenocarcinoma | Female | >=65 | I/II | Unknown | Unknown | PD | |
| YIF1A | SNV | Missense_Mutation | rs774658648 | c.139N>A | p.Val47Met | p.V47M | O95070 | protein_coding | tolerated(0.19) | benign(0.018) | TCGA-AA-3984-01 | Colorectum | colon adenocarcinoma | Female | <65 | I/II | Unknown | Unknown | SD |
| YIF1A | SNV | Missense_Mutation | rs763786305 | c.740N>A | p.Arg247His | p.R247H | O95070 | protein_coding | deleterious(0) | probably_damaging(0.996) | TCGA-AZ-6601-01 | Colorectum | colon adenocarcinoma | Male | >=65 | I/II | Unknown | Unknown | PD |
| YIF1A | SNV | Missense_Mutation | rs753567512 | c.716N>T | p.Ser239Leu | p.S239L | O95070 | protein_coding | tolerated(0.95) | benign(0.007) | TCGA-F4-6570-01 | Colorectum | colon adenocarcinoma | Female | >=65 | I/II | Unknown | Unknown | SD |
| YIF1A | SNV | Missense_Mutation | rs141955007 | c.586N>T | p.Arg196Cys | p.R196C | O95070 | protein_coding | deleterious(0.03) | probably_damaging(0.915) | TCGA-NH-A5IV-01 | Colorectum | colon adenocarcinoma | Female | >=65 | I/II | Unknown | Unknown | SD |
| YIF1A | SNV | Missense_Mutation | rs759439307 | c.800G>A | p.Arg267His | p.R267H | O95070 | protein_coding | tolerated(0.1) | benign(0.009) | TCGA-EI-6507-01 | Colorectum | rectum adenocarcinoma | Male | <65 | I/II | Unknown | Unknown | SD |
| YIF1A | insertion | Frame_Shift_Ins | rs778111726 | c.285dupT | p.Ala96CysfsTer30 | p.A96Cfs*30 | O95070 | protein_coding | TCGA-AZ-4615-01 | Colorectum | colon adenocarcinoma | Male | >=65 | III/IV | Chemotherapy | xeloda | PD |
| Page: 1 2 3 |
Top |
Related drugs of malignant transformation related genes |
| Identification of chemicals and drugs interact with genes involved in malignant transfromation |
| (DGIdb 4.0) |
| Entrez ID | Symbol | Category | Interaction Types | Drug Claim Name | Drug Name | PMIDs |
| Page: 1 |

Copyright 2023-Present -The University of Texas Health Science Center at Houston |