
|
|||||
|
 | |
| |
| |
| |
| |
| |
|
Gene: YEATS4 |
Gene summary for YEATS4 |
| Gene information | Species | Human | Gene symbol | YEATS4 | Gene ID | 8089 |
| Gene name | YEATS domain containing 4 | |
| Gene Alias | 4930573H17Rik | |
| Cytomap | 12q15 | |
| Gene Type | protein-coding | GO ID | GO:0000278 | UniProtAcc | F8W0J4 |
Top |
Malignant transformation analysis |
| Identification of the aberrant gene expression in precancerous and cancerous lesions by comparing the gene expression of stem-like cells in diseased tissues with normal stem cells |
| Entrez ID | Symbol | Replicates | Species | Organ | Tissue | Adj P-value | Log2FC | Malignancy |
| 8089 | YEATS4 | LZE4T | Human | Esophagus | ESCC | 9.73e-15 | 4.31e-01 | 0.0811 |
| 8089 | YEATS4 | LZE7T | Human | Esophagus | ESCC | 1.96e-02 | 4.59e-01 | 0.0667 |
| 8089 | YEATS4 | LZE8T | Human | Esophagus | ESCC | 2.02e-03 | 1.57e-01 | 0.067 |
| 8089 | YEATS4 | LZE20T | Human | Esophagus | ESCC | 6.42e-07 | 1.11e-01 | 0.0662 |
| 8089 | YEATS4 | LZE24T | Human | Esophagus | ESCC | 6.57e-09 | 2.60e-01 | 0.0596 |
| 8089 | YEATS4 | LZE6T | Human | Esophagus | ESCC | 7.41e-07 | 2.79e-01 | 0.0845 |
| 8089 | YEATS4 | P1T-E | Human | Esophagus | ESCC | 3.24e-07 | 4.34e-01 | 0.0875 |
| 8089 | YEATS4 | P2T-E | Human | Esophagus | ESCC | 3.12e-47 | 1.02e+00 | 0.1177 |
| 8089 | YEATS4 | P4T-E | Human | Esophagus | ESCC | 2.35e-19 | 5.09e-01 | 0.1323 |
| 8089 | YEATS4 | P5T-E | Human | Esophagus | ESCC | 3.77e-09 | 2.78e-01 | 0.1327 |
| 8089 | YEATS4 | P8T-E | Human | Esophagus | ESCC | 5.75e-18 | 4.29e-01 | 0.0889 |
| 8089 | YEATS4 | P9T-E | Human | Esophagus | ESCC | 3.60e-07 | 1.83e-01 | 0.1131 |
| 8089 | YEATS4 | P10T-E | Human | Esophagus | ESCC | 6.97e-27 | 4.64e-01 | 0.116 |
| 8089 | YEATS4 | P11T-E | Human | Esophagus | ESCC | 5.06e-04 | 3.26e-01 | 0.1426 |
| 8089 | YEATS4 | P12T-E | Human | Esophagus | ESCC | 1.83e-29 | 6.57e-01 | 0.1122 |
| 8089 | YEATS4 | P15T-E | Human | Esophagus | ESCC | 2.24e-05 | 1.49e-01 | 0.1149 |
| 8089 | YEATS4 | P16T-E | Human | Esophagus | ESCC | 1.79e-18 | 3.75e-01 | 0.1153 |
| 8089 | YEATS4 | P17T-E | Human | Esophagus | ESCC | 2.96e-04 | 1.46e-01 | 0.1278 |
| 8089 | YEATS4 | P19T-E | Human | Esophagus | ESCC | 9.66e-03 | 3.29e-01 | 0.1662 |
| 8089 | YEATS4 | P20T-E | Human | Esophagus | ESCC | 1.96e-08 | 2.43e-01 | 0.1124 |
| Page: 1 2 3 4 5 6 |
| Tissue | Expression Dynamics | Abbreviation |
| Esophagus | 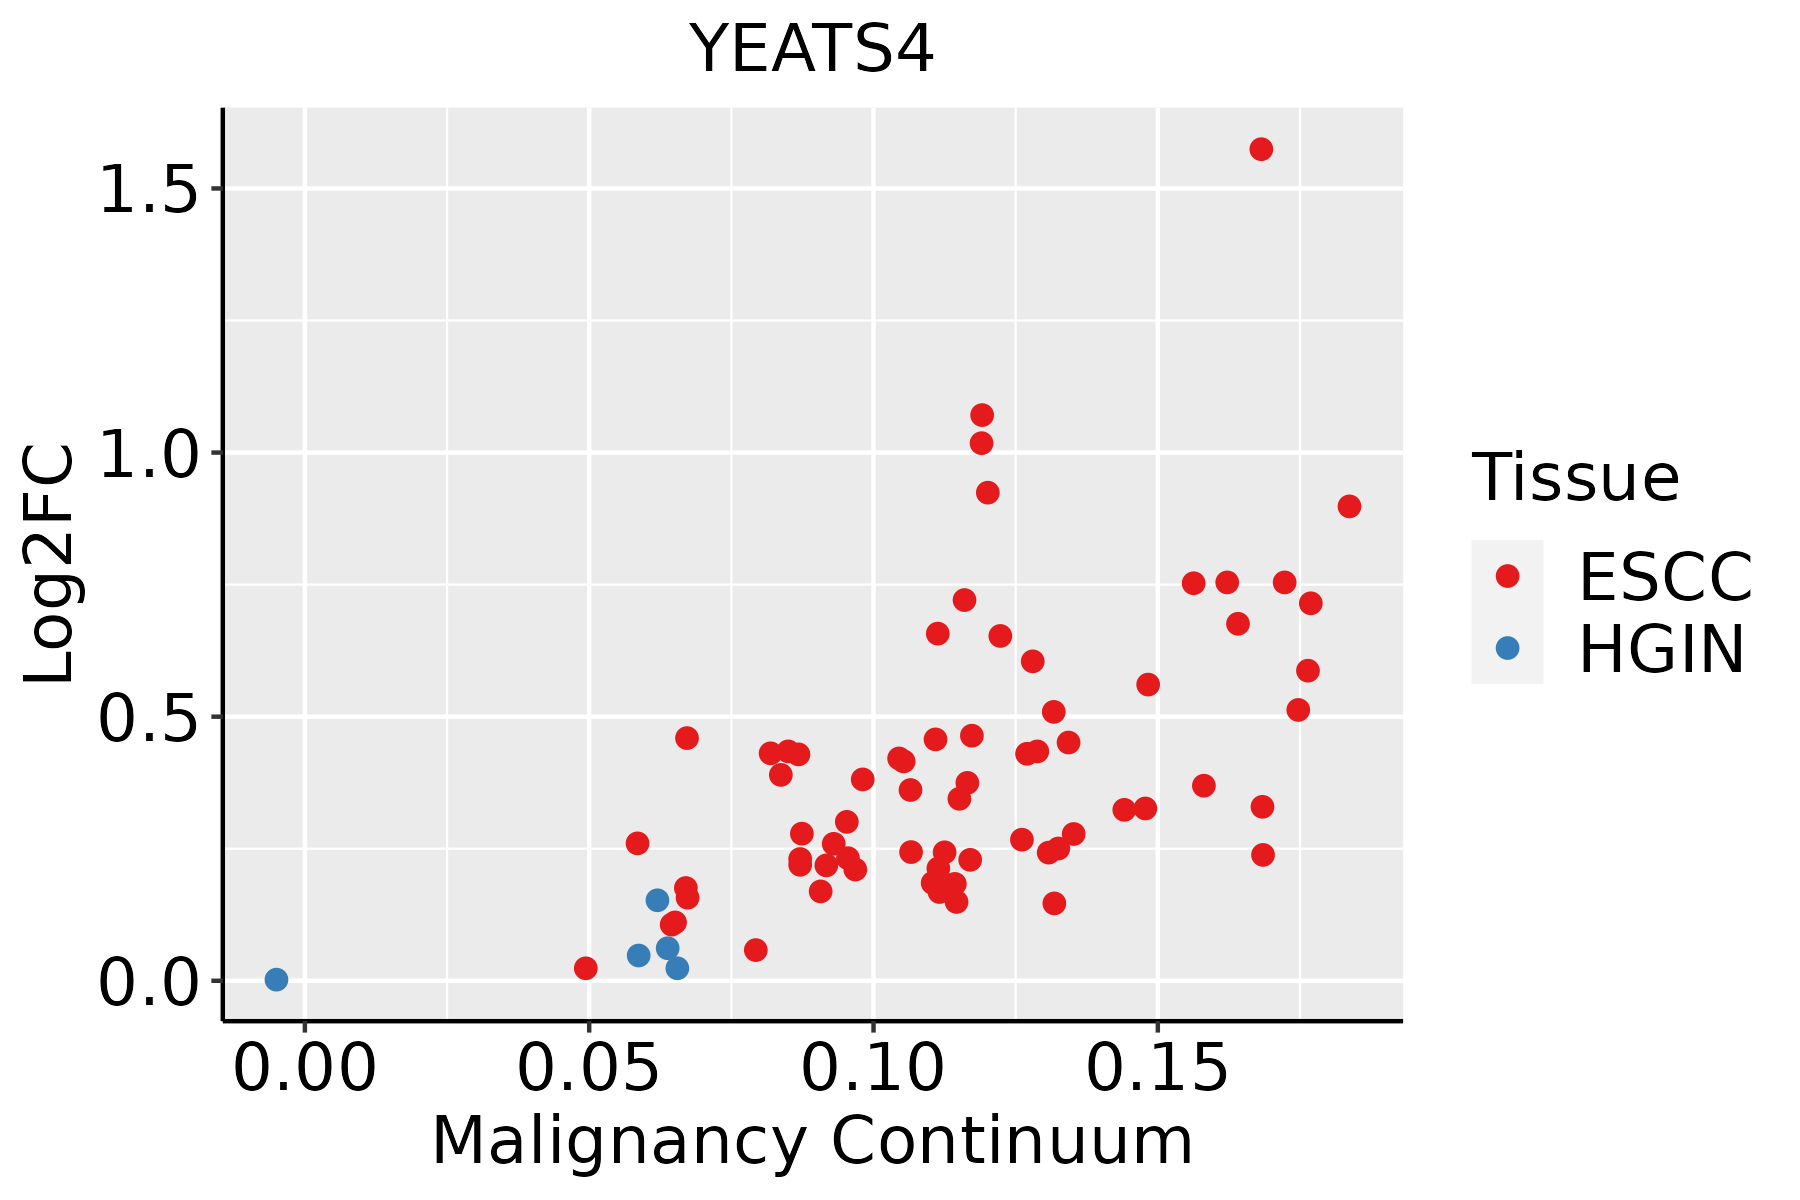 | ESCC: Esophageal squamous cell carcinoma |
| HGIN: High-grade intraepithelial neoplasias | ||
| LGIN: Low-grade intraepithelial neoplasias | ||
| Liver | 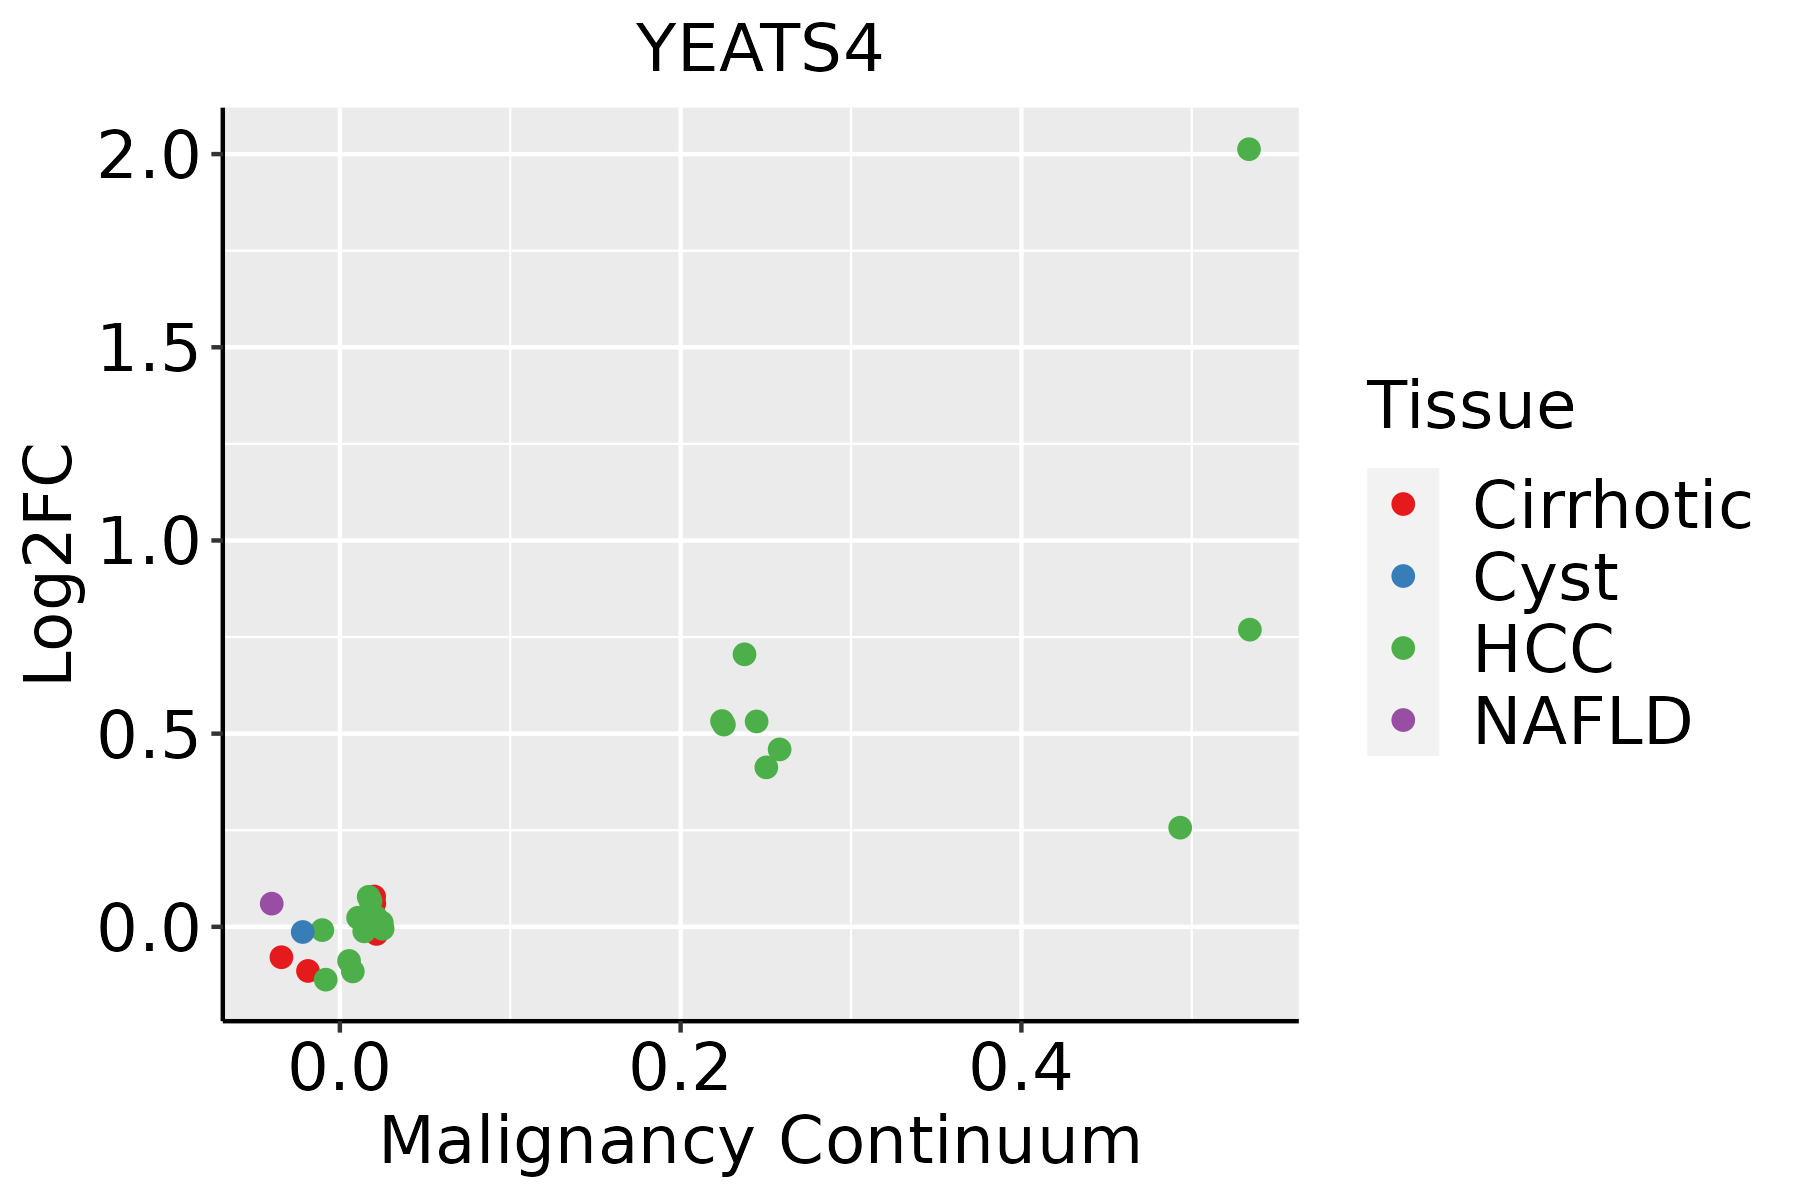 | HCC: Hepatocellular carcinoma |
| NAFLD: Non-alcoholic fatty liver disease | ||
| Oral Cavity | 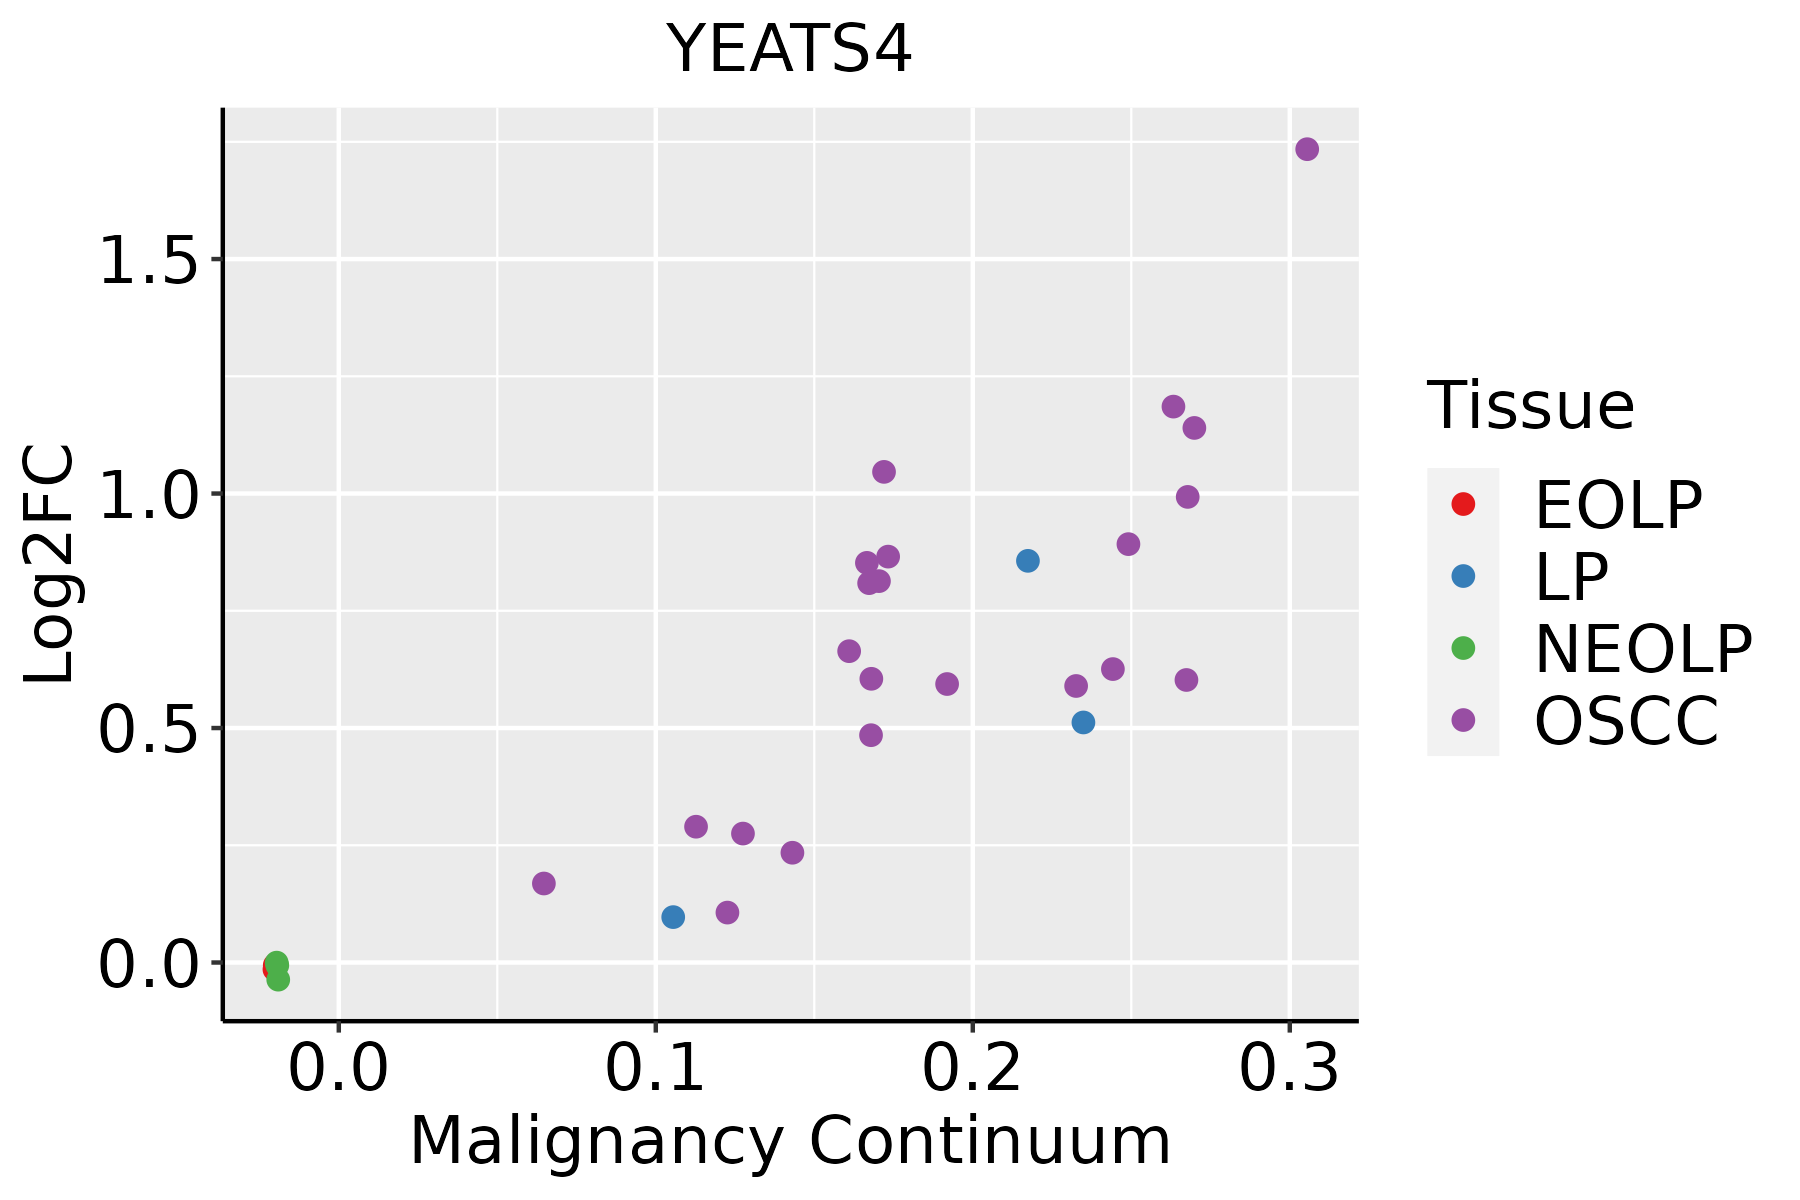 | EOLP: Erosive Oral lichen planus |
| LP: leukoplakia | ||
| NEOLP: Non-erosive oral lichen planus | ||
| OSCC: Oral squamous cell carcinoma | ||
| Skin | 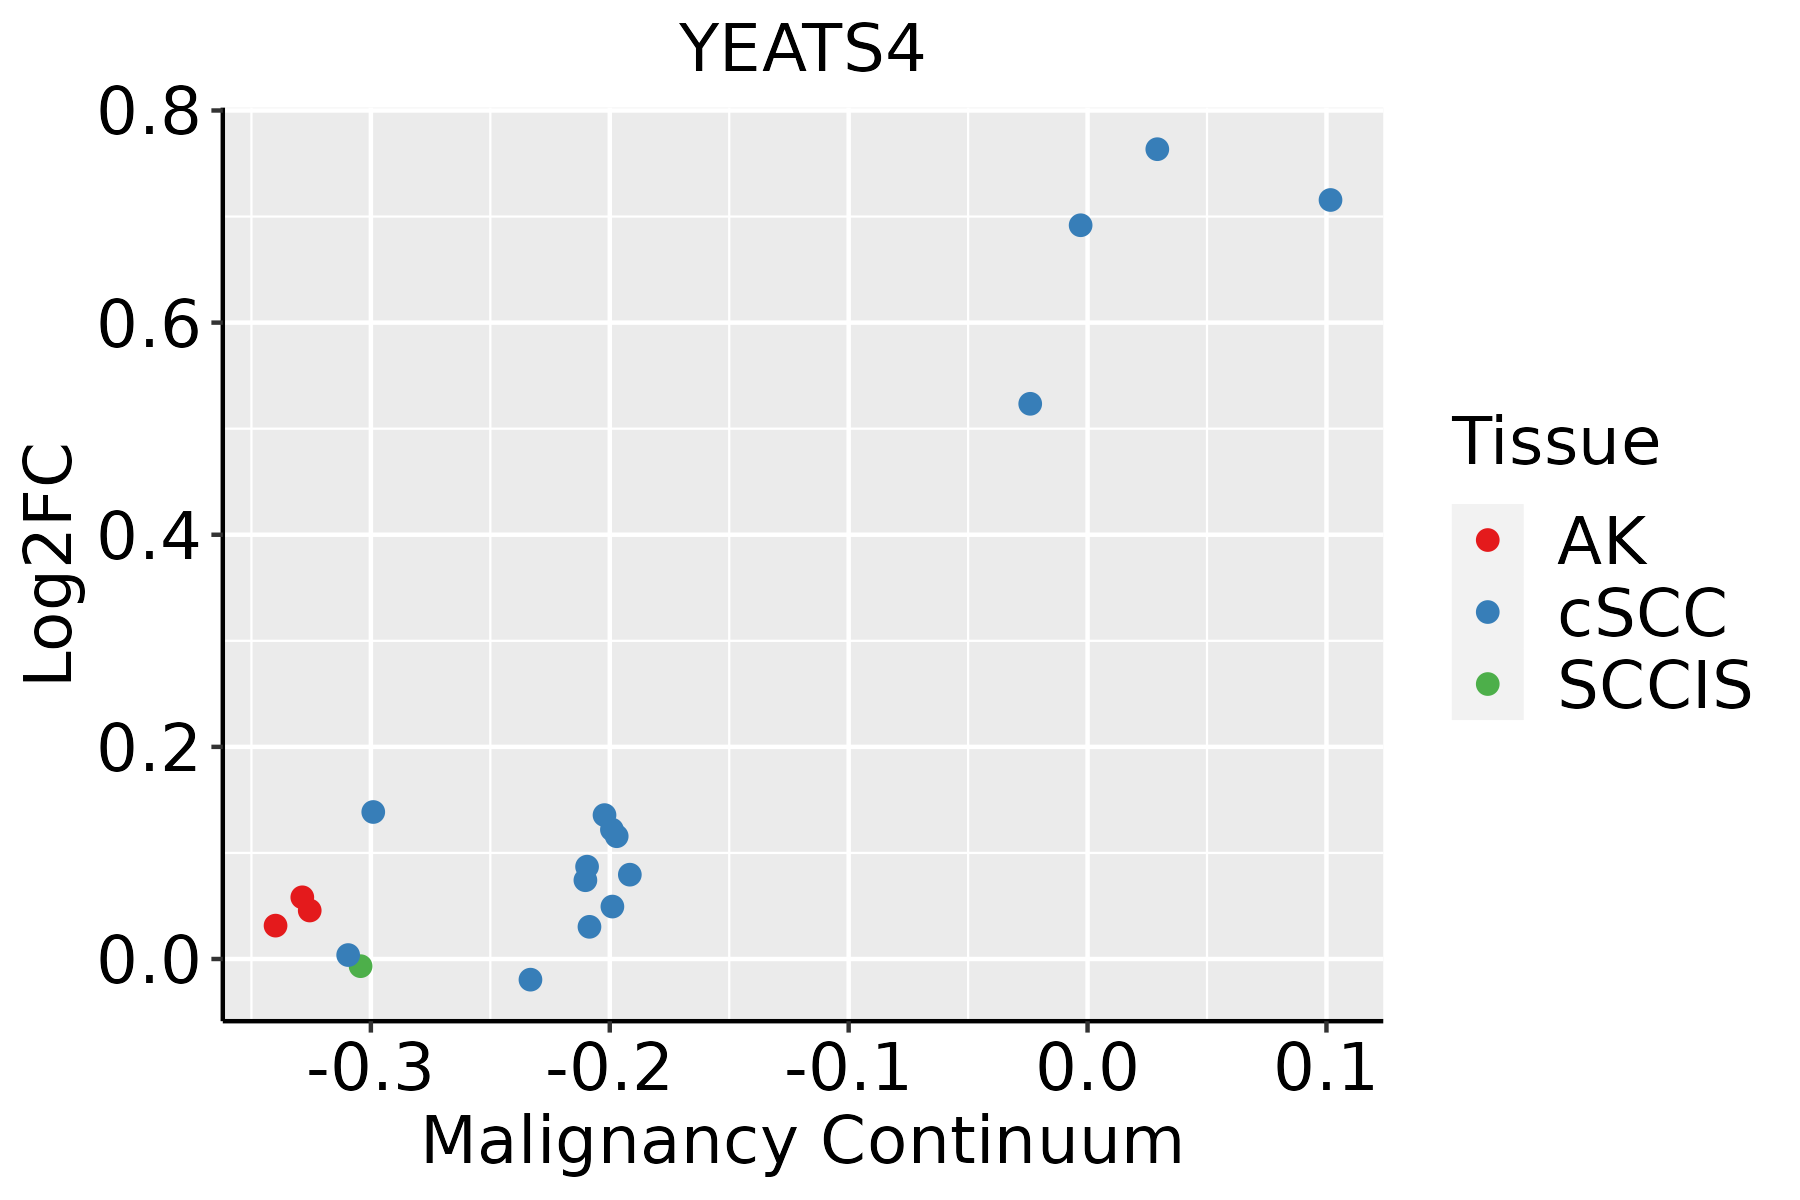 | AK: Actinic keratosis |
| cSCC: Cutaneous squamous cell carcinoma | ||
| SCCIS:squamous cell carcinoma in situ | ||
| Thyroid |  | ATC: Anaplastic thyroid cancer |
| HT: Hashimoto's thyroiditis | ||
| PTC: Papillary thyroid cancer |
| ∗log2FC in expression of this searched gene in stem-like cells from each diseased tissue sample relative to stem-like cells in normal samples in each tissue plotted against the malignancy continuum. Samples are colored based on if they are from different disease stage. |
Top |
Malignant transformation related pathway analysis |
| Find out the enriched GO biological processes and KEGG pathways involved in transition from healthy to precancer to cancer |
| Tissue | Disease Stage | Enriched GO biological Processes |
| Colorectum | AD |  |
| Colorectum | SER |  |
| Colorectum | MSS |  |
| Colorectum | MSI-H |  |
| Colorectum | FAP |  |
| ∗Top 15 enriched GO BP terms are showed in the bar plot of each disease state in each tissue. Each row represents a significant GO biological process which is colored according to the -log10(p.adjust). |
| Page: 1 2 3 4 5 6 7 8 9 |
| GO ID | Tissue | Disease Stage | Description | Gene Ratio | Bg Ratio | pvalue | p.adjust | Count |
| GO:001657015 | Esophagus | ESCC | histone modification | 323/8552 | 463/18723 | 2.61e-26 | 7.88e-24 | 323 |
| GO:001820514 | Esophagus | ESCC | peptidyl-lysine modification | 259/8552 | 376/18723 | 3.90e-20 | 5.26e-18 | 259 |
| GO:001839413 | Esophagus | ESCC | peptidyl-lysine acetylation | 123/8552 | 169/18723 | 6.58e-13 | 2.94e-11 | 123 |
| GO:004354313 | Esophagus | ESCC | protein acylation | 165/8552 | 243/18723 | 1.69e-12 | 7.14e-11 | 165 |
| GO:000647313 | Esophagus | ESCC | protein acetylation | 140/8552 | 201/18723 | 4.37e-12 | 1.69e-10 | 140 |
| GO:001839313 | Esophagus | ESCC | internal peptidyl-lysine acetylation | 114/8552 | 158/18723 | 1.16e-11 | 4.24e-10 | 114 |
| GO:000647513 | Esophagus | ESCC | internal protein amino acid acetylation | 115/8552 | 160/18723 | 1.43e-11 | 5.08e-10 | 115 |
| GO:00165735 | Esophagus | ESCC | histone acetylation | 110/8552 | 152/18723 | 1.95e-11 | 6.81e-10 | 110 |
| GO:004396712 | Esophagus | ESCC | histone H4 acetylation | 53/8552 | 67/18723 | 2.11e-08 | 4.03e-07 | 53 |
| GO:00439682 | Esophagus | ESCC | histone H2A acetylation | 15/8552 | 17/18723 | 3.48e-04 | 2.03e-03 | 15 |
| GO:00064731 | Liver | Cirrhotic | protein acetylation | 84/4634 | 201/18723 | 7.50e-08 | 2.25e-06 | 84 |
| GO:00183941 | Liver | Cirrhotic | peptidyl-lysine acetylation | 73/4634 | 169/18723 | 1.08e-07 | 3.07e-06 | 73 |
| GO:00435431 | Liver | Cirrhotic | protein acylation | 95/4634 | 243/18723 | 4.73e-07 | 1.07e-05 | 95 |
| GO:00182051 | Liver | Cirrhotic | peptidyl-lysine modification | 134/4634 | 376/18723 | 1.29e-06 | 2.59e-05 | 134 |
| GO:00064751 | Liver | Cirrhotic | internal protein amino acid acetylation | 65/4634 | 160/18723 | 6.66e-06 | 1.04e-04 | 65 |
| GO:00183931 | Liver | Cirrhotic | internal peptidyl-lysine acetylation | 64/4634 | 158/18723 | 8.75e-06 | 1.29e-04 | 64 |
| GO:001657011 | Liver | Cirrhotic | histone modification | 154/4634 | 463/18723 | 1.92e-05 | 2.57e-04 | 154 |
| GO:00165731 | Liver | Cirrhotic | histone acetylation | 61/4634 | 152/18723 | 1.97e-05 | 2.62e-04 | 61 |
| GO:0043967 | Liver | Cirrhotic | histone H4 acetylation | 31/4634 | 67/18723 | 1.03e-04 | 1.06e-03 | 31 |
| GO:0043968 | Liver | Cirrhotic | histone H2A acetylation | 11/4634 | 17/18723 | 5.66e-04 | 4.44e-03 | 11 |
| Page: 1 2 3 4 |
| Pathway ID | Tissue | Disease Stage | Description | Gene Ratio | Bg Ratio | pvalue | p.adjust | qvalue | Count |
| Page: 1 |
Top |
Cell-cell communication analysis |
| Identification of potential cell-cell interactions between two cell types and their ligand-receptor pairs for different disease states |
| Ligand | Receptor | LRpair | Pathway | Tissue | Disease Stage |
| Page: 1 |
Top |
Single-cell gene regulatory network inference analysis |
| Find out the significant the regulons (TFs) and the target genes of each regulon across cell types for different disease states |
| TF | Cell Type | Tissue | Disease Stage | Target Gene | RSS | Regulon Activity |
| YEATS4 | CD8TEREX | Pancreas | ADJ | TPRA1,MYC,DIXDC1, etc. | 5.42e-02 |  |
| YEATS4 | NKT | Pancreas | Healthy | TPRA1,MYC,DIXDC1, etc. | 7.72e-03 |  |
| YEATS4 | CD8TEXINT | Pancreas | PDAC | TPRA1,MYC,DIXDC1, etc. | 7.51e-02 |  |
| YEATS4 | CD8TEREX | Pancreas | PDAC | TPRA1,MYC,DIXDC1, etc. | 6.15e-02 | |
| YEATS4 | CD8TCM | Skin | AK | RABGGTA,ARL6IP6,RNF139-AS1, etc. | 7.72e-03 |  |
| YEATS4 | CD8TEREX | Skin | SCCIS | RABGGTA,ARL6IP6,RNF139-AS1, etc. | 2.59e-02 |  |
| ∗The dot plots of a searched regulon are shown for all cell subpopulations in each disease state of each tissue based on the regulon specific score inferred using pySCENIC and by calculating the average expression. |
| Page: 1 |
Top |
Somatic mutation of malignant transformation related genes |
| Annotation of somatic variants for genes involved in malignant transformation |
| Hugo Symbol | Variant Class | Variant Classification | dbSNP RS | HGVSc | HGVSp | HGVSp Short | SWISSPROT | BIOTYPE | SIFT | PolyPhen | Tumor Sample Barcode | Tissue | Histology | Sex | Age | Stage | Therapy Types | Drugs | Outcome |
| YEATS4 | SNV | Missense_Mutation | c.489A>C | p.Leu163Phe | p.L163F | O95619 | protein_coding | tolerated(0.62) | benign(0.01) | TCGA-BH-A1EN-01 | Breast | breast invasive carcinoma | Female | >=65 | I/II | Unknown | Unknown | SD | |
| YEATS4 | insertion | Frame_Shift_Ins | novel | c.680_681insA | p.Ter228IlefsTer12 | p.*228Ifs*12 | O95619 | protein_coding | TCGA-A1-A0SP-01 | Breast | breast invasive carcinoma | Female | <65 | I/II | Chemotherapy | SD | |||
| YEATS4 | SNV | Missense_Mutation | novel | c.317A>G | p.Asp106Gly | p.D106G | O95619 | protein_coding | deleterious(0) | probably_damaging(0.998) | TCGA-C5-A901-01 | Cervix | cervical & endocervical cancer | Female | <65 | I/II | Unknown | Unknown | SD |
| YEATS4 | SNV | Missense_Mutation | c.148N>A | p.Tyr50Asn | p.Y50N | O95619 | protein_coding | deleterious(0) | probably_damaging(0.997) | TCGA-D5-6923-01 | Colorectum | colon adenocarcinoma | Male | <65 | I/II | Unknown | Unknown | SD | |
| YEATS4 | SNV | Missense_Mutation | c.557N>T | p.Ala186Val | p.A186V | O95619 | protein_coding | tolerated(0.06) | benign(0.221) | TCGA-WS-AB45-01 | Colorectum | colon adenocarcinoma | Female | <65 | I/II | Unknown | Unknown | SD | |
| YEATS4 | SNV | Missense_Mutation | c.6N>G | p.Phe2Leu | p.F2L | O95619 | protein_coding | tolerated_low_confidence(0.4) | benign(0.01) | TCGA-AG-3731-01 | Colorectum | rectum adenocarcinoma | Male | >=65 | III/IV | Chemotherapy | folinic | PR | |
| YEATS4 | SNV | Missense_Mutation | novel | c.289G>A | p.Glu97Lys | p.E97K | O95619 | protein_coding | deleterious(0) | probably_damaging(0.99) | TCGA-EI-6917-01 | Colorectum | rectum adenocarcinoma | Male | <65 | III/IV | Chemotherapy | 5fluorouracil+oxaciplatina+l-folinian | SD |
| YEATS4 | SNV | Missense_Mutation | novel | c.494N>T | p.Ala165Val | p.A165V | O95619 | protein_coding | tolerated(0.33) | benign(0.007) | TCGA-AJ-A3EK-01 | Endometrium | uterine corpus endometrioid carcinoma | Female | <65 | I/II | Chemotherapy | carboplatin | CR |
| YEATS4 | SNV | Missense_Mutation | novel | c.611N>A | p.Ser204Asn | p.S204N | O95619 | protein_coding | tolerated(0.14) | benign(0.006) | TCGA-AJ-A3EK-01 | Endometrium | uterine corpus endometrioid carcinoma | Female | <65 | I/II | Chemotherapy | carboplatin | CR |
| YEATS4 | SNV | Missense_Mutation | novel | c.453N>A | p.Met151Ile | p.M151I | O95619 | protein_coding | deleterious(0.01) | possibly_damaging(0.656) | TCGA-AX-A1CE-01 | Endometrium | uterine corpus endometrioid carcinoma | Female | <65 | I/II | Unspecific | Paclitaxel | SD |
| Page: 1 2 |
Top |
Related drugs of malignant transformation related genes |
| Identification of chemicals and drugs interact with genes involved in malignant transfromation |
| (DGIdb 4.0) |
| Entrez ID | Symbol | Category | Interaction Types | Drug Claim Name | Drug Name | PMIDs |
| 8089 | YEATS4 | TRANSCRIPTION FACTOR, TUMOR SUPPRESSOR, CLINICALLY ACTIONABLE | hydrochlorothiazide | HYDROCHLOROTHIAZIDE |
| Page: 1 |

Copyright 2023-Present -The University of Texas Health Science Center at Houston |