
|
|||||
|
 | |
| |
| |
| |
| |
| |
|
Gene: YEATS2 |
Gene summary for YEATS2 |
| Gene information | Species | Human | Gene symbol | YEATS2 | Gene ID | 55689 |
| Gene name | YEATS domain containing 2 | |
| Gene Alias | FAME4 | |
| Cytomap | 3q27.1 | |
| Gene Type | protein-coding | GO ID | GO:0000122 | UniProtAcc | Q9ULM3 |
Top |
Malignant transformation analysis |
| Identification of the aberrant gene expression in precancerous and cancerous lesions by comparing the gene expression of stem-like cells in diseased tissues with normal stem cells |
| Entrez ID | Symbol | Replicates | Species | Organ | Tissue | Adj P-value | Log2FC | Malignancy |
| 55689 | YEATS2 | CCI_1 | Human | Cervix | CC | 3.77e-19 | 1.22e+00 | 0.528 |
| 55689 | YEATS2 | CCI_2 | Human | Cervix | CC | 1.79e-11 | 1.15e+00 | 0.5249 |
| 55689 | YEATS2 | CCI_3 | Human | Cervix | CC | 3.34e-30 | 1.31e+00 | 0.516 |
| 55689 | YEATS2 | LZE2T | Human | Esophagus | ESCC | 2.82e-08 | 7.10e-01 | 0.082 |
| 55689 | YEATS2 | LZE4T | Human | Esophagus | ESCC | 2.23e-27 | 7.10e-01 | 0.0811 |
| 55689 | YEATS2 | LZE5T | Human | Esophagus | ESCC | 1.14e-02 | 3.88e-01 | 0.0514 |
| 55689 | YEATS2 | LZE7T | Human | Esophagus | ESCC | 1.32e-09 | 3.24e-01 | 0.0667 |
| 55689 | YEATS2 | LZE20T | Human | Esophagus | ESCC | 1.33e-05 | 1.37e-01 | 0.0662 |
| 55689 | YEATS2 | LZE22T | Human | Esophagus | ESCC | 3.72e-02 | 2.81e-01 | 0.068 |
| 55689 | YEATS2 | LZE24T | Human | Esophagus | ESCC | 4.85e-19 | 4.80e-01 | 0.0596 |
| 55689 | YEATS2 | LZE21T | Human | Esophagus | ESCC | 3.38e-08 | 5.76e-01 | 0.0655 |
| 55689 | YEATS2 | P1T-E | Human | Esophagus | ESCC | 9.50e-09 | 3.38e-01 | 0.0875 |
| 55689 | YEATS2 | P2T-E | Human | Esophagus | ESCC | 3.60e-46 | 8.49e-01 | 0.1177 |
| 55689 | YEATS2 | P4T-E | Human | Esophagus | ESCC | 4.58e-31 | 6.26e-01 | 0.1323 |
| 55689 | YEATS2 | P5T-E | Human | Esophagus | ESCC | 3.45e-24 | 4.45e-01 | 0.1327 |
| 55689 | YEATS2 | P8T-E | Human | Esophagus | ESCC | 1.02e-21 | 3.48e-01 | 0.0889 |
| 55689 | YEATS2 | P9T-E | Human | Esophagus | ESCC | 4.78e-15 | 3.52e-01 | 0.1131 |
| 55689 | YEATS2 | P10T-E | Human | Esophagus | ESCC | 3.87e-37 | 6.52e-01 | 0.116 |
| 55689 | YEATS2 | P11T-E | Human | Esophagus | ESCC | 1.32e-18 | 5.23e-01 | 0.1426 |
| 55689 | YEATS2 | P12T-E | Human | Esophagus | ESCC | 3.67e-18 | 3.77e-01 | 0.1122 |
| Page: 1 2 3 4 5 6 |
| Tissue | Expression Dynamics | Abbreviation |
| Cervix | 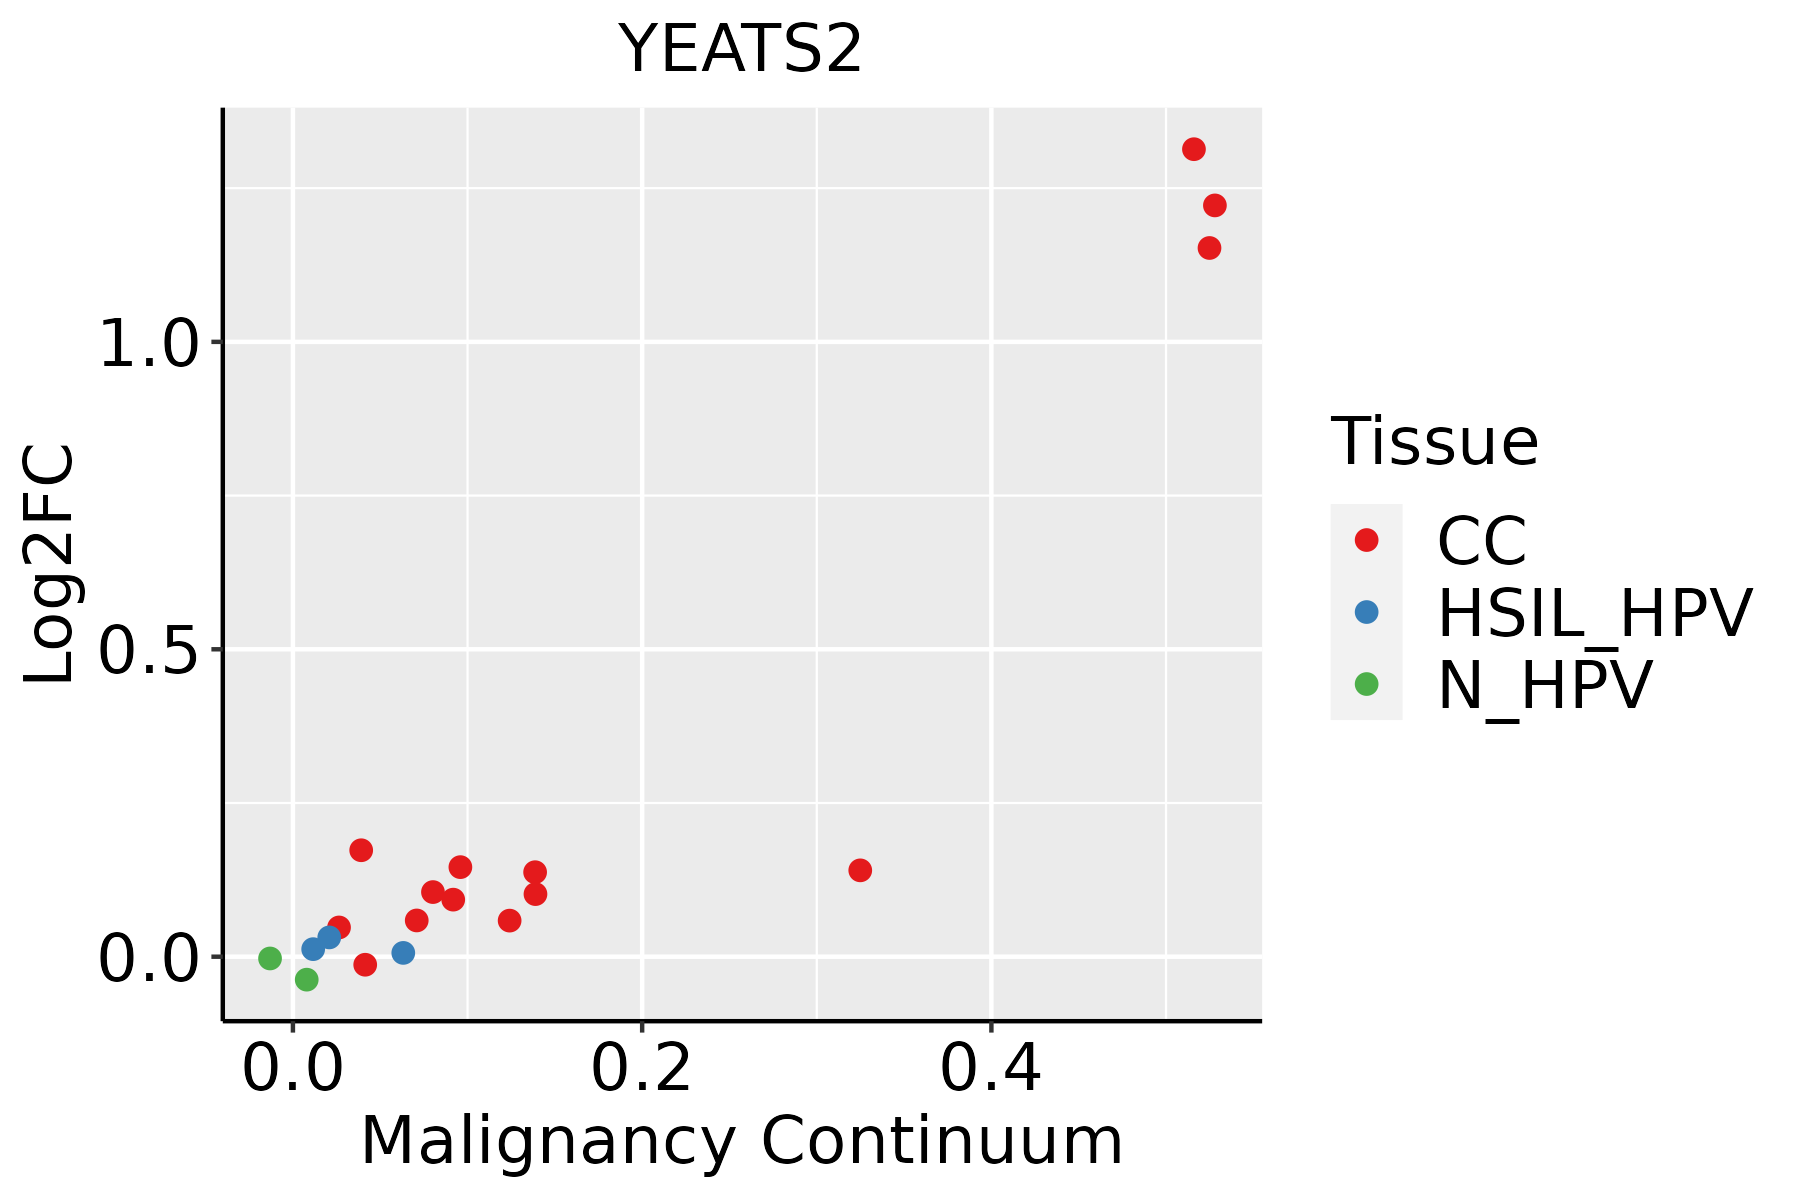 | CC: Cervix cancer |
| HSIL_HPV: HPV-infected high-grade squamous intraepithelial lesions | ||
| N_HPV: HPV-infected normal cervix | ||
| Esophagus |  | ESCC: Esophageal squamous cell carcinoma |
| HGIN: High-grade intraepithelial neoplasias | ||
| LGIN: Low-grade intraepithelial neoplasias | ||
| Liver | 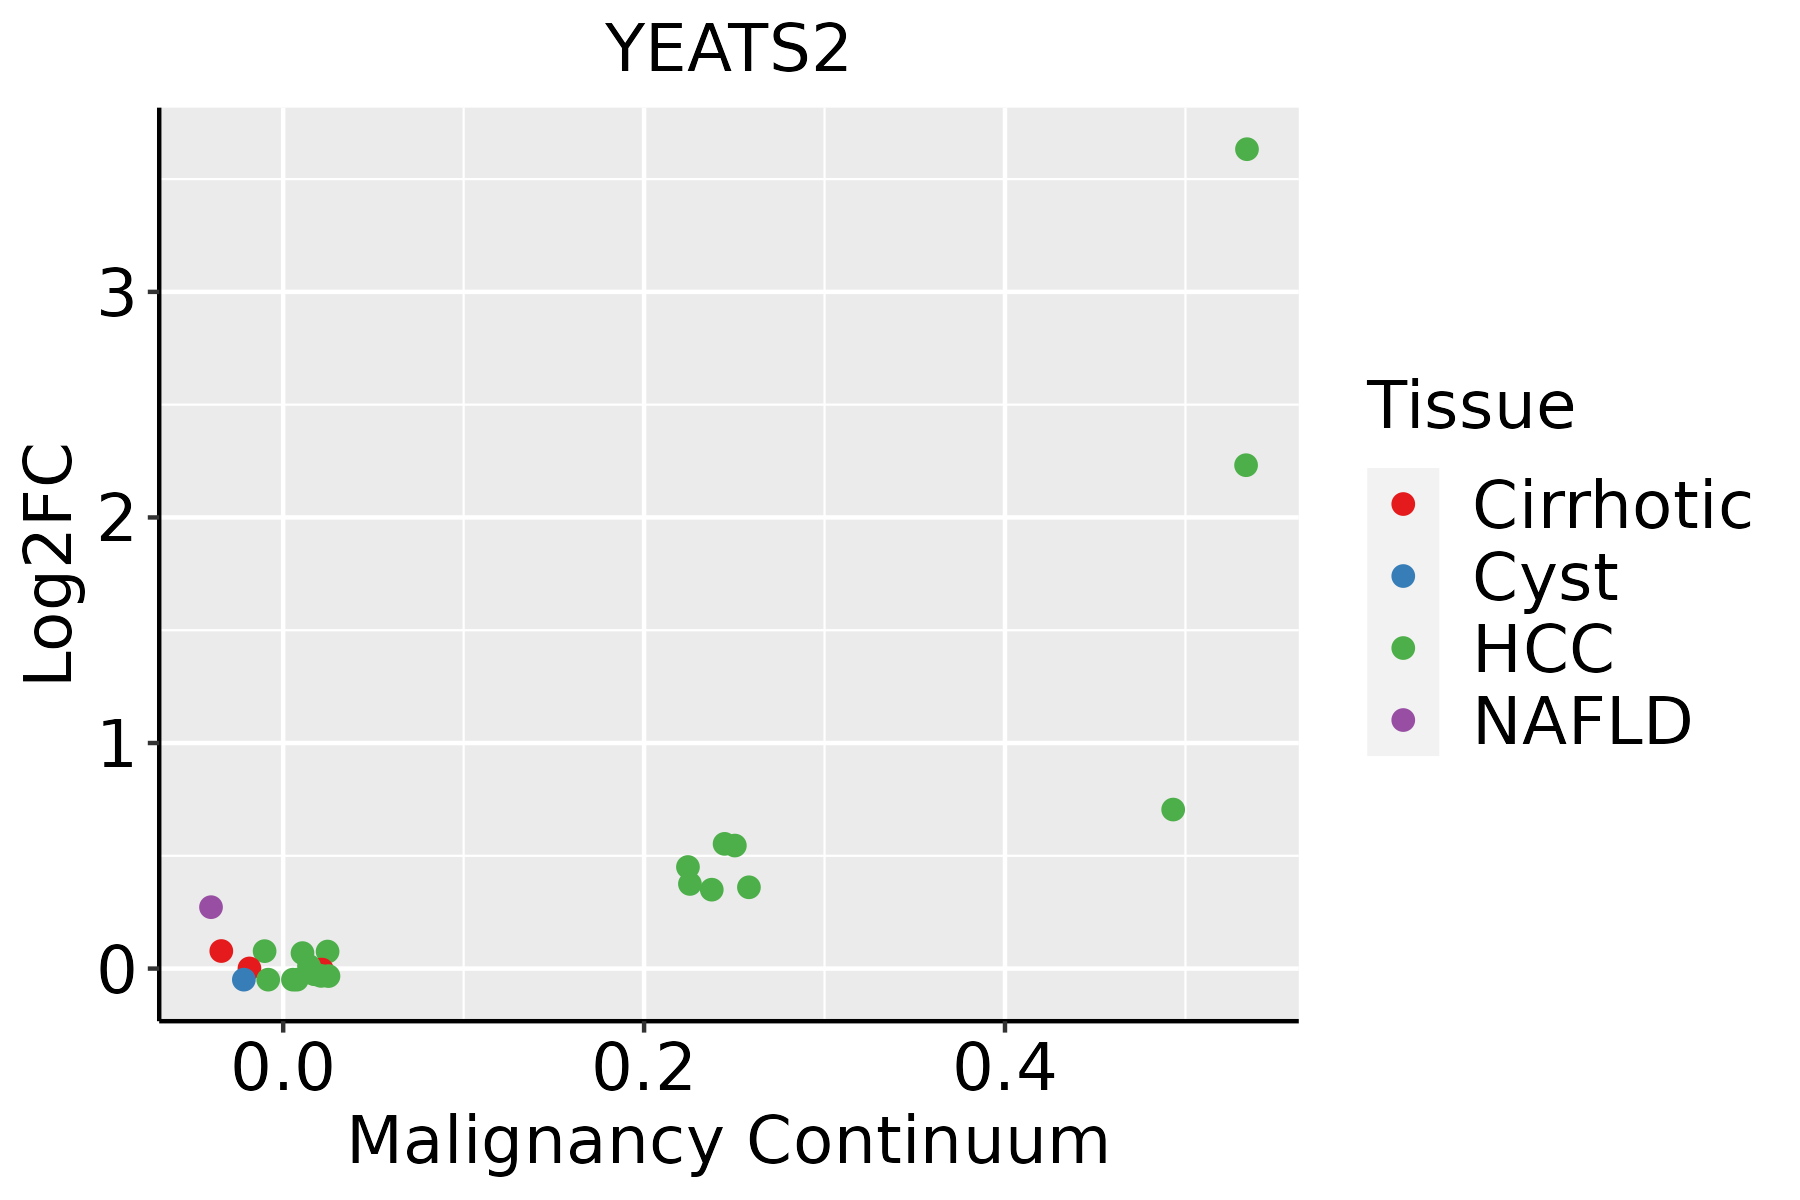 | HCC: Hepatocellular carcinoma |
| NAFLD: Non-alcoholic fatty liver disease | ||
| Oral Cavity |  | EOLP: Erosive Oral lichen planus |
| LP: leukoplakia | ||
| NEOLP: Non-erosive oral lichen planus | ||
| OSCC: Oral squamous cell carcinoma | ||
| Thyroid |  | ATC: Anaplastic thyroid cancer |
| HT: Hashimoto's thyroiditis | ||
| PTC: Papillary thyroid cancer |
| ∗log2FC in expression of this searched gene in stem-like cells from each diseased tissue sample relative to stem-like cells in normal samples in each tissue plotted against the malignancy continuum. Samples are colored based on if they are from different disease stage. |
Top |
Malignant transformation related pathway analysis |
| Find out the enriched GO biological processes and KEGG pathways involved in transition from healthy to precancer to cancer |
| Tissue | Disease Stage | Enriched GO biological Processes |
| Colorectum | AD |  |
| Colorectum | SER |  |
| Colorectum | MSS |  |
| Colorectum | MSI-H |  |
| Colorectum | FAP |  |
| ∗Top 15 enriched GO BP terms are showed in the bar plot of each disease state in each tissue. Each row represents a significant GO biological process which is colored according to the -log10(p.adjust). |
| Page: 1 2 3 4 5 6 7 8 9 |
| GO ID | Tissue | Disease Stage | Description | Gene Ratio | Bg Ratio | pvalue | p.adjust | Count |
| GO:00165705 | Cervix | CC | histone modification | 84/2311 | 463/18723 | 1.70e-04 | 2.01e-03 | 84 |
| GO:00182054 | Cervix | CC | peptidyl-lysine modification | 62/2311 | 376/18723 | 1.04e-02 | 4.97e-02 | 62 |
| GO:001657015 | Esophagus | ESCC | histone modification | 323/8552 | 463/18723 | 2.61e-26 | 7.88e-24 | 323 |
| GO:001820514 | Esophagus | ESCC | peptidyl-lysine modification | 259/8552 | 376/18723 | 3.90e-20 | 5.26e-18 | 259 |
| GO:001839413 | Esophagus | ESCC | peptidyl-lysine acetylation | 123/8552 | 169/18723 | 6.58e-13 | 2.94e-11 | 123 |
| GO:004354313 | Esophagus | ESCC | protein acylation | 165/8552 | 243/18723 | 1.69e-12 | 7.14e-11 | 165 |
| GO:000647313 | Esophagus | ESCC | protein acetylation | 140/8552 | 201/18723 | 4.37e-12 | 1.69e-10 | 140 |
| GO:001839313 | Esophagus | ESCC | internal peptidyl-lysine acetylation | 114/8552 | 158/18723 | 1.16e-11 | 4.24e-10 | 114 |
| GO:000647513 | Esophagus | ESCC | internal protein amino acid acetylation | 115/8552 | 160/18723 | 1.43e-11 | 5.08e-10 | 115 |
| GO:00165735 | Esophagus | ESCC | histone acetylation | 110/8552 | 152/18723 | 1.95e-11 | 6.81e-10 | 110 |
| GO:00439662 | Esophagus | ESCC | histone H3 acetylation | 43/8552 | 61/18723 | 7.57e-05 | 5.67e-04 | 43 |
| GO:001657021 | Liver | HCC | histone modification | 283/7958 | 463/18723 | 2.68e-16 | 2.33e-14 | 283 |
| GO:00182052 | Liver | HCC | peptidyl-lysine modification | 230/7958 | 376/18723 | 1.51e-13 | 8.32e-12 | 230 |
| GO:00064732 | Liver | HCC | protein acetylation | 135/7958 | 201/18723 | 1.20e-12 | 5.92e-11 | 135 |
| GO:00435432 | Liver | HCC | protein acylation | 157/7958 | 243/18723 | 2.40e-12 | 1.12e-10 | 157 |
| GO:00183942 | Liver | HCC | peptidyl-lysine acetylation | 116/7958 | 169/18723 | 5.11e-12 | 2.23e-10 | 116 |
| GO:00064752 | Liver | HCC | internal protein amino acid acetylation | 107/7958 | 160/18723 | 3.77e-10 | 1.23e-08 | 107 |
| GO:00183932 | Liver | HCC | internal peptidyl-lysine acetylation | 105/7958 | 158/18723 | 9.48e-10 | 2.90e-08 | 105 |
| GO:00165732 | Liver | HCC | histone acetylation | 101/7958 | 152/18723 | 1.99e-09 | 5.63e-08 | 101 |
| GO:0043966 | Liver | HCC | histone H3 acetylation | 37/7958 | 61/18723 | 3.21e-03 | 1.48e-02 | 37 |
| Page: 1 2 3 4 |
| Pathway ID | Tissue | Disease Stage | Description | Gene Ratio | Bg Ratio | pvalue | p.adjust | qvalue | Count |
| Page: 1 |
Top |
Cell-cell communication analysis |
| Identification of potential cell-cell interactions between two cell types and their ligand-receptor pairs for different disease states |
| Ligand | Receptor | LRpair | Pathway | Tissue | Disease Stage |
| Page: 1 |
Top |
Single-cell gene regulatory network inference analysis |
| Find out the significant the regulons (TFs) and the target genes of each regulon across cell types for different disease states |
| TF | Cell Type | Tissue | Disease Stage | Target Gene | RSS | Regulon Activity |
| ∗The dot plots of a searched regulon are shown for all cell subpopulations in each disease state of each tissue based on the regulon specific score inferred using pySCENIC and by calculating the average expression. |
| Page: 1 |
Top |
Somatic mutation of malignant transformation related genes |
| Annotation of somatic variants for genes involved in malignant transformation |
| Hugo Symbol | Variant Class | Variant Classification | dbSNP RS | HGVSc | HGVSp | HGVSp Short | SWISSPROT | BIOTYPE | SIFT | PolyPhen | Tumor Sample Barcode | Tissue | Histology | Sex | Age | Stage | Therapy Types | Drugs | Outcome |
| YEATS2 | SNV | Missense_Mutation | c.557G>C | p.Gly186Ala | p.G186A | Q9ULM3 | protein_coding | tolerated(0.35) | benign(0.021) | TCGA-A2-A0T3-01 | Breast | breast invasive carcinoma | Female | <65 | I/II | Chemotherapy | adriamycin | SD | |
| YEATS2 | SNV | Missense_Mutation | novel | c.712N>A | p.Val238Ile | p.V238I | Q9ULM3 | protein_coding | deleterious(0.03) | probably_damaging(0.979) | TCGA-A2-A4RW-01 | Breast | breast invasive carcinoma | Female | <65 | III/IV | Unknown | Unknown | SD |
| YEATS2 | SNV | Missense_Mutation | c.1667N>G | p.Ser556Cys | p.S556C | Q9ULM3 | protein_coding | deleterious_low_confidence(0.04) | possibly_damaging(0.781) | TCGA-AN-A0FL-01 | Breast | breast invasive carcinoma | Female | <65 | I/II | Unknown | Unknown | SD | |
| YEATS2 | SNV | Missense_Mutation | rs750911091 | c.851N>G | p.Glu284Gly | p.E284G | Q9ULM3 | protein_coding | deleterious(0) | probably_damaging(0.999) | TCGA-AQ-A04H-01 | Breast | breast invasive carcinoma | Female | <65 | III/IV | Chemotherapy | taxotere | SD |
| YEATS2 | SNV | Missense_Mutation | novel | c.536N>T | p.Arg179Met | p.R179M | Q9ULM3 | protein_coding | deleterious(0) | possibly_damaging(0.641) | TCGA-AR-A0U0-01 | Breast | breast invasive carcinoma | Female | >=65 | I/II | Unknown | Unknown | SD |
| YEATS2 | SNV | Missense_Mutation | novel | c.3841N>A | p.Gln1281Lys | p.Q1281K | Q9ULM3 | protein_coding | deleterious(0.03) | benign(0.112) | TCGA-AR-A24H-01 | Breast | breast invasive carcinoma | Female | >=65 | I/II | Hormone Therapy | tamoxiphen | SD |
| YEATS2 | SNV | Missense_Mutation | c.46N>A | p.Glu16Lys | p.E16K | Q9ULM3 | protein_coding | deleterious(0.01) | possibly_damaging(0.651) | TCGA-BH-A0HP-01 | Breast | breast invasive carcinoma | Female | >=65 | III/IV | Chemotherapy | doxorubicin | SD | |
| YEATS2 | SNV | Missense_Mutation | novel | c.123G>C | p.Lys41Asn | p.K41N | Q9ULM3 | protein_coding | deleterious(0) | probably_damaging(0.994) | TCGA-BH-A2L8-01 | Breast | breast invasive carcinoma | Female | <65 | I/II | Chemotherapy | cytoxan | CR |
| YEATS2 | SNV | Missense_Mutation | c.2932G>T | p.Val978Leu | p.V978L | Q9ULM3 | protein_coding | tolerated_low_confidence(0.74) | benign(0.005) | TCGA-C8-A1HM-01 | Breast | breast invasive carcinoma | Female | >=65 | I/II | Chemotherapy | doxorubicin | CR | |
| YEATS2 | SNV | Missense_Mutation | c.251C>G | p.Ala84Gly | p.A84G | Q9ULM3 | protein_coding | deleterious(0) | probably_damaging(0.934) | TCGA-E9-A22G-01 | Breast | breast invasive carcinoma | Female | <65 | I/II | Chemotherapy | doxorubicin | SD |
| Page: 1 2 3 4 5 6 7 8 9 10 11 12 13 14 |
Top |
Related drugs of malignant transformation related genes |
| Identification of chemicals and drugs interact with genes involved in malignant transfromation |
| (DGIdb 4.0) |
| Entrez ID | Symbol | Category | Interaction Types | Drug Claim Name | Drug Name | PMIDs |
| Page: 1 |

Copyright 2023-Present -The University of Texas Health Science Center at Houston |