
|
|||||
|
 | |
| |
| |
| |
| |
| |
|
Gene: YBX1 |
Gene summary for YBX1 |
| Gene information | Species | Human | Gene symbol | YBX1 | Gene ID | 4904 |
| Gene name | Y-box binding protein 1 | |
| Gene Alias | BP-8 | |
| Cytomap | 1p34.2 | |
| Gene Type | protein-coding | GO ID | GO:0000122 | UniProtAcc | P67809 |
Top |
Malignant transformation analysis |
| Identification of the aberrant gene expression in precancerous and cancerous lesions by comparing the gene expression of stem-like cells in diseased tissues with normal stem cells |
| Entrez ID | Symbol | Replicates | Species | Organ | Tissue | Adj P-value | Log2FC | Malignancy |
| 4904 | YBX1 | GSM4909277 | Human | Breast | Precancer | 2.94e-02 | -1.21e-01 | 0.0177 |
| 4904 | YBX1 | GSM4909280 | Human | Breast | Precancer | 8.42e-03 | -4.68e-01 | 0.0305 |
| 4904 | YBX1 | GSM4909281 | Human | Breast | IDC | 5.41e-38 | 4.53e-01 | 0.21 |
| 4904 | YBX1 | GSM4909282 | Human | Breast | IDC | 2.27e-52 | 4.83e-01 | -0.0288 |
| 4904 | YBX1 | GSM4909285 | Human | Breast | IDC | 3.66e-49 | 4.82e-01 | 0.21 |
| 4904 | YBX1 | GSM4909286 | Human | Breast | IDC | 7.87e-36 | 4.52e-01 | 0.1081 |
| 4904 | YBX1 | GSM4909287 | Human | Breast | IDC | 2.20e-06 | -7.27e-03 | 0.2057 |
| 4904 | YBX1 | GSM4909288 | Human | Breast | IDC | 1.35e-08 | 2.87e-01 | 0.0988 |
| 4904 | YBX1 | GSM4909290 | Human | Breast | IDC | 6.97e-03 | 1.92e-01 | 0.2096 |
| 4904 | YBX1 | GSM4909291 | Human | Breast | IDC | 8.70e-07 | -3.61e-01 | 0.1753 |
| 4904 | YBX1 | GSM4909293 | Human | Breast | IDC | 1.55e-29 | -3.44e-01 | 0.1581 |
| 4904 | YBX1 | GSM4909294 | Human | Breast | IDC | 1.64e-06 | -2.55e-02 | 0.2022 |
| 4904 | YBX1 | GSM4909296 | Human | Breast | IDC | 1.04e-50 | -9.23e-01 | 0.1524 |
| 4904 | YBX1 | GSM4909297 | Human | Breast | IDC | 6.03e-26 | -4.44e-01 | 0.1517 |
| 4904 | YBX1 | GSM4909298 | Human | Breast | IDC | 1.36e-46 | -5.89e-01 | 0.1551 |
| 4904 | YBX1 | GSM4909299 | Human | Breast | IDC | 1.52e-15 | -3.13e-01 | 0.035 |
| 4904 | YBX1 | GSM4909301 | Human | Breast | IDC | 2.61e-07 | -3.30e-01 | 0.1577 |
| 4904 | YBX1 | GSM4909302 | Human | Breast | IDC | 1.31e-21 | -5.97e-01 | 0.1545 |
| 4904 | YBX1 | GSM4909304 | Human | Breast | IDC | 8.49e-27 | -4.09e-01 | 0.1636 |
| 4904 | YBX1 | GSM4909306 | Human | Breast | IDC | 2.31e-24 | -3.76e-01 | 0.1564 |
| Page: 1 2 3 4 5 6 7 8 9 10 11 12 13 14 15 16 17 18 19 |
| Tissue | Expression Dynamics | Abbreviation |
| Breast | 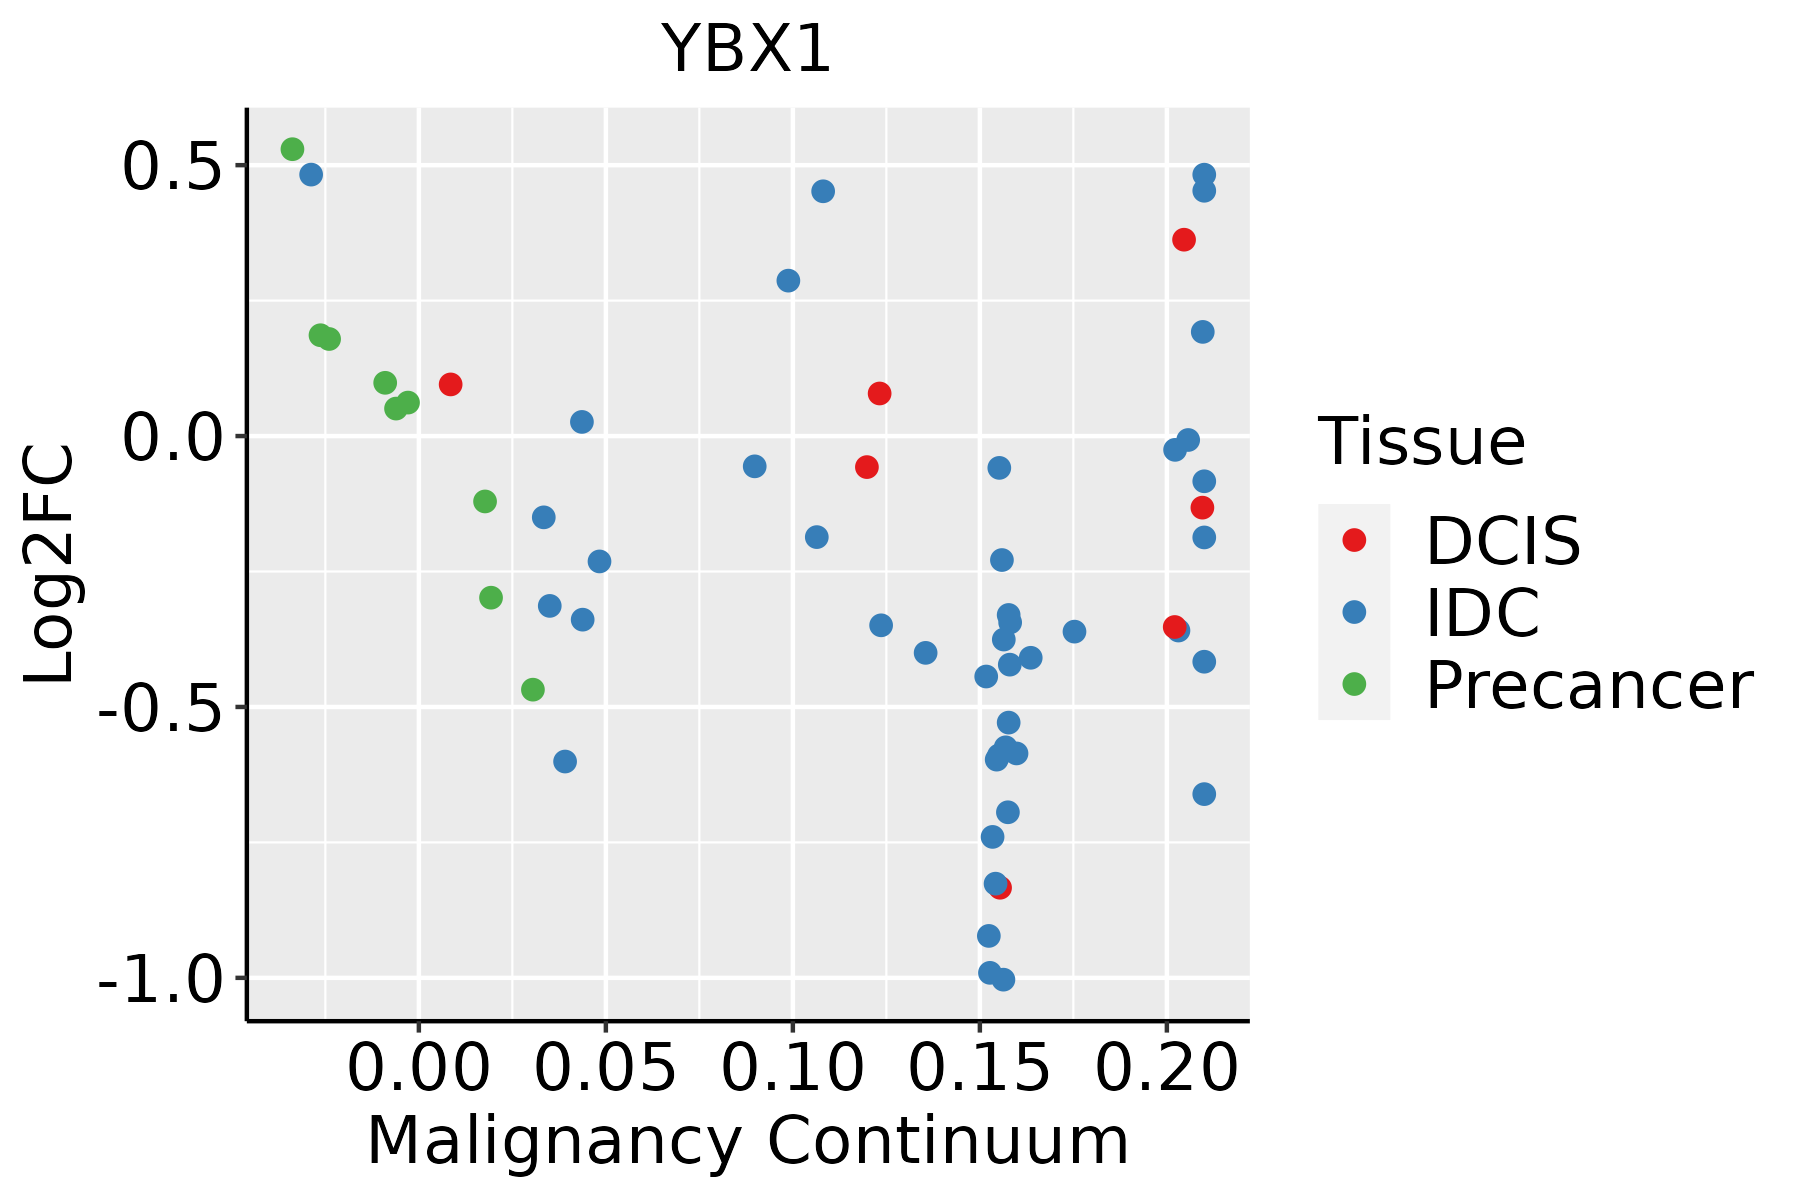 | IDC: Invasive ductal carcinoma |
| DCIS: Ductal carcinoma in situ | ||
| Precancer(BRCA1-mut): Precancerous lesion from BRCA1 mutation carriers | ||
| Cervix |  | CC: Cervix cancer |
| HSIL_HPV: HPV-infected high-grade squamous intraepithelial lesions | ||
| N_HPV: HPV-infected normal cervix | ||
| Colorectum (GSE201348) |  | FAP: Familial adenomatous polyposis |
| CRC: Colorectal cancer | ||
| Colorectum (HTA11) |  | AD: Adenomas |
| SER: Sessile serrated lesions | ||
| MSI-H: Microsatellite-high colorectal cancer | ||
| MSS: Microsatellite stable colorectal cancer | ||
| Endometrium | 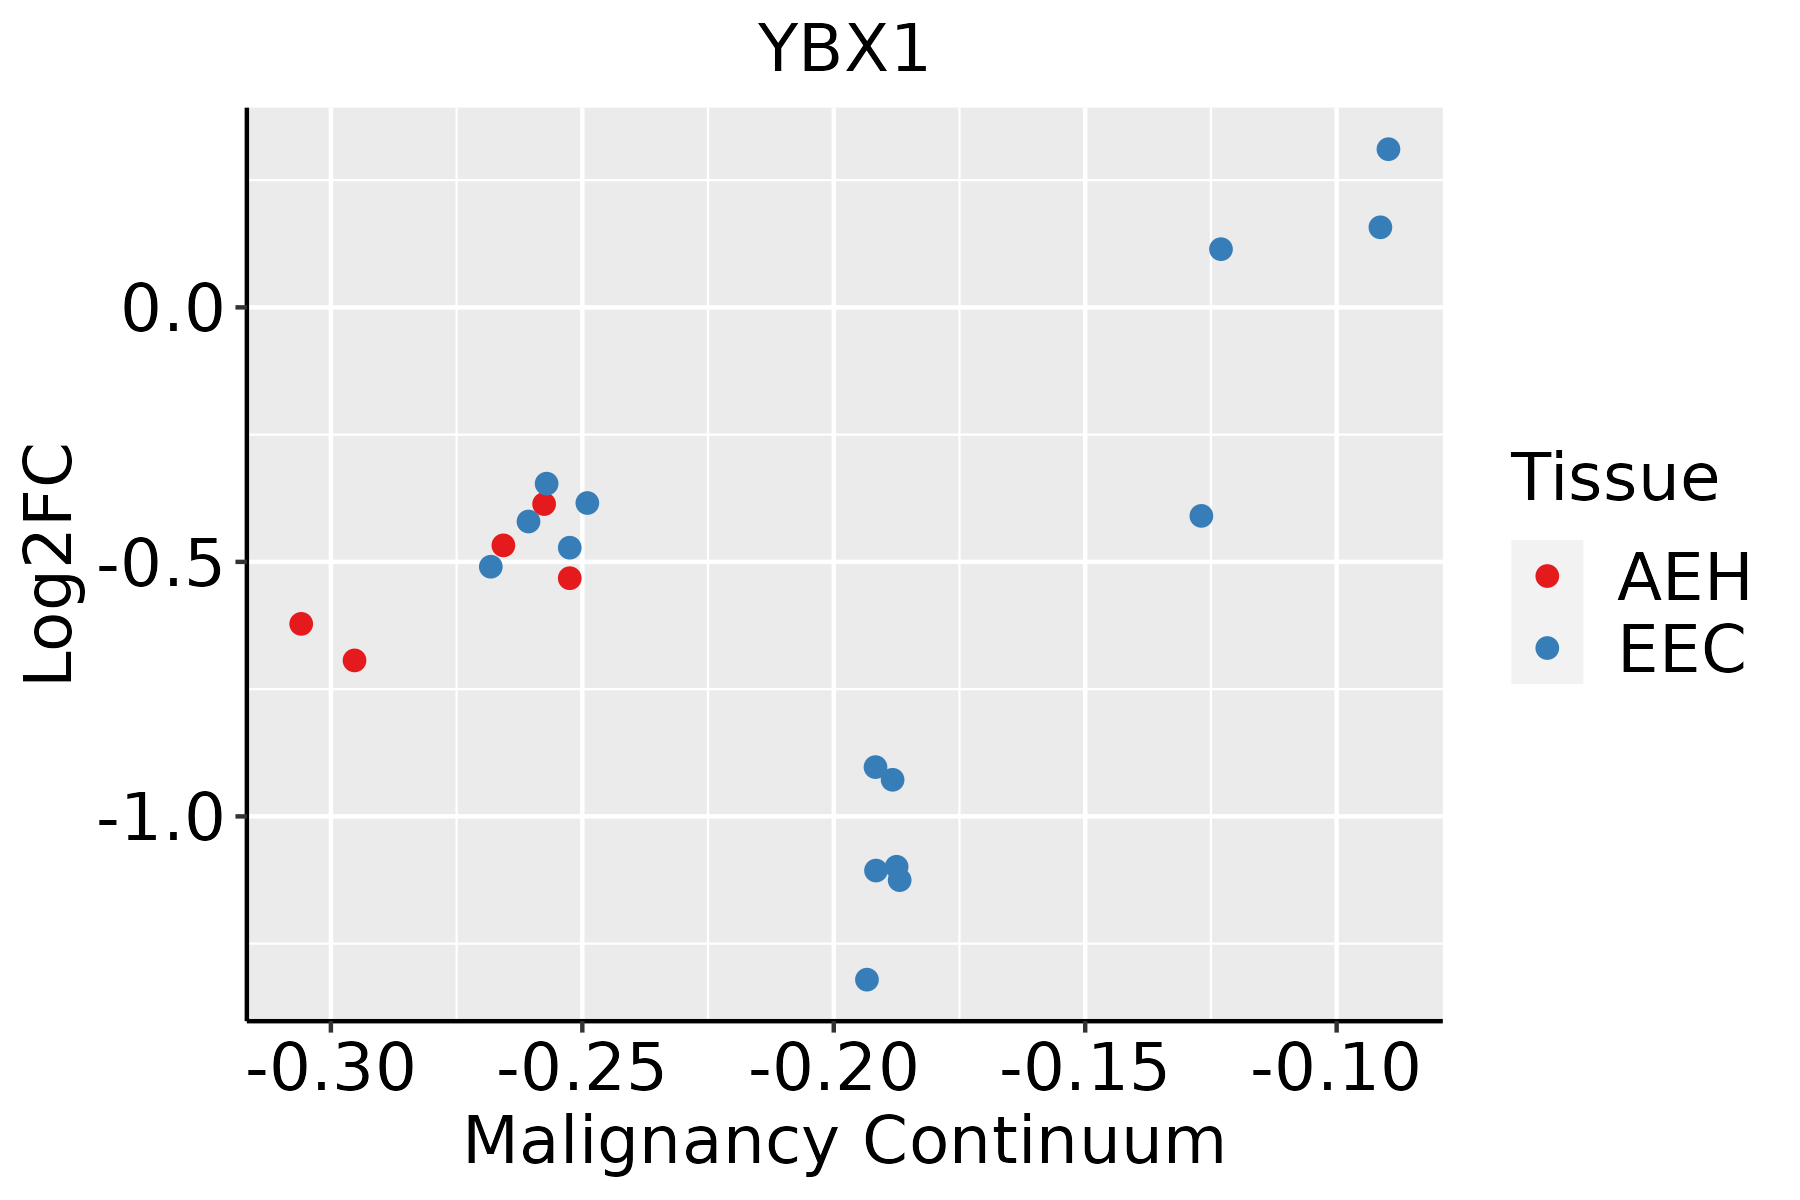 | AEH: Atypical endometrial hyperplasia |
| EEC: Endometrioid Cancer | ||
| Esophagus | 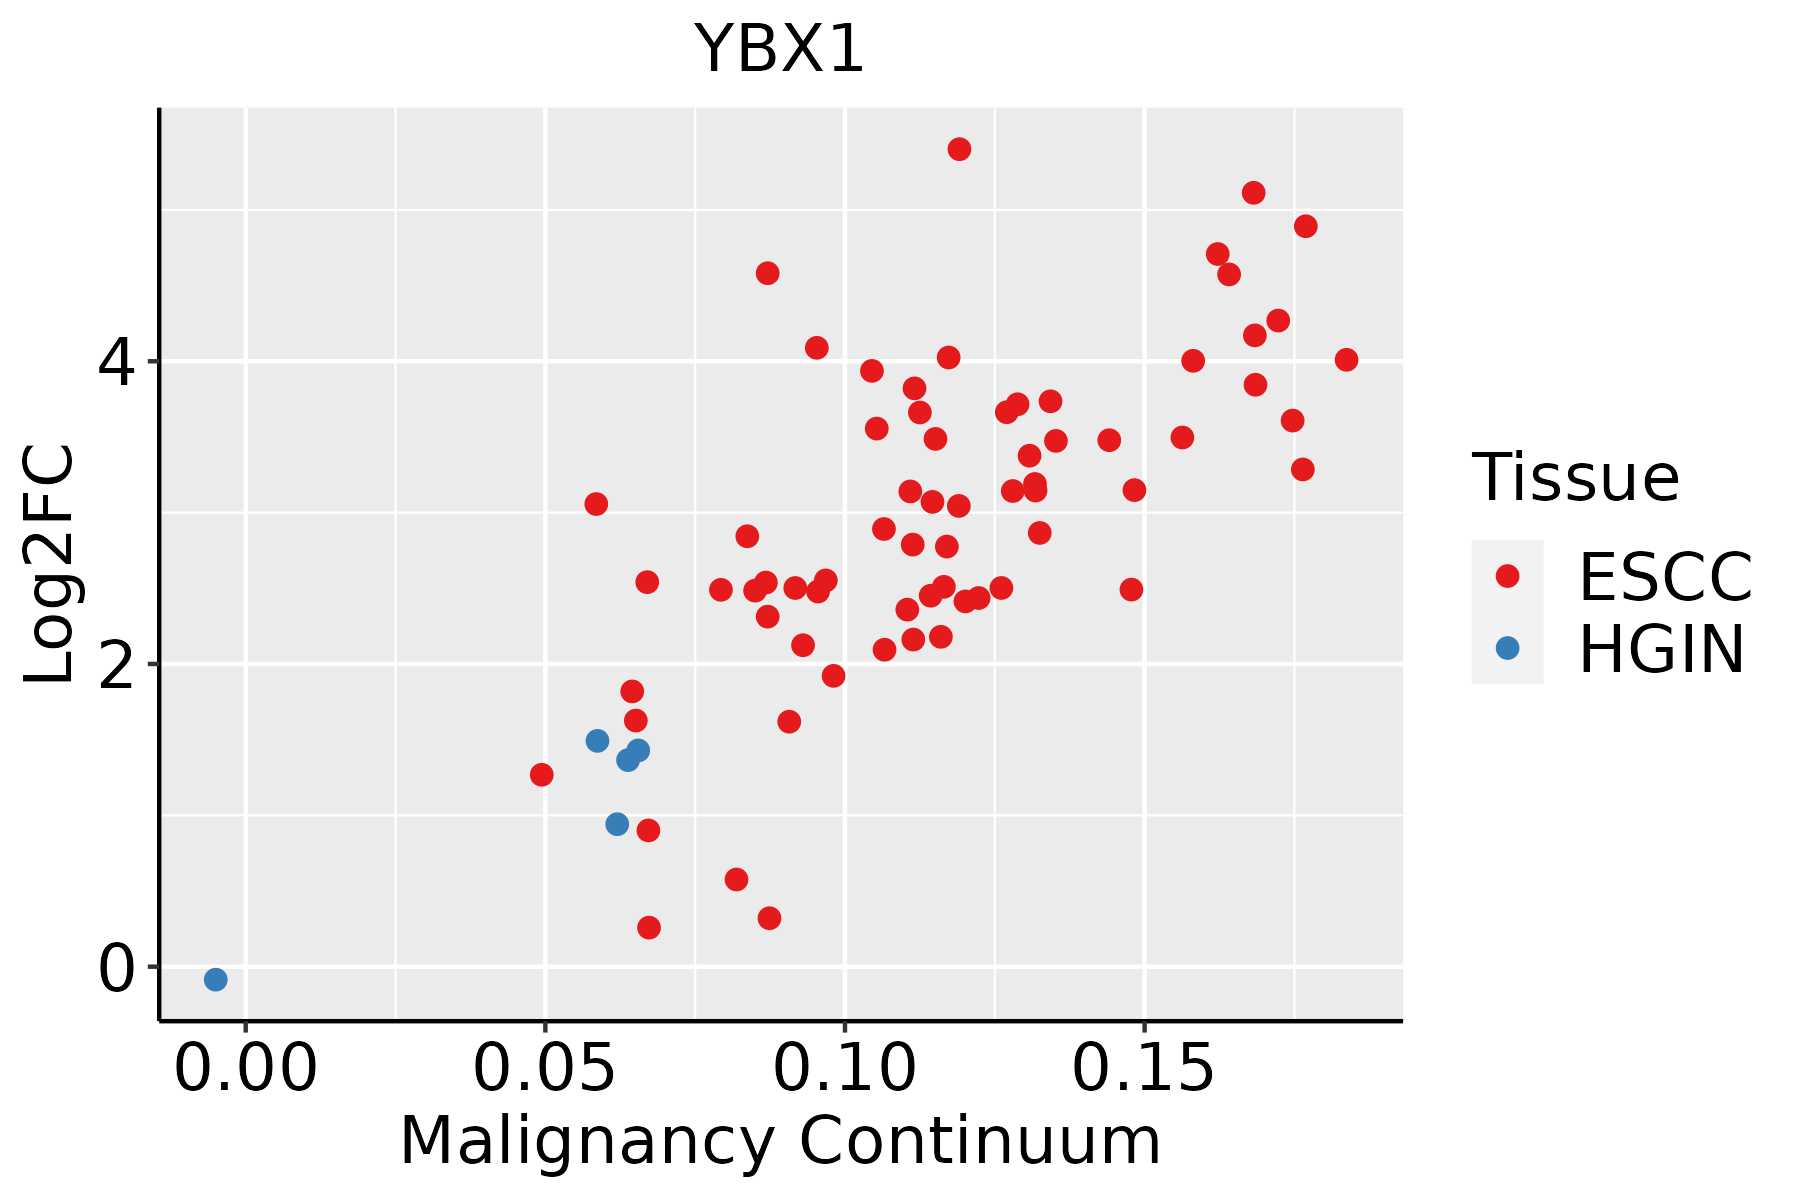 | ESCC: Esophageal squamous cell carcinoma |
| HGIN: High-grade intraepithelial neoplasias | ||
| LGIN: Low-grade intraepithelial neoplasias | ||
| GC | 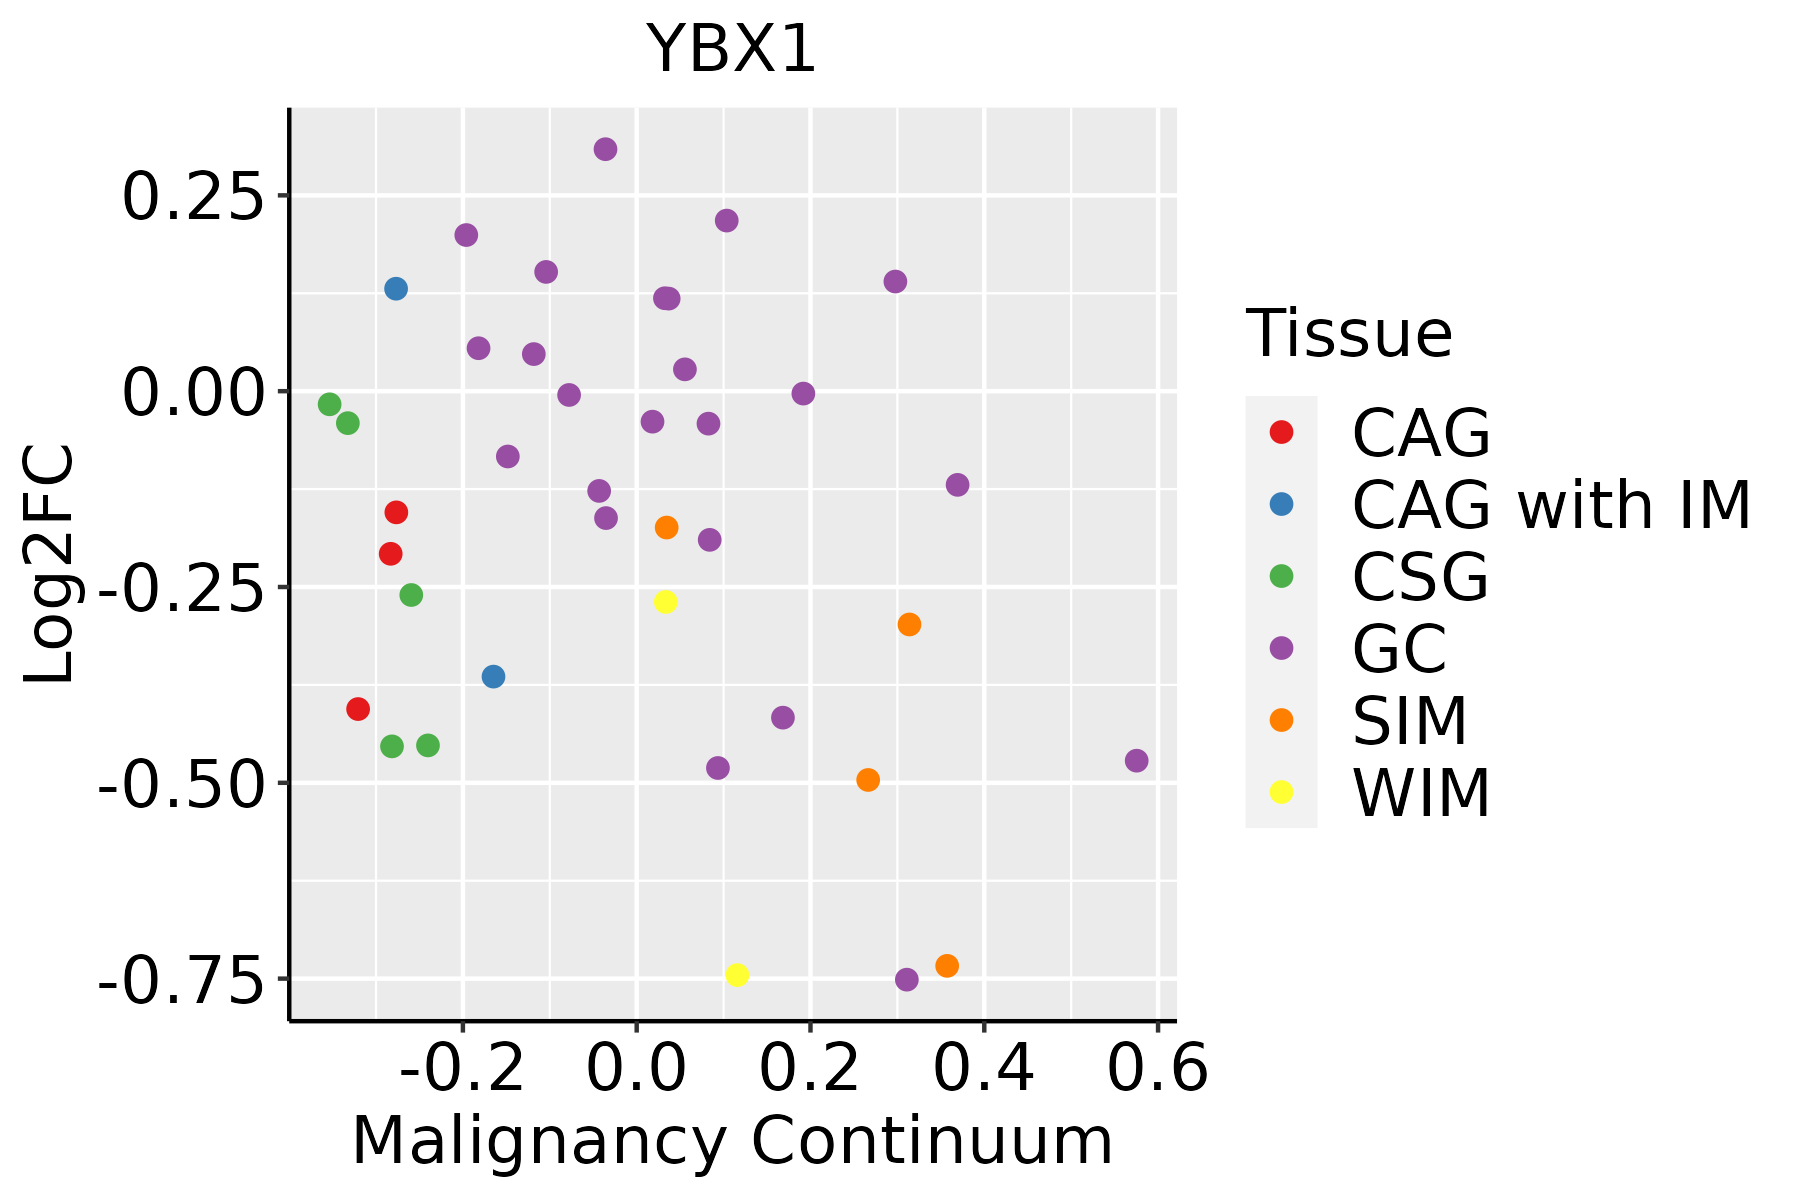 | CAG: Chronic atrophic gastritis |
| CAG with IM: Chronic atrophic gastritis with intestinal metaplasia | ||
| CSG: Chronic superficial gastritis | ||
| GC: Gastric cancer | ||
| SIM: Severe intestinal metaplasia | ||
| WIM: Wild intestinal metaplasia | ||
| Liver |  | HCC: Hepatocellular carcinoma |
| NAFLD: Non-alcoholic fatty liver disease | ||
| Oral Cavity | 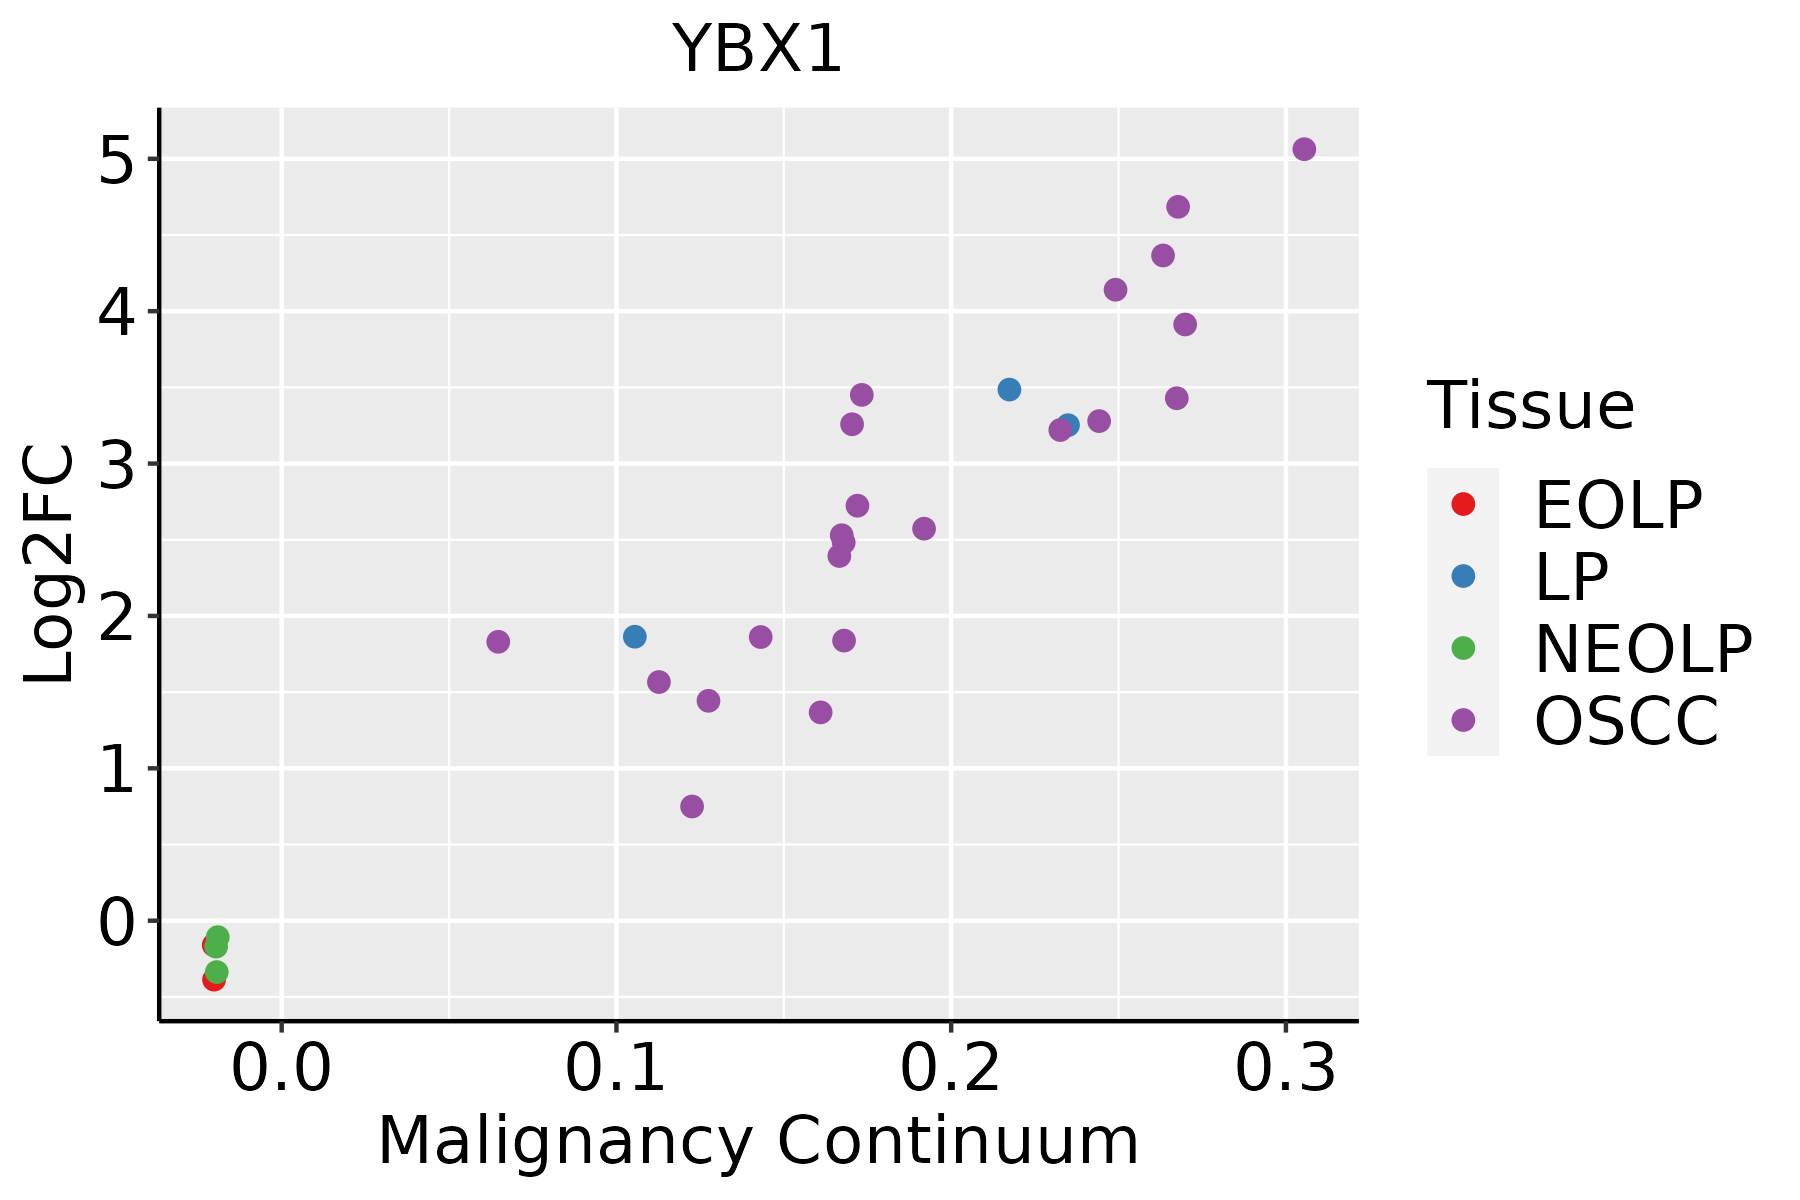 | EOLP: Erosive Oral lichen planus |
| LP: leukoplakia | ||
| NEOLP: Non-erosive oral lichen planus | ||
| OSCC: Oral squamous cell carcinoma | ||
| Prostate | 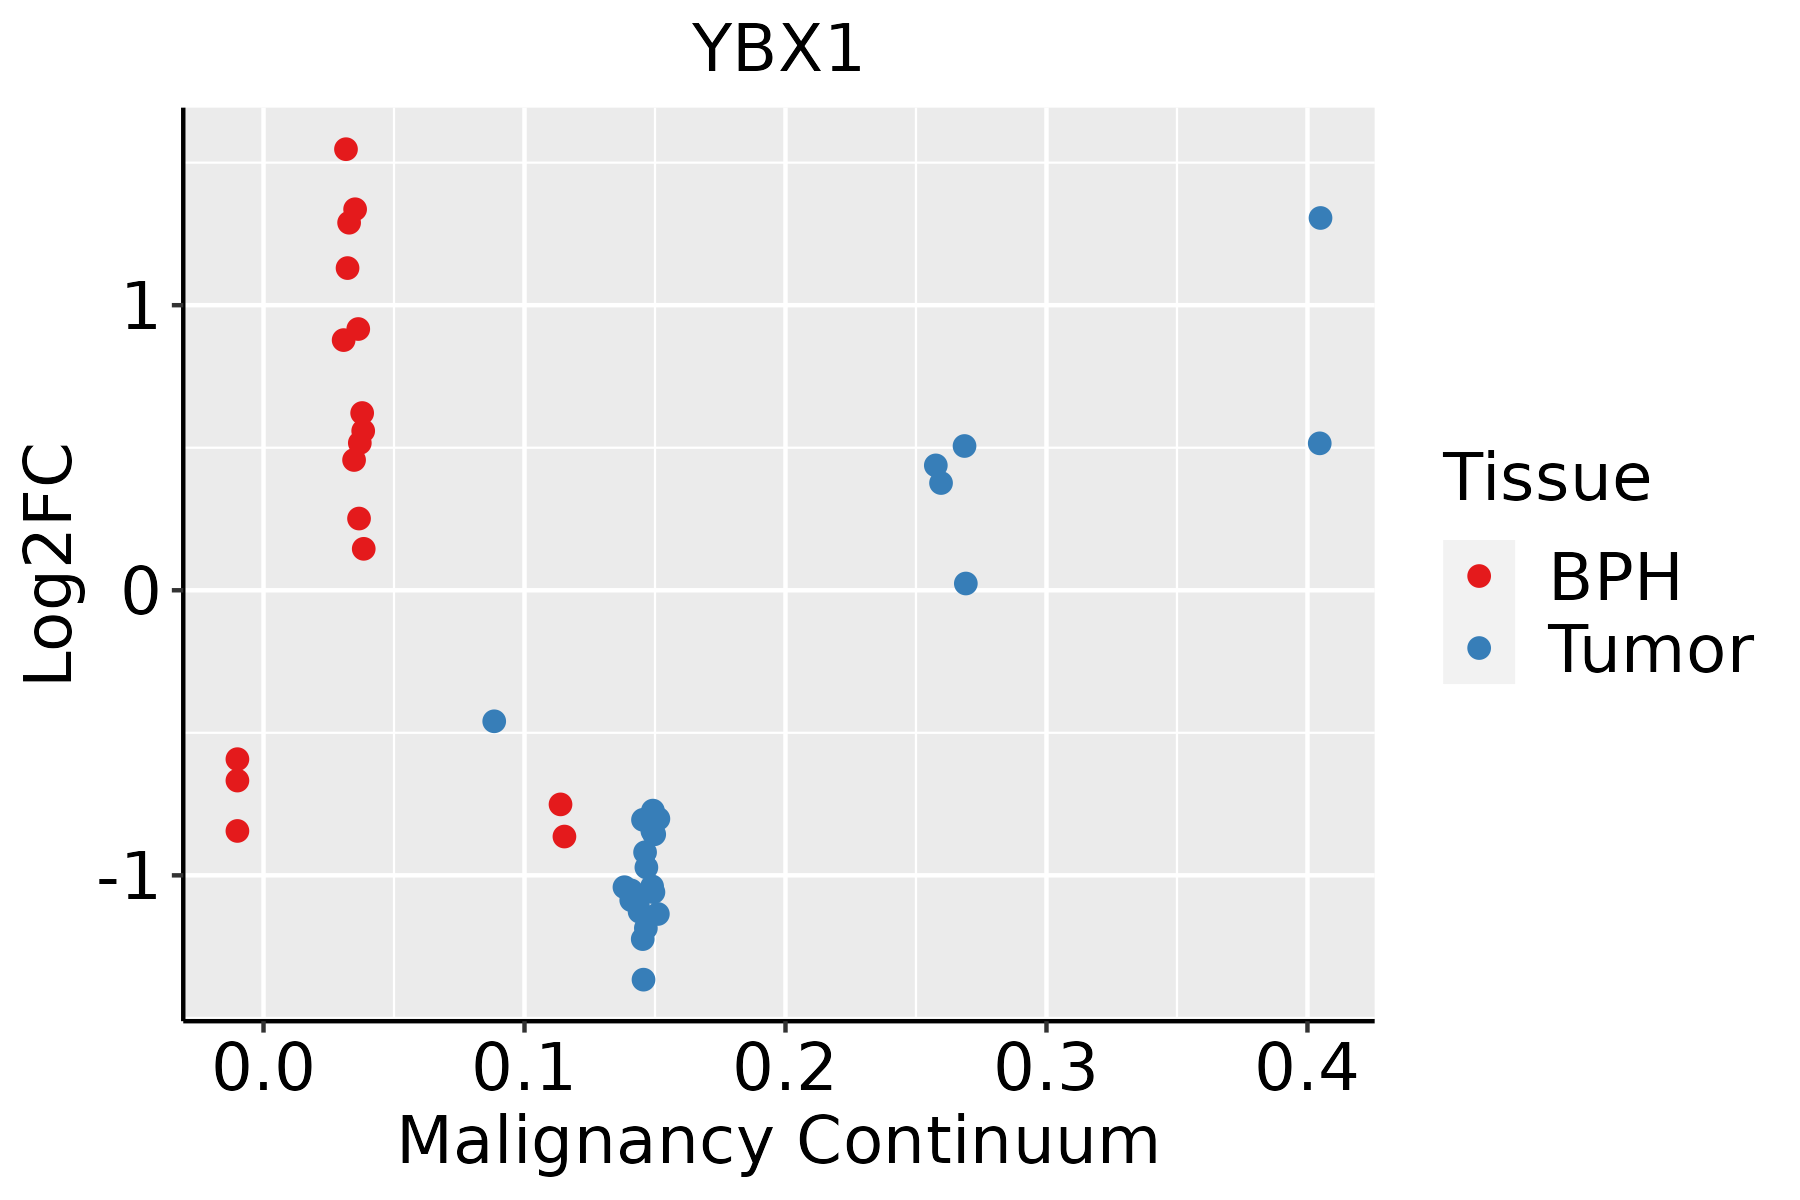 | BPH: Benign Prostatic Hyperplasia |
| Skin |  | AK: Actinic keratosis |
| cSCC: Cutaneous squamous cell carcinoma | ||
| SCCIS:squamous cell carcinoma in situ | ||
| Thyroid |  | ATC: Anaplastic thyroid cancer |
| HT: Hashimoto's thyroiditis | ||
| PTC: Papillary thyroid cancer |
| ∗log2FC in expression of this searched gene in stem-like cells from each diseased tissue sample relative to stem-like cells in normal samples in each tissue plotted against the malignancy continuum. Samples are colored based on if they are from different disease stage. |
Top |
Malignant transformation related pathway analysis |
| Find out the enriched GO biological processes and KEGG pathways involved in transition from healthy to precancer to cancer |
| Tissue | Disease Stage | Enriched GO biological Processes |
| Colorectum | AD |  |
| Colorectum | SER |  |
| Colorectum | MSS |  |
| Colorectum | MSI-H |  |
| Colorectum | FAP |  |
| ∗Top 15 enriched GO BP terms are showed in the bar plot of each disease state in each tissue. Each row represents a significant GO biological process which is colored according to the -log10(p.adjust). |
| Page: 1 2 3 4 5 6 7 8 9 |
| GO ID | Tissue | Disease Stage | Description | Gene Ratio | Bg Ratio | pvalue | p.adjust | Count |
| GO:00083809 | Breast | Precancer | RNA splicing | 65/1080 | 434/18723 | 1.27e-12 | 2.53e-10 | 65 |
| GO:00064179 | Breast | Precancer | regulation of translation | 67/1080 | 468/18723 | 4.71e-12 | 7.64e-10 | 67 |
| GO:19033118 | Breast | Precancer | regulation of mRNA metabolic process | 38/1080 | 288/18723 | 1.63e-06 | 5.97e-05 | 38 |
| GO:00075688 | Breast | Precancer | aging | 41/1080 | 339/18723 | 5.95e-06 | 1.71e-04 | 41 |
| GO:00313309 | Breast | Precancer | negative regulation of cellular catabolic process | 34/1080 | 262/18723 | 8.16e-06 | 2.20e-04 | 34 |
| GO:00064028 | Breast | Precancer | mRNA catabolic process | 31/1080 | 232/18723 | 1.12e-05 | 2.93e-04 | 31 |
| GO:00064018 | Breast | Precancer | RNA catabolic process | 34/1080 | 278/18723 | 2.88e-05 | 6.39e-04 | 34 |
| GO:19033129 | Breast | Precancer | negative regulation of mRNA metabolic process | 16/1080 | 92/18723 | 6.70e-05 | 1.35e-03 | 16 |
| GO:00098959 | Breast | Precancer | negative regulation of catabolic process | 36/1080 | 320/18723 | 9.92e-05 | 1.83e-03 | 36 |
| GO:00346558 | Breast | Precancer | nucleobase-containing compound catabolic process | 42/1080 | 407/18723 | 1.91e-04 | 3.06e-03 | 42 |
| GO:00085445 | Breast | Precancer | epidermis development | 35/1080 | 324/18723 | 2.71e-04 | 3.96e-03 | 35 |
| GO:00467007 | Breast | Precancer | heterocycle catabolic process | 44/1080 | 445/18723 | 3.49e-04 | 4.88e-03 | 44 |
| GO:00442708 | Breast | Precancer | cellular nitrogen compound catabolic process | 44/1080 | 451/18723 | 4.64e-04 | 6.12e-03 | 44 |
| GO:00194397 | Breast | Precancer | aromatic compound catabolic process | 44/1080 | 467/18723 | 9.55e-04 | 1.07e-02 | 44 |
| GO:00987608 | Breast | Precancer | response to interleukin-7 | 5/1080 | 15/18723 | 1.17e-03 | 1.26e-02 | 5 |
| GO:00987618 | Breast | Precancer | cellular response to interleukin-7 | 5/1080 | 15/18723 | 1.17e-03 | 1.26e-02 | 5 |
| GO:00064039 | Breast | Precancer | RNA localization | 23/1080 | 201/18723 | 1.34e-03 | 1.41e-02 | 23 |
| GO:00075694 | Breast | Precancer | cell aging | 17/1080 | 132/18723 | 1.55e-03 | 1.59e-02 | 17 |
| GO:19013617 | Breast | Precancer | organic cyclic compound catabolic process | 45/1080 | 495/18723 | 1.73e-03 | 1.74e-02 | 45 |
| GO:00434888 | Breast | Precancer | regulation of mRNA stability | 19/1080 | 158/18723 | 1.92e-03 | 1.86e-02 | 19 |
| Page: 1 2 3 4 5 6 7 8 9 10 11 12 13 14 15 16 17 18 19 20 21 22 23 24 25 26 27 28 29 30 31 32 33 34 35 36 37 38 39 40 41 42 43 44 45 46 |
| Pathway ID | Tissue | Disease Stage | Description | Gene Ratio | Bg Ratio | pvalue | p.adjust | qvalue | Count |
| Page: 1 |
Top |
Cell-cell communication analysis |
| Identification of potential cell-cell interactions between two cell types and their ligand-receptor pairs for different disease states |
| Ligand | Receptor | LRpair | Pathway | Tissue | Disease Stage |
| Page: 1 |
Top |
Single-cell gene regulatory network inference analysis |
| Find out the significant the regulons (TFs) and the target genes of each regulon across cell types for different disease states |
| TF | Cell Type | Tissue | Disease Stage | Target Gene | RSS | Regulon Activity |
| YBX1 | STM | Cervix | CC | RPL35,MRPL12,RPS5, etc. | 1.28e-01 |  |
| YBX1 | EE | Colorectum | CRC | WDR47,METTL23,WBP2, etc. | 3.01e-03 |  |
| YBX1 | PRO | Esophagus | Healthy | NDUFS8,NDUFA4,POLR2E, etc. | 2.02e-01 |  |
| YBX1 | NEUT | Esophagus | Healthy | ARHGEF1,INSIG1,TMSB10, etc. | 6.98e-01 | |
| YBX1 | cDC | Prostate | ADJ | FTH1,OAZ1,TMSB4X, etc. | 1.66e-01 |  |
| ∗The dot plots of a searched regulon are shown for all cell subpopulations in each disease state of each tissue based on the regulon specific score inferred using pySCENIC and by calculating the average expression. |
| Page: 1 |
Top |
Somatic mutation of malignant transformation related genes |
| Annotation of somatic variants for genes involved in malignant transformation |
| Hugo Symbol | Variant Class | Variant Classification | dbSNP RS | HGVSc | HGVSp | HGVSp Short | SWISSPROT | BIOTYPE | SIFT | PolyPhen | Tumor Sample Barcode | Tissue | Histology | Sex | Age | Stage | Therapy Types | Drugs | Outcome |
| YBX1 | SNV | Missense_Mutation | c.797A>G | p.Asn266Ser | p.N266S | P67809 | protein_coding | tolerated(0.06) | possibly_damaging(0.824) | TCGA-A2-A1G4-01 | Breast | breast invasive carcinoma | Female | >=65 | III/IV | Chemotherapy | adriamycin | SD | |
| YBX1 | SNV | Missense_Mutation | c.269N>T | p.Ala90Val | p.A90V | P67809 | protein_coding | deleterious(0.01) | probably_damaging(0.983) | TCGA-A8-A09Z-01 | Breast | breast invasive carcinoma | Female | >=65 | I/II | Unknown | Unknown | SD | |
| YBX1 | SNV | Missense_Mutation | c.725G>C | p.Arg242Thr | p.R242T | P67809 | protein_coding | deleterious(0.01) | benign(0.351) | TCGA-C5-A2LX-01 | Cervix | cervical & endocervical cancer | Female | <65 | I/II | Chemotherapy | cisplatin | SD | |
| YBX1 | SNV | Missense_Mutation | rs780773403 | c.611N>A | p.Arg204His | p.R204H | P67809 | protein_coding | tolerated(0.26) | benign(0.011) | TCGA-EA-A3HS-01 | Cervix | cervical & endocervical cancer | Female | <65 | I/II | Unknown | Unknown | SD |
| YBX1 | SNV | Missense_Mutation | novel | c.193T>G | p.Trp65Gly | p.W65G | P67809 | protein_coding | deleterious(0) | benign(0.096) | TCGA-AA-A00N-01 | Colorectum | colon adenocarcinoma | Male | >=65 | I/II | Unknown | Unknown | PD |
| YBX1 | SNV | Missense_Mutation | rs141968223 | c.938C>T | p.Ser313Leu | p.S313L | P67809 | protein_coding | tolerated(0.19) | benign(0.003) | TCGA-AA-A00N-01 | Colorectum | colon adenocarcinoma | Male | >=65 | I/II | Unknown | Unknown | PD |
| YBX1 | SNV | Missense_Mutation | c.872N>A | p.Arg291His | p.R291H | P67809 | protein_coding | tolerated(0.22) | benign(0) | TCGA-G4-6588-01 | Colorectum | colon adenocarcinoma | Female | <65 | I/II | Unknown | Unknown | SD | |
| YBX1 | SNV | Missense_Mutation | novel | c.610N>T | p.Arg204Cys | p.R204C | P67809 | protein_coding | tolerated(0.19) | possibly_damaging(0.898) | TCGA-A5-A0G2-01 | Endometrium | uterine corpus endometrioid carcinoma | Female | <65 | III/IV | Unknown | Unknown | SD |
| YBX1 | SNV | Missense_Mutation | rs141968223 | c.938N>T | p.Ser313Leu | p.S313L | P67809 | protein_coding | tolerated(0.19) | benign(0.003) | TCGA-A5-A0G2-01 | Endometrium | uterine corpus endometrioid carcinoma | Female | <65 | III/IV | Unknown | Unknown | SD |
| YBX1 | SNV | Missense_Mutation | c.758N>C | p.Arg253Thr | p.R253T | P67809 | protein_coding | deleterious(0.04) | probably_damaging(0.987) | TCGA-A5-A0VP-01 | Endometrium | uterine corpus endometrioid carcinoma | Female | >=65 | I/II | Unknown | Unknown | SD |
| Page: 1 2 3 4 |
Top |
Related drugs of malignant transformation related genes |
| Identification of chemicals and drugs interact with genes involved in malignant transfromation |
| (DGIdb 4.0) |
| Entrez ID | Symbol | Category | Interaction Types | Drug Claim Name | Drug Name | PMIDs |
| Page: 1 |

Copyright 2023-Present -The University of Texas Health Science Center at Houston |