
|
|||||
|
 | |
| |
| |
| |
| |
| |
|
Gene: YARS2 |
Gene summary for YARS2 |
| Gene information | Species | Human | Gene symbol | YARS2 | Gene ID | 51067 |
| Gene name | tyrosyl-tRNA synthetase 2 | |
| Gene Alias | CGI-04 | |
| Cytomap | 12p11.21 | |
| Gene Type | protein-coding | GO ID | GO:0000959 | UniProtAcc | Q9Y2Z4 |
Top |
Malignant transformation analysis |
| Identification of the aberrant gene expression in precancerous and cancerous lesions by comparing the gene expression of stem-like cells in diseased tissues with normal stem cells |
| Entrez ID | Symbol | Replicates | Species | Organ | Tissue | Adj P-value | Log2FC | Malignancy |
| 51067 | YARS2 | LZE7T | Human | Esophagus | ESCC | 2.71e-09 | 4.47e-01 | 0.0667 |
| 51067 | YARS2 | LZE8T | Human | Esophagus | ESCC | 4.34e-06 | 2.37e-01 | 0.067 |
| 51067 | YARS2 | LZE24T | Human | Esophagus | ESCC | 2.14e-06 | 2.52e-01 | 0.0596 |
| 51067 | YARS2 | P1T-E | Human | Esophagus | ESCC | 3.29e-02 | 2.54e-01 | 0.0875 |
| 51067 | YARS2 | P2T-E | Human | Esophagus | ESCC | 3.14e-23 | 5.44e-01 | 0.1177 |
| 51067 | YARS2 | P4T-E | Human | Esophagus | ESCC | 2.48e-25 | 6.50e-01 | 0.1323 |
| 51067 | YARS2 | P5T-E | Human | Esophagus | ESCC | 1.60e-16 | 4.33e-01 | 0.1327 |
| 51067 | YARS2 | P8T-E | Human | Esophagus | ESCC | 1.51e-11 | 2.66e-01 | 0.0889 |
| 51067 | YARS2 | P9T-E | Human | Esophagus | ESCC | 1.90e-12 | 1.56e-01 | 0.1131 |
| 51067 | YARS2 | P10T-E | Human | Esophagus | ESCC | 1.98e-27 | 4.47e-01 | 0.116 |
| 51067 | YARS2 | P11T-E | Human | Esophagus | ESCC | 7.82e-11 | 4.55e-01 | 0.1426 |
| 51067 | YARS2 | P12T-E | Human | Esophagus | ESCC | 7.14e-31 | 7.37e-01 | 0.1122 |
| 51067 | YARS2 | P15T-E | Human | Esophagus | ESCC | 9.75e-19 | 4.58e-01 | 0.1149 |
| 51067 | YARS2 | P16T-E | Human | Esophagus | ESCC | 3.67e-27 | 3.91e-01 | 0.1153 |
| 51067 | YARS2 | P17T-E | Human | Esophagus | ESCC | 1.60e-04 | 2.25e-01 | 0.1278 |
| 51067 | YARS2 | P19T-E | Human | Esophagus | ESCC | 7.40e-07 | 4.32e-01 | 0.1662 |
| 51067 | YARS2 | P20T-E | Human | Esophagus | ESCC | 1.01e-13 | 3.47e-01 | 0.1124 |
| 51067 | YARS2 | P21T-E | Human | Esophagus | ESCC | 3.59e-14 | 3.33e-01 | 0.1617 |
| 51067 | YARS2 | P22T-E | Human | Esophagus | ESCC | 1.65e-67 | 1.17e+00 | 0.1236 |
| 51067 | YARS2 | P23T-E | Human | Esophagus | ESCC | 6.96e-17 | 3.72e-01 | 0.108 |
| Page: 1 2 3 4 5 |
| Tissue | Expression Dynamics | Abbreviation |
| Esophagus |  | ESCC: Esophageal squamous cell carcinoma |
| HGIN: High-grade intraepithelial neoplasias | ||
| LGIN: Low-grade intraepithelial neoplasias | ||
| Oral Cavity | 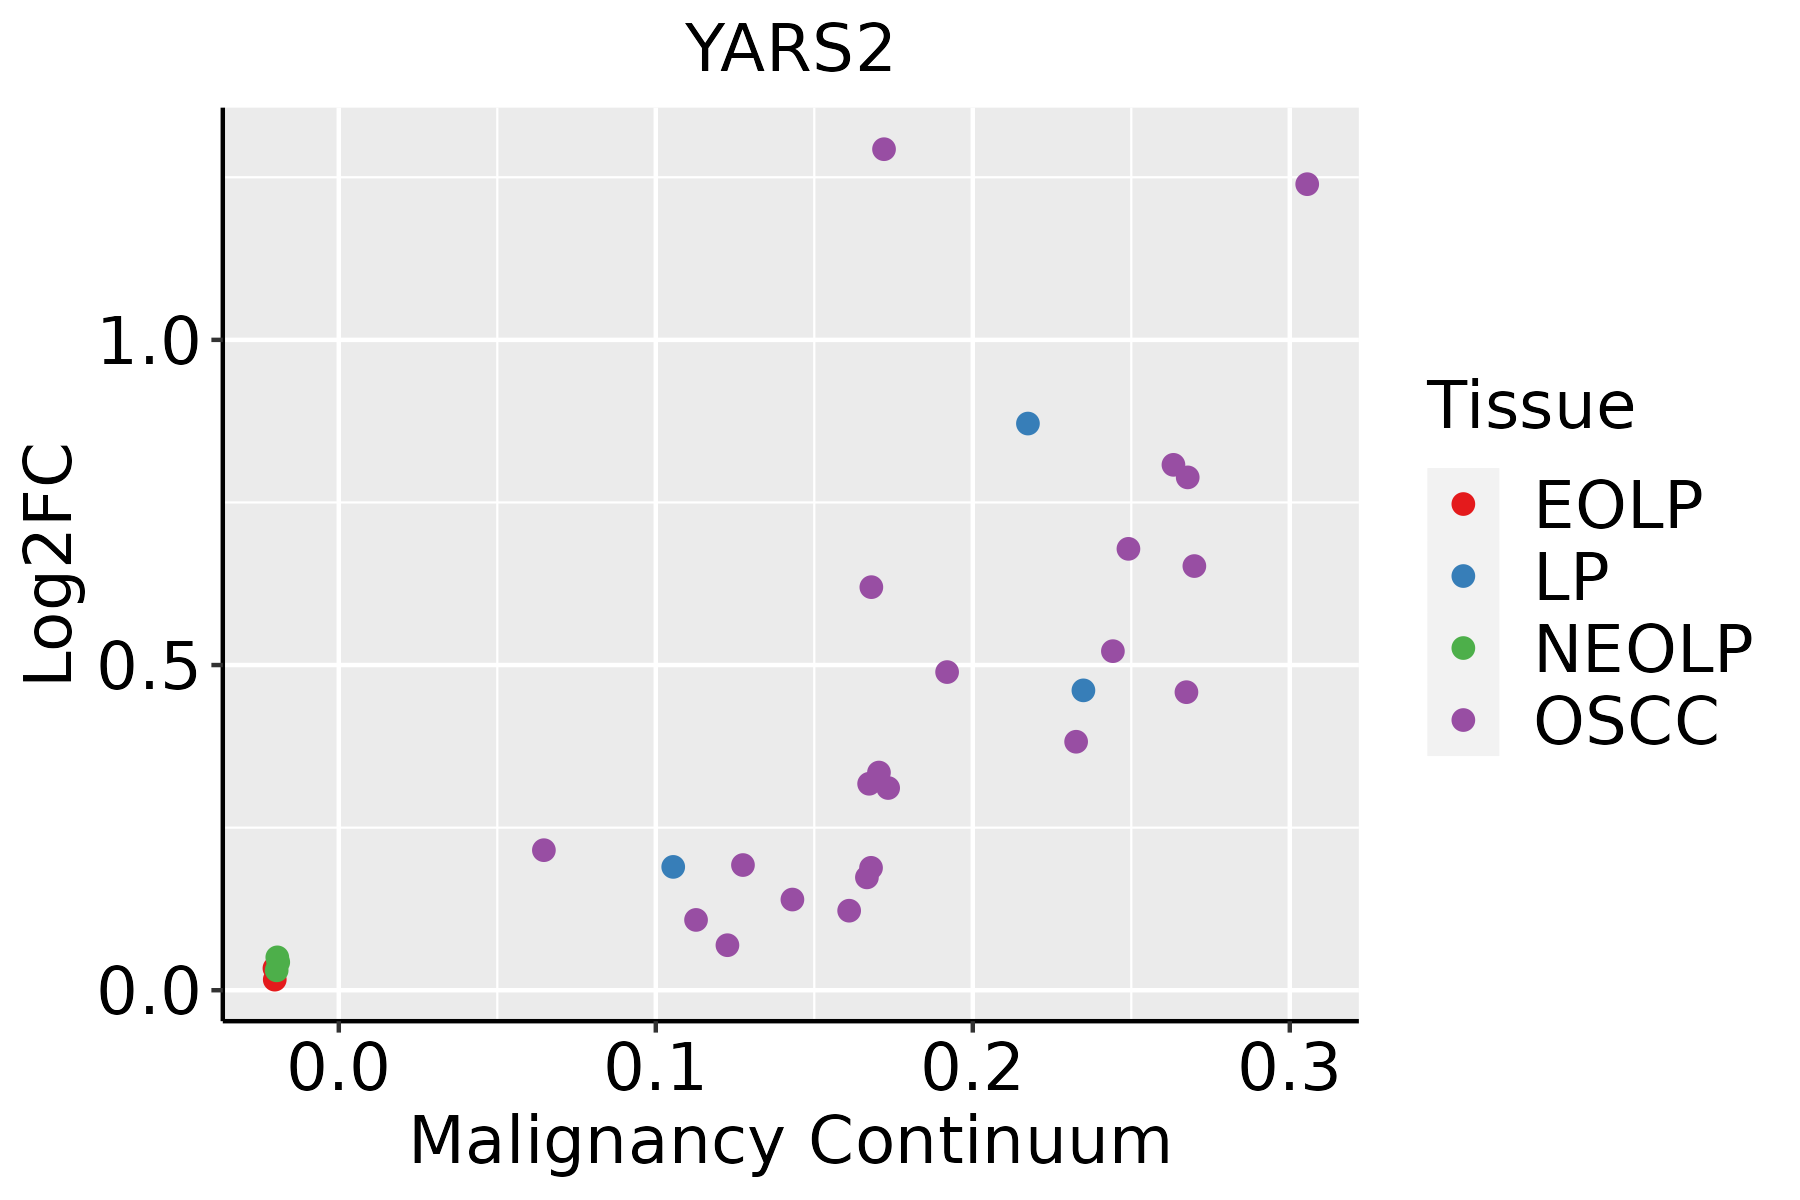 | EOLP: Erosive Oral lichen planus |
| LP: leukoplakia | ||
| NEOLP: Non-erosive oral lichen planus | ||
| OSCC: Oral squamous cell carcinoma | ||
| Skin | 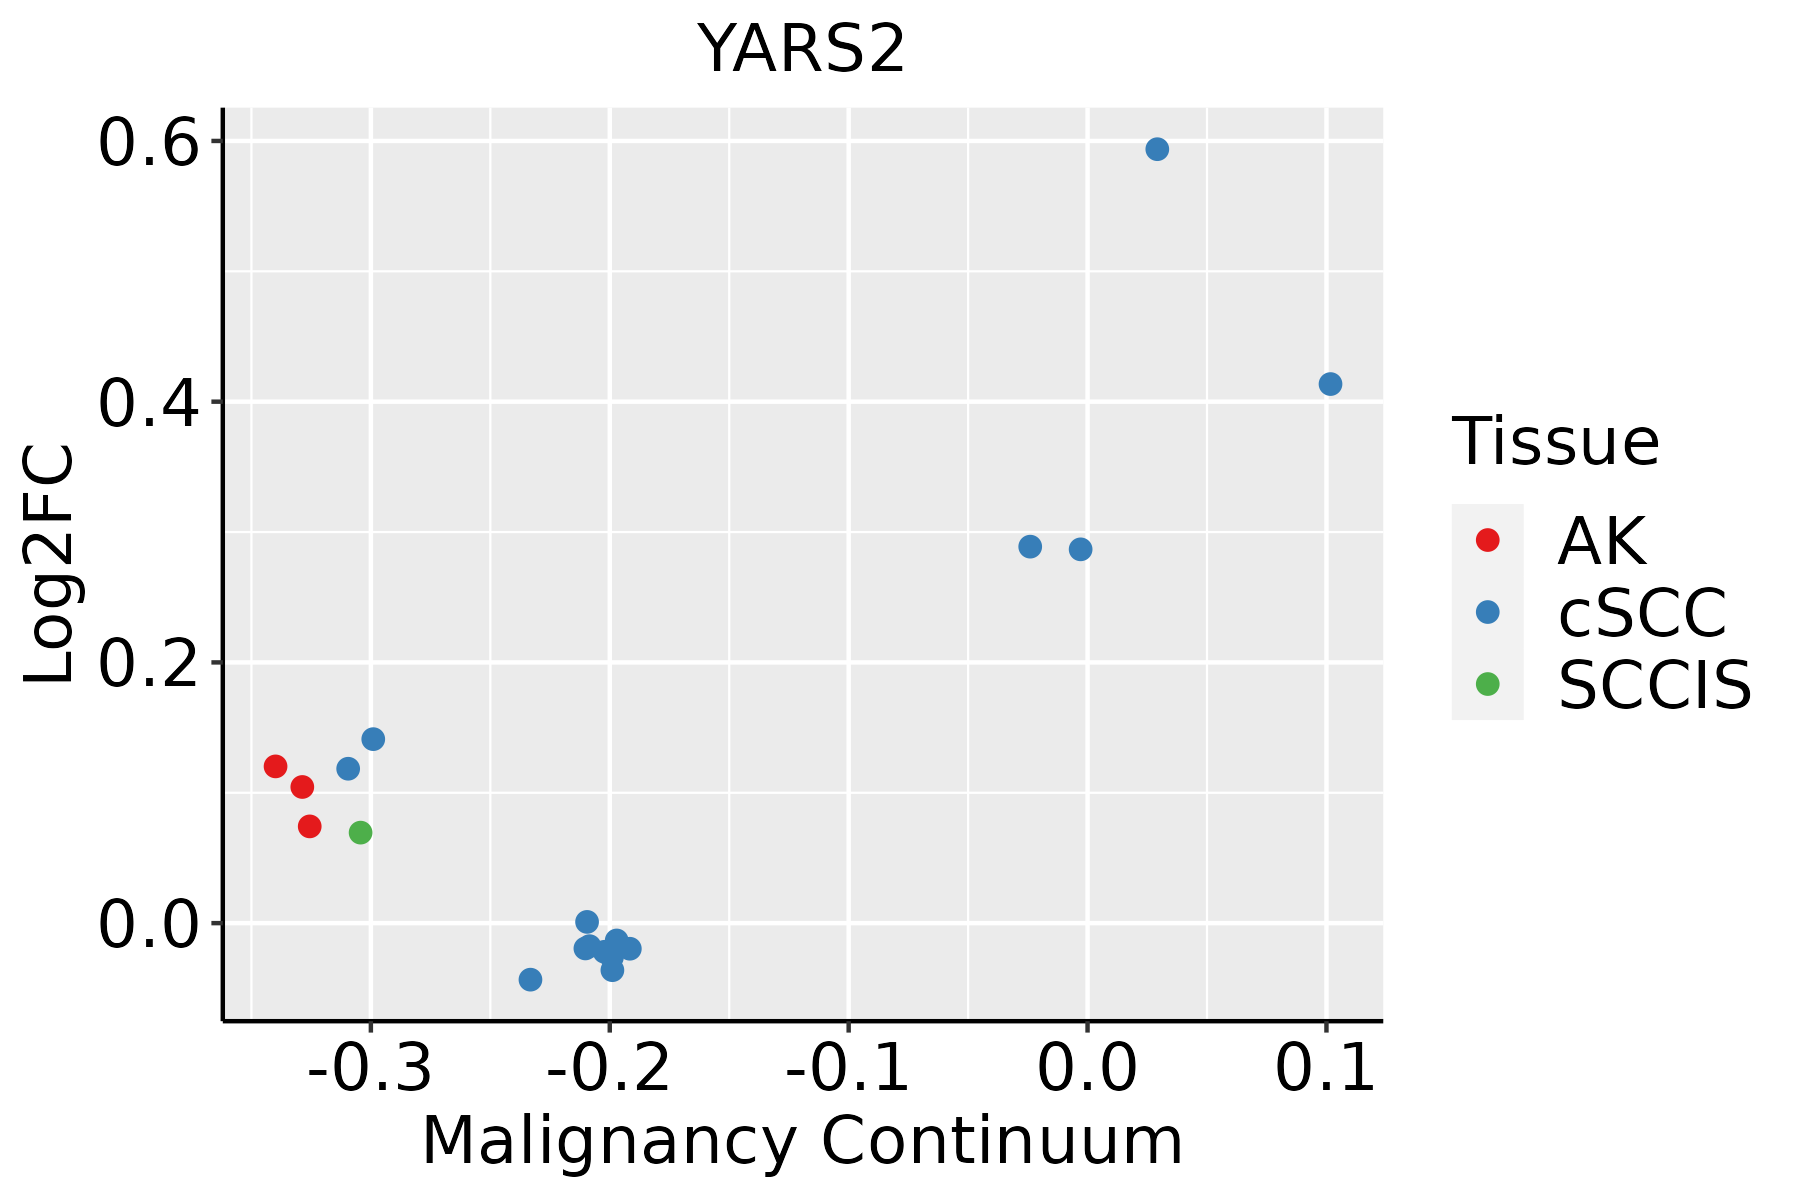 | AK: Actinic keratosis |
| cSCC: Cutaneous squamous cell carcinoma | ||
| SCCIS:squamous cell carcinoma in situ |
| ∗log2FC in expression of this searched gene in stem-like cells from each diseased tissue sample relative to stem-like cells in normal samples in each tissue plotted against the malignancy continuum. Samples are colored based on if they are from different disease stage. |
Top |
Malignant transformation related pathway analysis |
| Find out the enriched GO biological processes and KEGG pathways involved in transition from healthy to precancer to cancer |
| Tissue | Disease Stage | Enriched GO biological Processes |
| Colorectum | AD |  |
| Colorectum | SER |  |
| Colorectum | MSS |  |
| Colorectum | MSI-H |  |
| Colorectum | FAP |  |
| ∗Top 15 enriched GO BP terms are showed in the bar plot of each disease state in each tissue. Each row represents a significant GO biological process which is colored according to the -log10(p.adjust). |
| Page: 1 2 3 4 5 6 7 8 9 |
| GO ID | Tissue | Disease Stage | Description | Gene Ratio | Bg Ratio | pvalue | p.adjust | Count |
| GO:003466012 | Esophagus | ESCC | ncRNA metabolic process | 346/8552 | 485/18723 | 4.35e-31 | 2.51e-28 | 346 |
| GO:014005313 | Esophagus | ESCC | mitochondrial gene expression | 93/8552 | 108/18723 | 1.96e-18 | 2.03e-16 | 93 |
| GO:003254314 | Esophagus | ESCC | mitochondrial translation | 68/8552 | 76/18723 | 1.02e-15 | 6.86e-14 | 68 |
| GO:00063992 | Esophagus | ESCC | tRNA metabolic process | 122/8552 | 179/18723 | 9.03e-10 | 2.19e-08 | 122 |
| GO:00009592 | Esophagus | ESCC | mitochondrial RNA metabolic process | 39/8552 | 49/18723 | 1.20e-06 | 1.49e-05 | 39 |
| GO:00346605 | Oral cavity | OSCC | ncRNA metabolic process | 296/7305 | 485/18723 | 2.94e-23 | 6.65e-21 | 296 |
| GO:01400533 | Oral cavity | OSCC | mitochondrial gene expression | 78/7305 | 108/18723 | 2.37e-12 | 9.86e-11 | 78 |
| GO:00325434 | Oral cavity | OSCC | mitochondrial translation | 59/7305 | 76/18723 | 7.21e-12 | 2.70e-10 | 59 |
| GO:00063991 | Oral cavity | OSCC | tRNA metabolic process | 101/7305 | 179/18723 | 1.65e-06 | 2.15e-05 | 101 |
| GO:00009591 | Oral cavity | OSCC | mitochondrial RNA metabolic process | 29/7305 | 49/18723 | 3.33e-03 | 1.42e-02 | 29 |
| GO:003466011 | Oral cavity | LP | ncRNA metabolic process | 205/4623 | 485/18723 | 6.46e-18 | 1.09e-15 | 205 |
| GO:003254313 | Oral cavity | LP | mitochondrial translation | 43/4623 | 76/18723 | 2.85e-09 | 1.26e-07 | 43 |
| GO:014005312 | Oral cavity | LP | mitochondrial gene expression | 53/4623 | 108/18723 | 3.54e-08 | 1.27e-06 | 53 |
| GO:003466013 | Skin | cSCC | ncRNA metabolic process | 234/4864 | 485/18723 | 1.37e-26 | 4.77e-24 | 234 |
| GO:00325436 | Skin | cSCC | mitochondrial translation | 47/4864 | 76/18723 | 4.70e-11 | 2.22e-09 | 47 |
| GO:01400535 | Skin | cSCC | mitochondrial gene expression | 56/4864 | 108/18723 | 8.06e-09 | 2.56e-07 | 56 |
| GO:00063993 | Skin | cSCC | tRNA metabolic process | 64/4864 | 179/18723 | 2.34e-03 | 1.36e-02 | 64 |
| Page: 1 |
| Pathway ID | Tissue | Disease Stage | Description | Gene Ratio | Bg Ratio | pvalue | p.adjust | qvalue | Count |
| Page: 1 |
Top |
Cell-cell communication analysis |
| Identification of potential cell-cell interactions between two cell types and their ligand-receptor pairs for different disease states |
| Ligand | Receptor | LRpair | Pathway | Tissue | Disease Stage |
| Page: 1 |
Top |
Single-cell gene regulatory network inference analysis |
| Find out the significant the regulons (TFs) and the target genes of each regulon across cell types for different disease states |
| TF | Cell Type | Tissue | Disease Stage | Target Gene | RSS | Regulon Activity |
| ∗The dot plots of a searched regulon are shown for all cell subpopulations in each disease state of each tissue based on the regulon specific score inferred using pySCENIC and by calculating the average expression. |
| Page: 1 |
Top |
Somatic mutation of malignant transformation related genes |
| Annotation of somatic variants for genes involved in malignant transformation |
| Hugo Symbol | Variant Class | Variant Classification | dbSNP RS | HGVSc | HGVSp | HGVSp Short | SWISSPROT | BIOTYPE | SIFT | PolyPhen | Tumor Sample Barcode | Tissue | Histology | Sex | Age | Stage | Therapy Types | Drugs | Outcome |
| YARS2 | SNV | Missense_Mutation | rs377140710 | c.991C>T | p.His331Tyr | p.H331Y | Q9Y2Z4 | protein_coding | tolerated(0.11) | benign(0.013) | TCGA-EW-A1IZ-01 | Breast | breast invasive carcinoma | Female | <65 | III/IV | Chemotherapy | taxotere | SD |
| YARS2 | SNV | Missense_Mutation | rs776972394 | c.895N>G | p.Pro299Ala | p.P299A | Q9Y2Z4 | protein_coding | tolerated(0.1) | possibly_damaging(0.477) | TCGA-EA-A43B-01 | Cervix | cervical & endocervical cancer | Female | <65 | I/II | Chemotherapy | cisplatin | CR |
| YARS2 | SNV | Missense_Mutation | novel | c.1052C>A | p.Ala351Glu | p.A351E | Q9Y2Z4 | protein_coding | tolerated(1) | benign(0.011) | TCGA-GH-A9DA-01 | Cervix | cervical & endocervical cancer | Female | <65 | I/II | Unknown | Unknown | SD |
| YARS2 | SNV | Missense_Mutation | novel | c.634N>A | p.Glu212Lys | p.E212K | Q9Y2Z4 | protein_coding | tolerated(0.1) | benign(0.296) | TCGA-VS-A959-01 | Cervix | cervical & endocervical cancer | Female | >=65 | I/II | Unknown | Unknown | SD |
| YARS2 | SNV | Missense_Mutation | novel | c.1135N>A | p.Asp379Asn | p.D379N | Q9Y2Z4 | protein_coding | deleterious(0.04) | benign(0.07) | TCGA-ZJ-AAXU-01 | Cervix | cervical & endocervical cancer | Female | <65 | I/II | Unknown | Unknown | SD |
| YARS2 | SNV | Missense_Mutation | c.906G>T | p.Leu302Phe | p.L302F | Q9Y2Z4 | protein_coding | tolerated(0.2) | benign(0.075) | TCGA-AA-3680-01 | Colorectum | colon adenocarcinoma | Female | >=65 | III/IV | Chemotherapy | folinic | PD | |
| YARS2 | SNV | Missense_Mutation | rs751333207 | c.1231G>A | p.Asp411Asn | p.D411N | Q9Y2Z4 | protein_coding | deleterious(0.02) | benign(0.12) | TCGA-AA-3831-01 | Colorectum | colon adenocarcinoma | Male | >=65 | I/II | Unknown | Unknown | SD |
| YARS2 | SNV | Missense_Mutation | rs754852058 | c.1400N>T | p.Arg467Ile | p.R467I | Q9Y2Z4 | protein_coding | deleterious(0) | possibly_damaging(0.794) | TCGA-AA-A00N-01 | Colorectum | colon adenocarcinoma | Male | >=65 | I/II | Unknown | Unknown | PD |
| YARS2 | SNV | Missense_Mutation | rs762786998 | c.1241N>A | p.Arg414His | p.R414H | Q9Y2Z4 | protein_coding | tolerated(0.38) | benign(0.007) | TCGA-AA-A01I-01 | Colorectum | colon adenocarcinoma | Male | >=65 | I/II | Unknown | Unknown | SD |
| YARS2 | SNV | Missense_Mutation | c.1280N>T | p.Arg427Leu | p.R427L | Q9Y2Z4 | protein_coding | deleterious(0.02) | benign(0.06) | TCGA-AA-A02E-01 | Colorectum | colon adenocarcinoma | Female | >=65 | III/IV | Unknown | Unknown | PD |
| Page: 1 2 3 4 5 6 |
Top |
Related drugs of malignant transformation related genes |
| Identification of chemicals and drugs interact with genes involved in malignant transfromation |
| (DGIdb 4.0) |
| Entrez ID | Symbol | Category | Interaction Types | Drug Claim Name | Drug Name | PMIDs |
| Page: 1 |

Copyright 2023-Present -The University of Texas Health Science Center at Houston |