
|
|||||
|
 | |
| |
| |
| |
| |
| |
|
Gene: YAP1 |
Gene summary for YAP1 |
| Gene information | Species | Human | Gene symbol | YAP1 | Gene ID | 10413 |
| Gene name | Yes1 associated transcriptional regulator | |
| Gene Alias | COB1 | |
| Cytomap | 11q22.1 | |
| Gene Type | protein-coding | GO ID | GO:0000122 | UniProtAcc | P46937 |
Top |
Malignant transformation analysis |
| Identification of the aberrant gene expression in precancerous and cancerous lesions by comparing the gene expression of stem-like cells in diseased tissues with normal stem cells |
| Entrez ID | Symbol | Replicates | Species | Organ | Tissue | Adj P-value | Log2FC | Malignancy |
| 10413 | YAP1 | CA_HPV_1 | Human | Cervix | CC | 4.13e-06 | -1.97e-01 | 0.0264 |
| 10413 | YAP1 | CCI_1 | Human | Cervix | CC | 2.87e-03 | 5.68e-01 | 0.528 |
| 10413 | YAP1 | CCI_2 | Human | Cervix | CC | 5.61e-10 | 1.35e+00 | 0.5249 |
| 10413 | YAP1 | CCI_3 | Human | Cervix | CC | 4.19e-11 | 9.46e-01 | 0.516 |
| 10413 | YAP1 | Tumor | Human | Cervix | CC | 7.30e-03 | 2.04e-01 | 0.1241 |
| 10413 | YAP1 | sample3 | Human | Cervix | CC | 2.40e-19 | 3.86e-01 | 0.1387 |
| 10413 | YAP1 | T3 | Human | Cervix | CC | 3.17e-09 | 3.18e-01 | 0.1389 |
| 10413 | YAP1 | HTA11_99999965104_69814 | Human | Colorectum | MSS | 6.89e-05 | 6.31e-01 | 0.281 |
| 10413 | YAP1 | HTA11_99999973899_84307 | Human | Colorectum | MSS | 6.72e-03 | -5.22e-01 | 0.2585 |
| 10413 | YAP1 | F007 | Human | Colorectum | FAP | 2.23e-05 | 2.27e-01 | 0.1176 |
| 10413 | YAP1 | A001-C-207 | Human | Colorectum | FAP | 1.07e-06 | 1.61e-01 | 0.1278 |
| 10413 | YAP1 | A015-C-203 | Human | Colorectum | FAP | 7.02e-32 | -3.39e-01 | -0.1294 |
| 10413 | YAP1 | A015-C-204 | Human | Colorectum | FAP | 3.01e-12 | -3.46e-01 | -0.0228 |
| 10413 | YAP1 | A014-C-040 | Human | Colorectum | FAP | 6.00e-07 | -2.89e-01 | -0.1184 |
| 10413 | YAP1 | A002-C-201 | Human | Colorectum | FAP | 1.29e-18 | -2.18e-01 | 0.0324 |
| 10413 | YAP1 | A002-C-203 | Human | Colorectum | FAP | 3.58e-03 | 3.58e-02 | 0.2786 |
| 10413 | YAP1 | A001-C-119 | Human | Colorectum | FAP | 2.43e-10 | -3.92e-01 | -0.1557 |
| 10413 | YAP1 | A001-C-108 | Human | Colorectum | FAP | 1.90e-17 | -1.53e-01 | -0.0272 |
| 10413 | YAP1 | A002-C-205 | Human | Colorectum | FAP | 2.76e-33 | -3.47e-01 | -0.1236 |
| 10413 | YAP1 | A001-C-104 | Human | Colorectum | FAP | 2.91e-02 | -1.90e-02 | 0.0184 |
| Page: 1 2 3 4 5 6 7 8 9 10 11 |
| Tissue | Expression Dynamics | Abbreviation |
| Cervix | 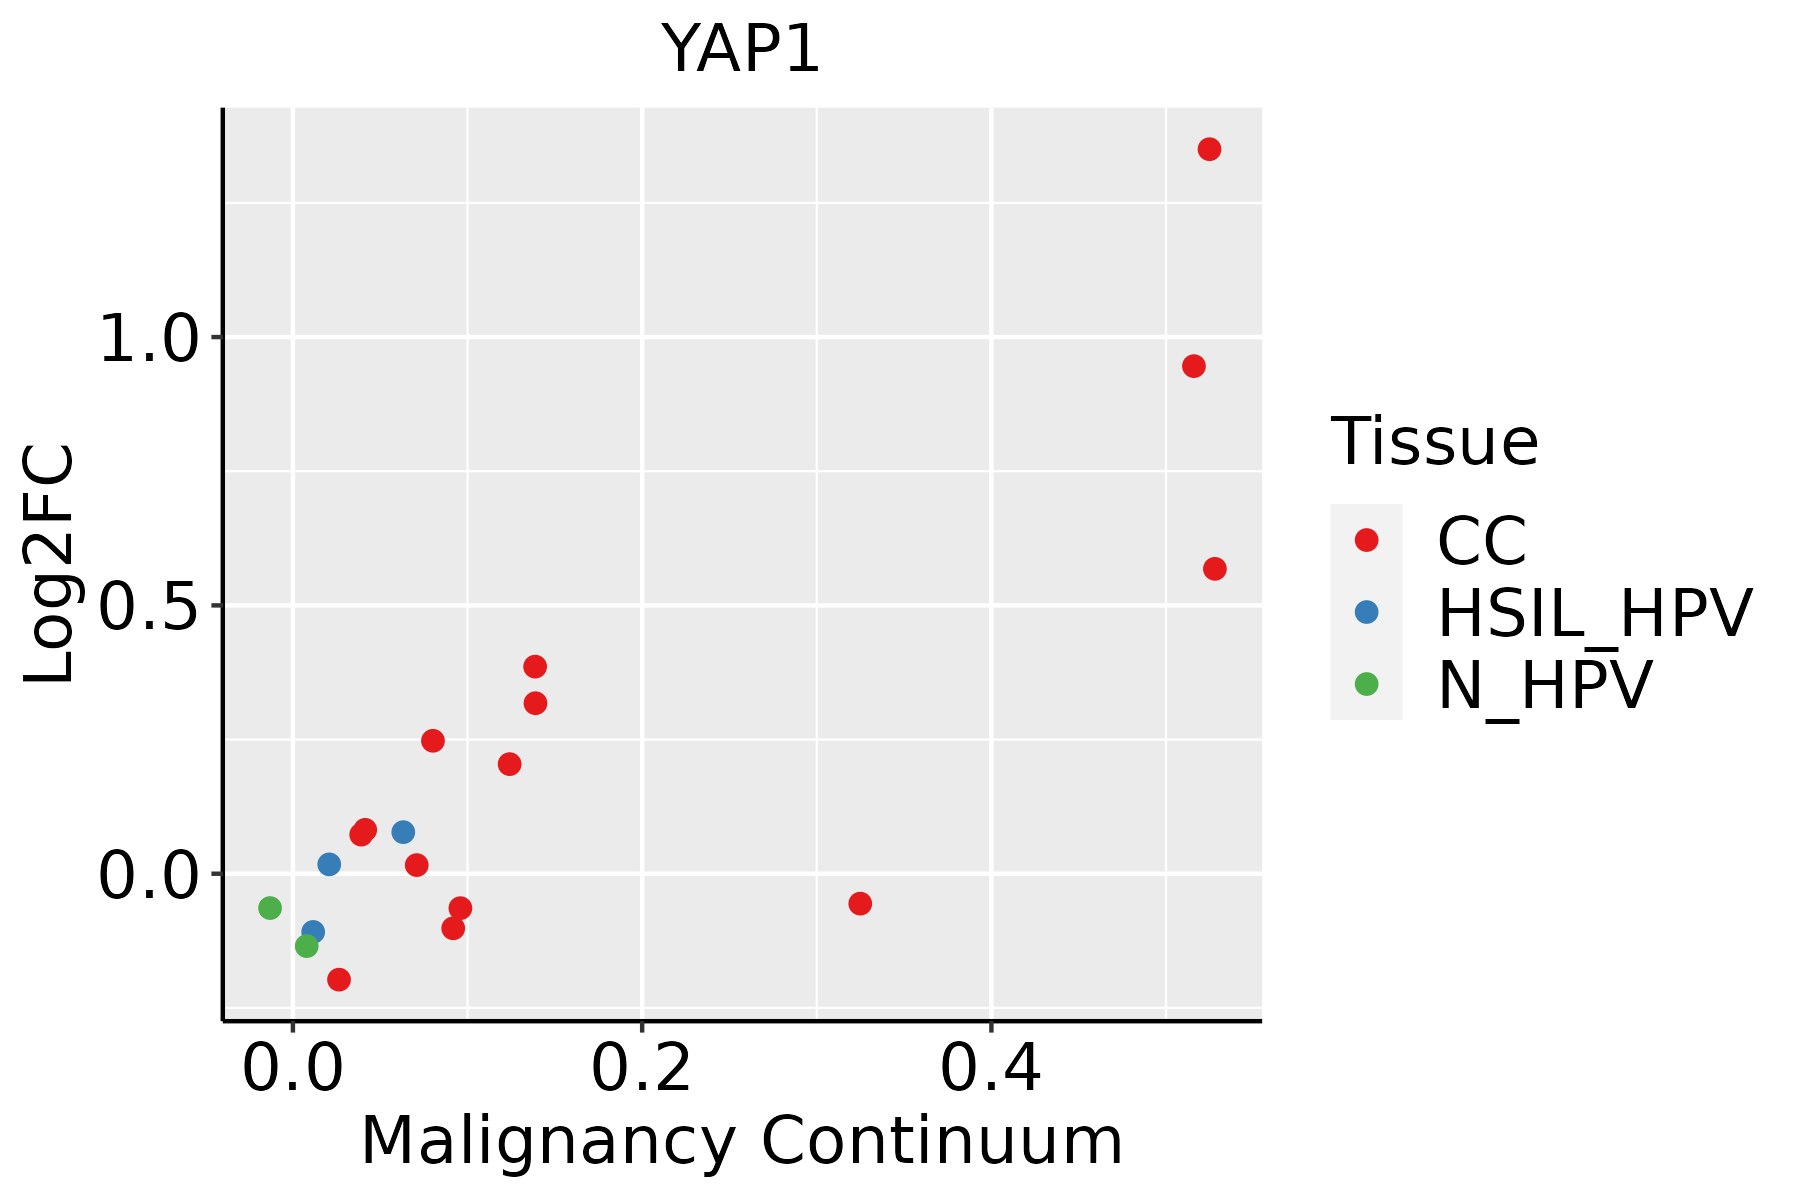 | CC: Cervix cancer |
| HSIL_HPV: HPV-infected high-grade squamous intraepithelial lesions | ||
| N_HPV: HPV-infected normal cervix | ||
| Colorectum (GSE201348) |  | FAP: Familial adenomatous polyposis |
| CRC: Colorectal cancer | ||
| Colorectum (HTA11) |  | AD: Adenomas |
| SER: Sessile serrated lesions | ||
| MSI-H: Microsatellite-high colorectal cancer | ||
| MSS: Microsatellite stable colorectal cancer | ||
| Endometrium |  | AEH: Atypical endometrial hyperplasia |
| EEC: Endometrioid Cancer | ||
| Esophagus | 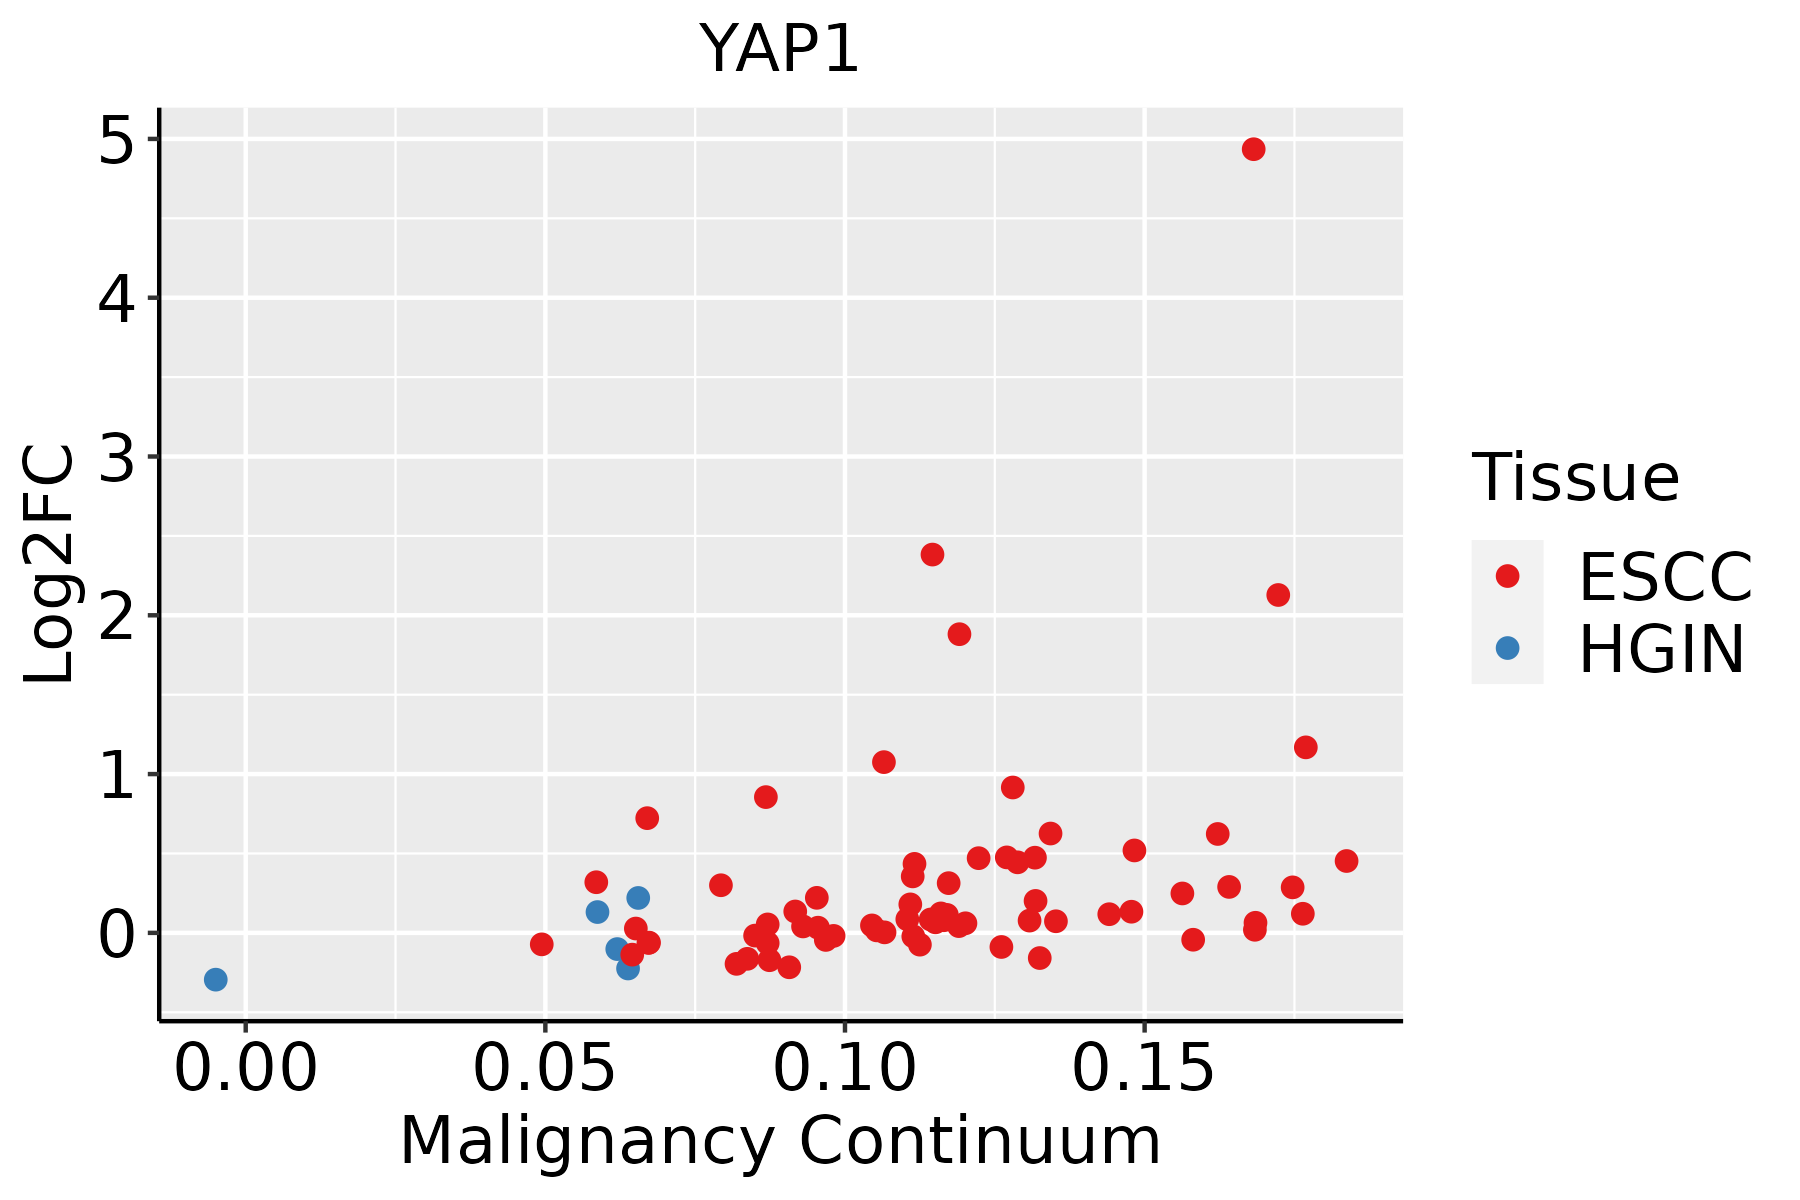 | ESCC: Esophageal squamous cell carcinoma |
| HGIN: High-grade intraepithelial neoplasias | ||
| LGIN: Low-grade intraepithelial neoplasias | ||
| Liver |  | HCC: Hepatocellular carcinoma |
| NAFLD: Non-alcoholic fatty liver disease | ||
| Lung | 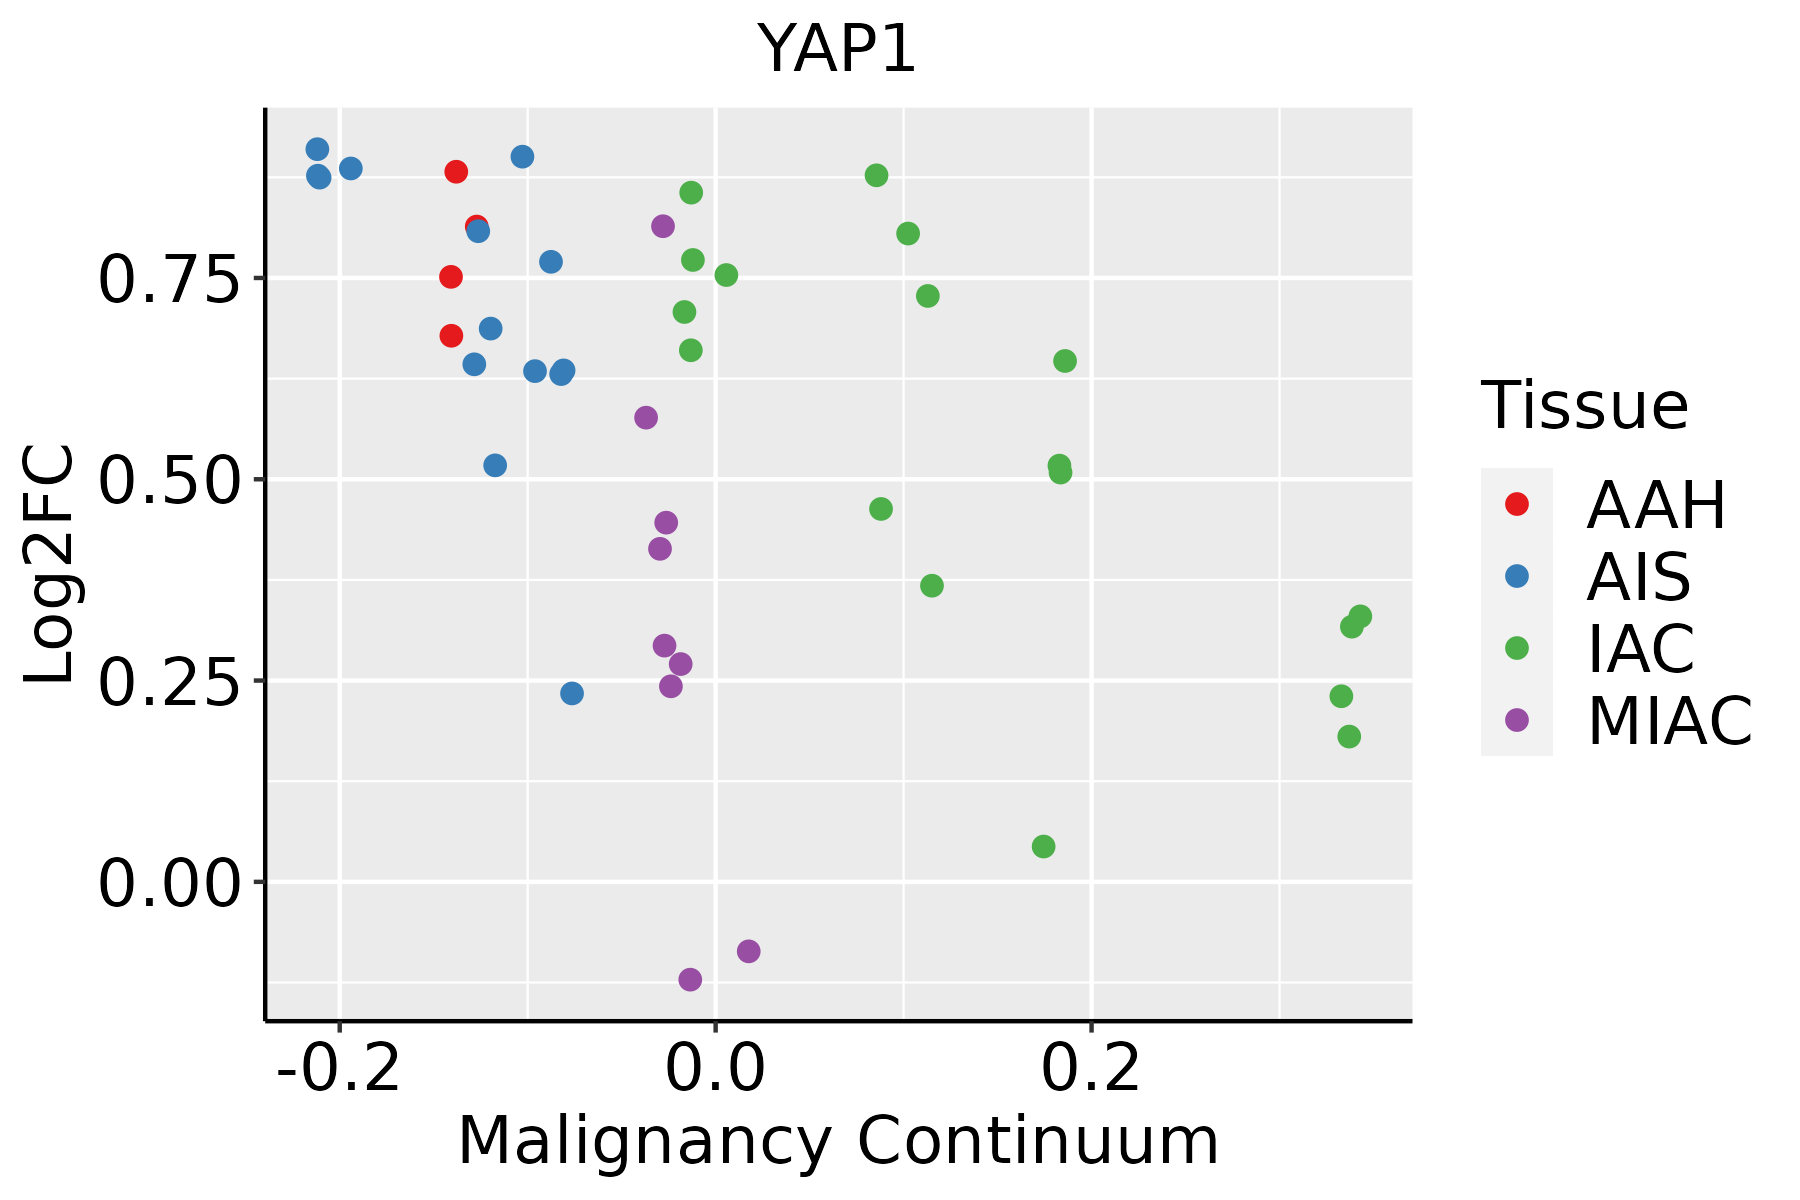 | AAH: Atypical adenomatous hyperplasia |
| AIS: Adenocarcinoma in situ | ||
| IAC: Invasive lung adenocarcinoma | ||
| MIA: Minimally invasive adenocarcinoma | ||
| Oral Cavity | 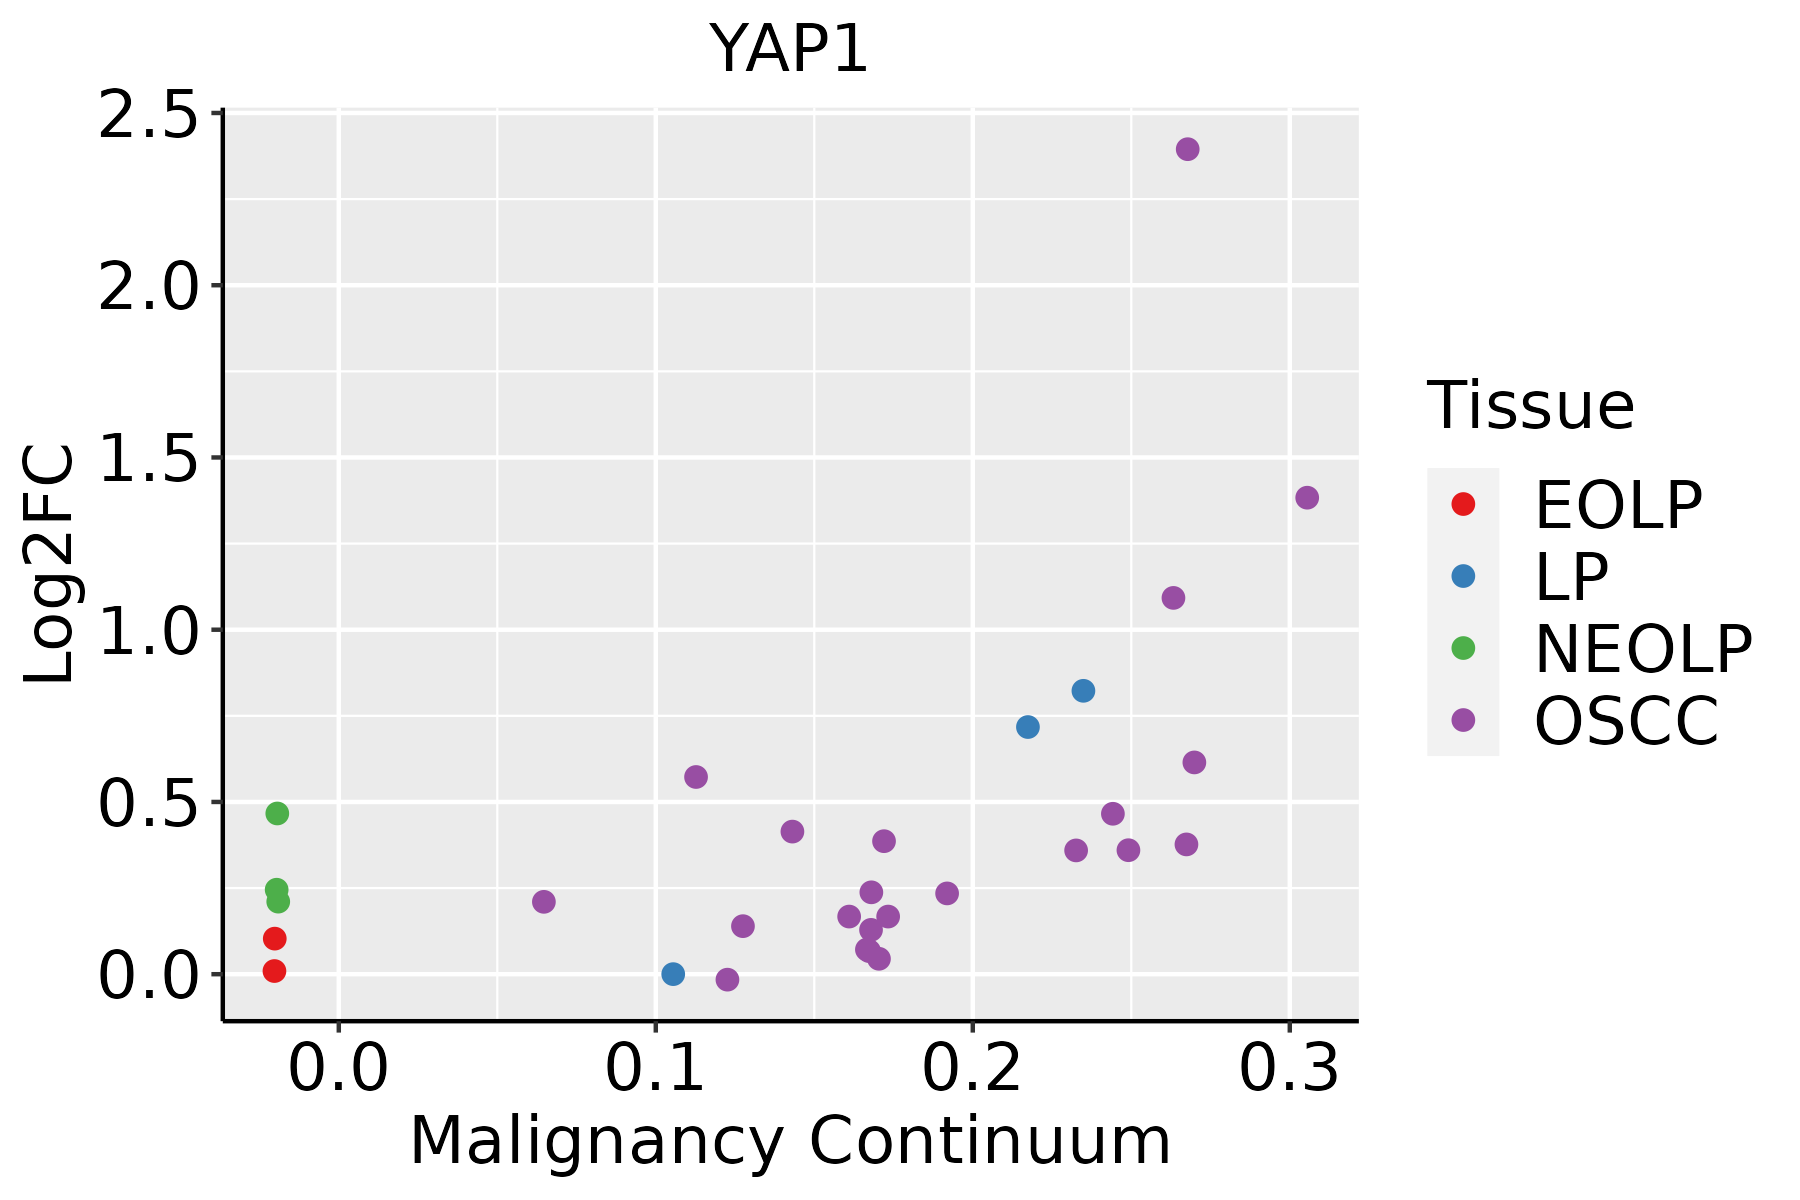 | EOLP: Erosive Oral lichen planus |
| LP: leukoplakia | ||
| NEOLP: Non-erosive oral lichen planus | ||
| OSCC: Oral squamous cell carcinoma | ||
| Prostate | 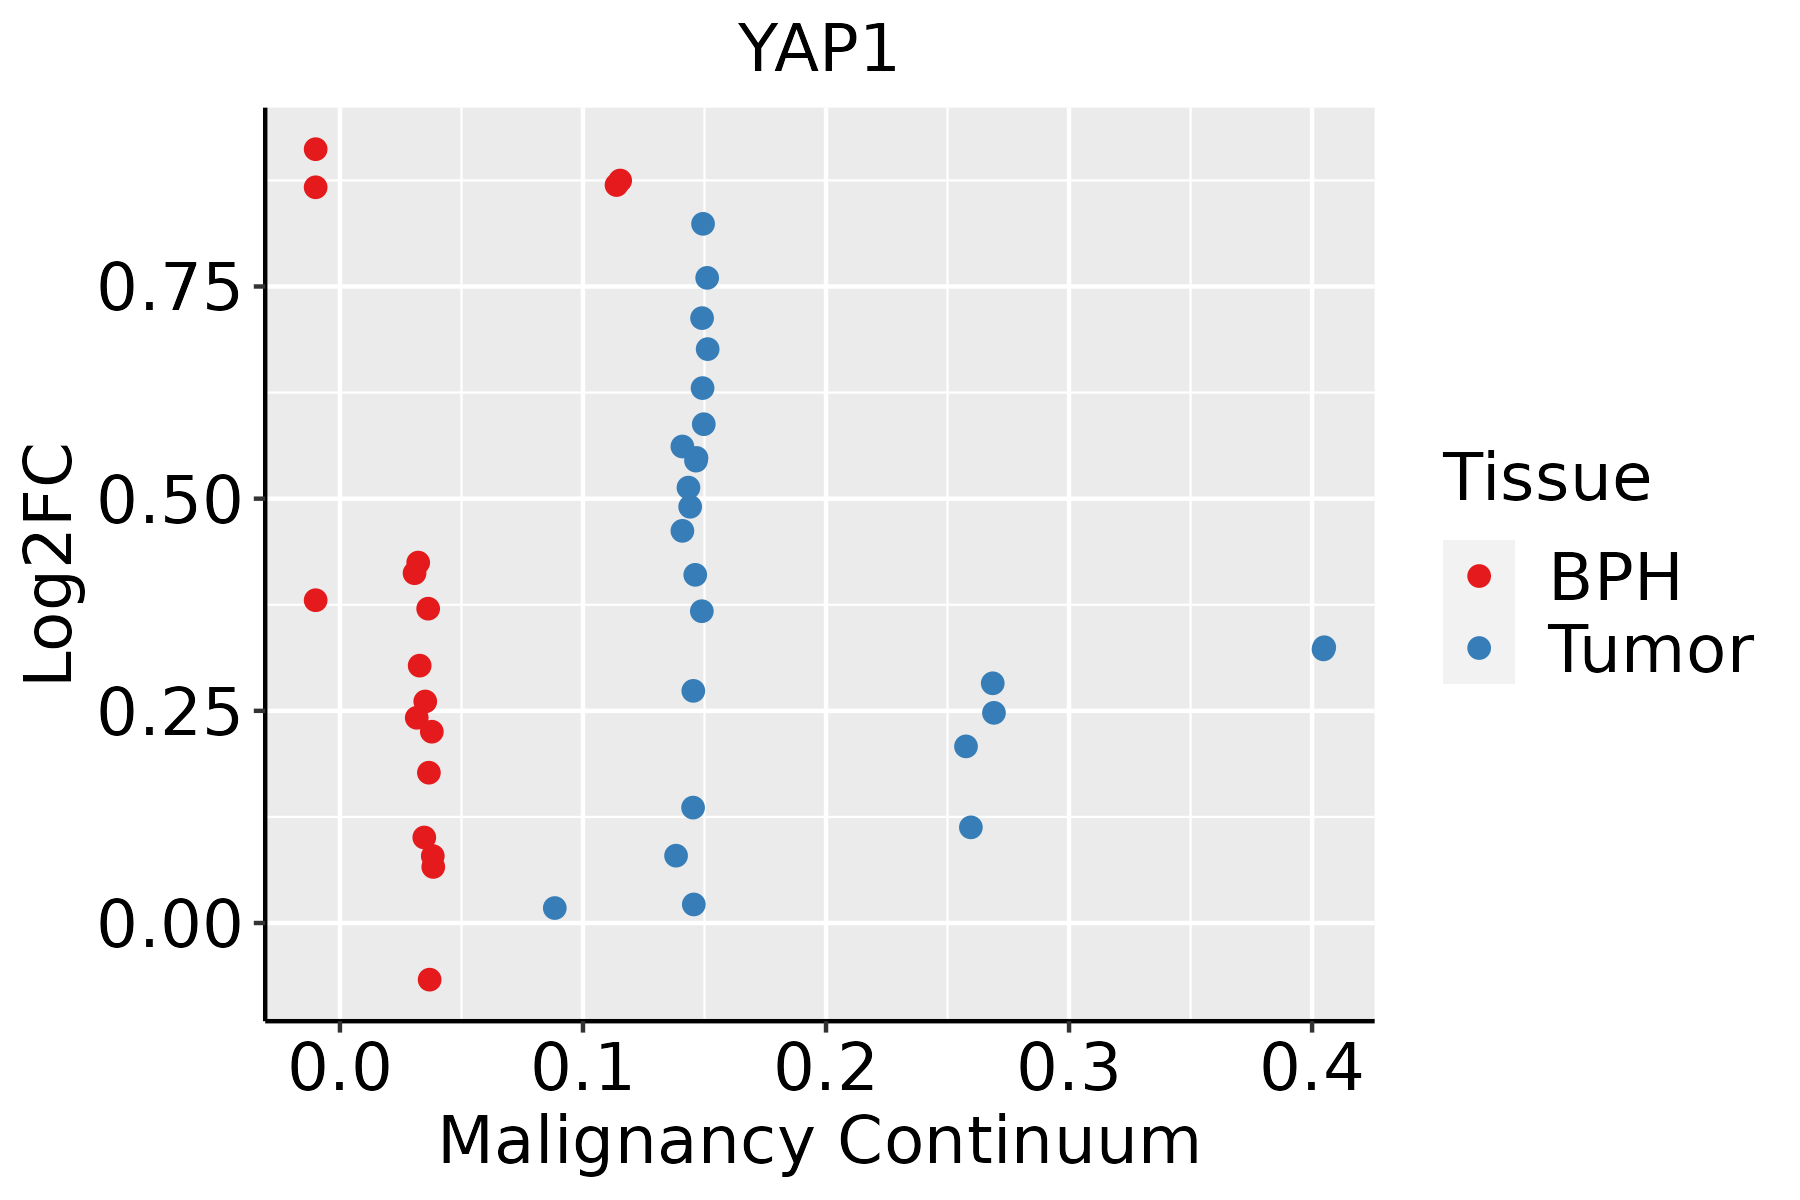 | BPH: Benign Prostatic Hyperplasia |
| Skin | 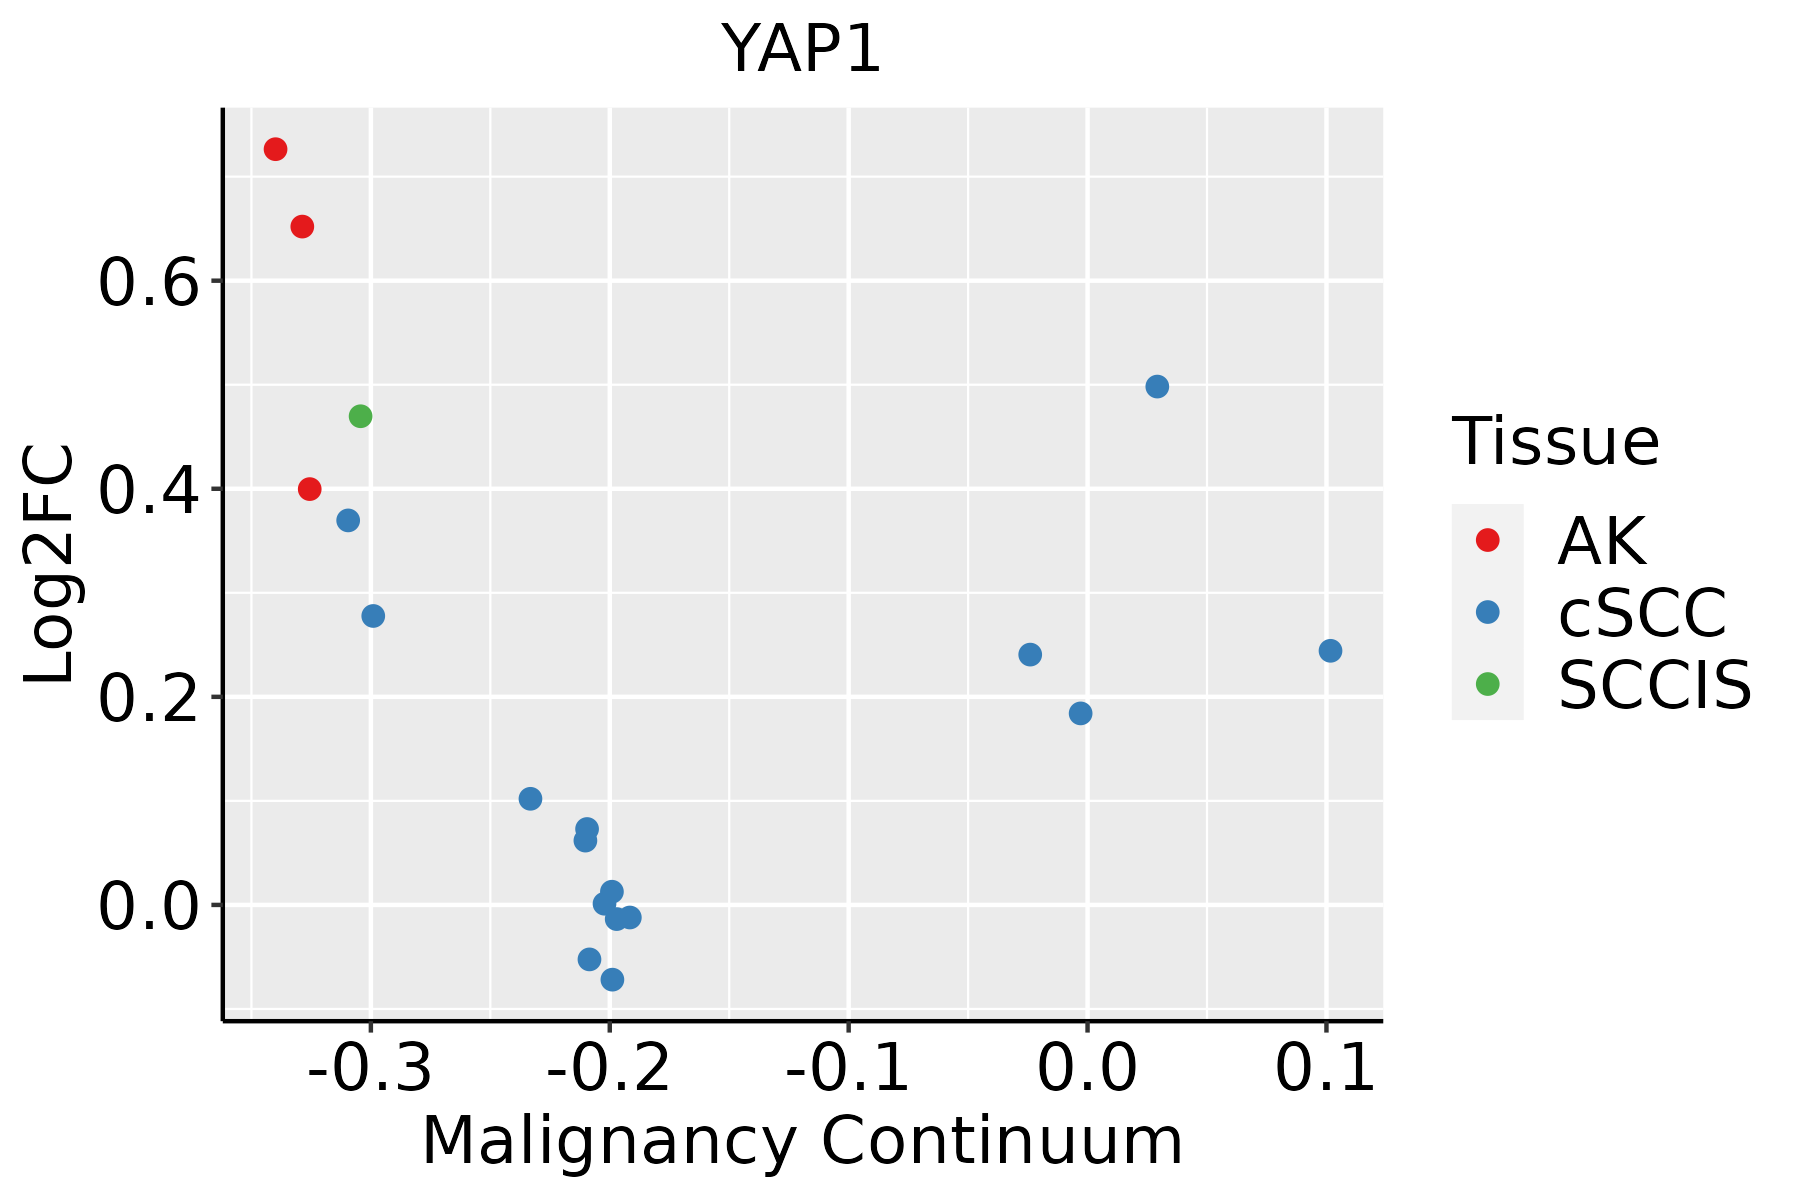 | AK: Actinic keratosis |
| cSCC: Cutaneous squamous cell carcinoma | ||
| SCCIS:squamous cell carcinoma in situ | ||
| Thyroid | 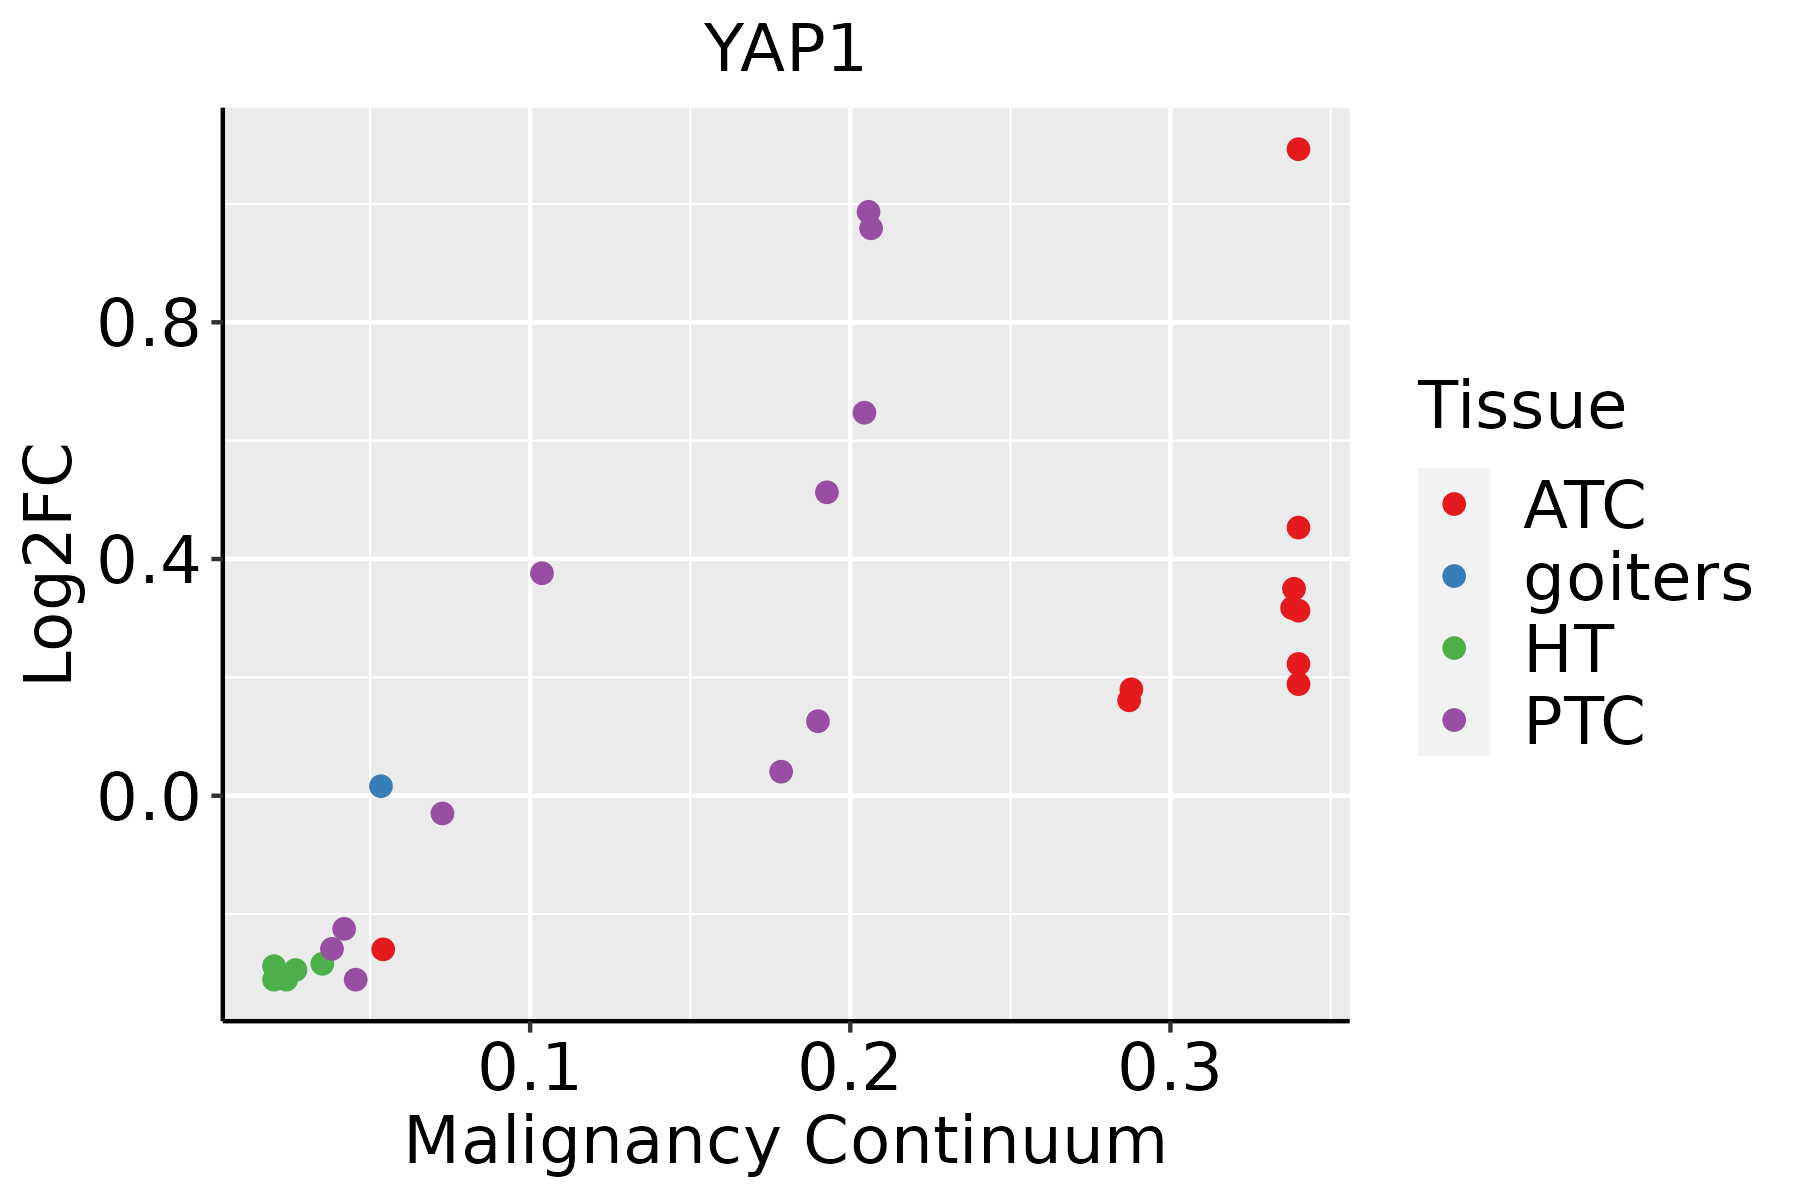 | ATC: Anaplastic thyroid cancer |
| HT: Hashimoto's thyroiditis | ||
| PTC: Papillary thyroid cancer |
| ∗log2FC in expression of this searched gene in stem-like cells from each diseased tissue sample relative to stem-like cells in normal samples in each tissue plotted against the malignancy continuum. Samples are colored based on if they are from different disease stage. |
Top |
Malignant transformation related pathway analysis |
| Find out the enriched GO biological processes and KEGG pathways involved in transition from healthy to precancer to cancer |
| Tissue | Disease Stage | Enriched GO biological Processes |
| Colorectum | AD |  |
| Colorectum | SER |  |
| Colorectum | MSS |  |
| Colorectum | MSI-H |  |
| Colorectum | FAP |  |
| ∗Top 15 enriched GO BP terms are showed in the bar plot of each disease state in each tissue. Each row represents a significant GO biological process which is colored according to the -log10(p.adjust). |
| Page: 1 2 3 4 5 6 7 8 9 |
| GO ID | Tissue | Disease Stage | Description | Gene Ratio | Bg Ratio | pvalue | p.adjust | Count |
| GO:00454444 | Breast | Precancer | fat cell differentiation | 26/1080 | 229/18723 | 7.60e-04 | 9.04e-03 | 26 |
| GO:00336749 | Breast | Precancer | positive regulation of kinase activity | 42/1080 | 467/18723 | 2.94e-03 | 2.54e-02 | 42 |
| GO:00713647 | Breast | Precancer | cellular response to epidermal growth factor stimulus | 8/1080 | 45/18723 | 3.82e-03 | 3.06e-02 | 8 |
| GO:00456003 | Breast | Precancer | positive regulation of fat cell differentiation | 10/1080 | 66/18723 | 4.34e-03 | 3.39e-02 | 10 |
| GO:00708497 | Breast | Precancer | response to epidermal growth factor | 8/1080 | 49/18723 | 6.53e-03 | 4.51e-02 | 8 |
| GO:00434348 | Breast | IDC | response to peptide hormone | 54/1434 | 414/18723 | 8.25e-05 | 1.61e-03 | 54 |
| GO:007136413 | Breast | IDC | cellular response to epidermal growth factor stimulus | 11/1434 | 45/18723 | 4.57e-04 | 6.13e-03 | 11 |
| GO:007084913 | Breast | IDC | response to epidermal growth factor | 11/1434 | 49/18723 | 9.88e-04 | 1.11e-02 | 11 |
| GO:004544412 | Breast | IDC | fat cell differentiation | 30/1434 | 229/18723 | 2.72e-03 | 2.41e-02 | 30 |
| GO:004560011 | Breast | IDC | positive regulation of fat cell differentiation | 12/1434 | 66/18723 | 3.99e-03 | 3.23e-02 | 12 |
| GO:00328687 | Breast | IDC | response to insulin | 32/1434 | 264/18723 | 6.61e-03 | 4.62e-02 | 32 |
| GO:00328697 | Breast | IDC | cellular response to insulin stimulus | 26/1434 | 203/18723 | 6.74e-03 | 4.68e-02 | 26 |
| GO:004343414 | Breast | DCIS | response to peptide hormone | 52/1390 | 414/18723 | 1.33e-04 | 2.28e-03 | 52 |
| GO:007136422 | Breast | DCIS | cellular response to epidermal growth factor stimulus | 10/1390 | 45/18723 | 1.43e-03 | 1.46e-02 | 10 |
| GO:004544421 | Breast | DCIS | fat cell differentiation | 30/1390 | 229/18723 | 1.70e-03 | 1.68e-02 | 30 |
| GO:007084922 | Breast | DCIS | response to epidermal growth factor | 10/1390 | 49/18723 | 2.80e-03 | 2.43e-02 | 10 |
| GO:004560021 | Breast | DCIS | positive regulation of fat cell differentiation | 12/1390 | 66/18723 | 3.10e-03 | 2.63e-02 | 12 |
| GO:003286813 | Breast | DCIS | response to insulin | 32/1390 | 264/18723 | 4.20e-03 | 3.31e-02 | 32 |
| GO:003286913 | Breast | DCIS | cellular response to insulin stimulus | 26/1390 | 203/18723 | 4.53e-03 | 3.47e-02 | 26 |
| GO:004206010 | Cervix | CC | wound healing | 109/2311 | 422/18723 | 1.84e-14 | 1.57e-11 | 109 |
| Page: 1 2 3 4 5 6 7 8 9 10 11 12 13 14 15 16 17 18 19 20 21 22 23 24 25 26 27 28 29 30 31 32 33 34 35 36 37 38 39 40 41 42 43 44 45 46 47 48 49 50 51 52 53 54 55 56 57 58 59 60 61 62 63 64 65 66 67 68 69 70 71 72 73 74 75 76 77 78 79 80 81 82 83 84 85 86 87 88 89 90 91 92 93 94 95 96 97 98 99 100 101 102 103 104 105 106 107 |
| Pathway ID | Tissue | Disease Stage | Description | Gene Ratio | Bg Ratio | pvalue | p.adjust | qvalue | Count |
| hsa043908 | Cervix | CC | Hippo signaling pathway | 40/1267 | 157/8465 | 3.64e-04 | 1.82e-03 | 1.07e-03 | 40 |
| hsa0439013 | Cervix | CC | Hippo signaling pathway | 40/1267 | 157/8465 | 3.64e-04 | 1.82e-03 | 1.07e-03 | 40 |
| hsa04390 | Colorectum | MSS | Hippo signaling pathway | 48/1875 | 157/8465 | 8.32e-03 | 3.10e-02 | 1.90e-02 | 48 |
| hsa043901 | Colorectum | MSS | Hippo signaling pathway | 48/1875 | 157/8465 | 8.32e-03 | 3.10e-02 | 1.90e-02 | 48 |
| hsa043902 | Colorectum | FAP | Hippo signaling pathway | 41/1404 | 157/8465 | 1.49e-03 | 7.91e-03 | 4.81e-03 | 41 |
| hsa043903 | Colorectum | FAP | Hippo signaling pathway | 41/1404 | 157/8465 | 1.49e-03 | 7.91e-03 | 4.81e-03 | 41 |
| hsa043904 | Colorectum | CRC | Hippo signaling pathway | 32/1091 | 157/8465 | 5.17e-03 | 2.72e-02 | 1.84e-02 | 32 |
| hsa043905 | Colorectum | CRC | Hippo signaling pathway | 32/1091 | 157/8465 | 5.17e-03 | 2.72e-02 | 1.84e-02 | 32 |
| hsa043909 | Endometrium | AEH | Hippo signaling pathway | 38/1197 | 157/8465 | 4.79e-04 | 3.38e-03 | 2.47e-03 | 38 |
| hsa0439014 | Endometrium | AEH | Hippo signaling pathway | 38/1197 | 157/8465 | 4.79e-04 | 3.38e-03 | 2.47e-03 | 38 |
| hsa0439023 | Endometrium | EEC | Hippo signaling pathway | 39/1237 | 157/8465 | 4.54e-04 | 3.47e-03 | 2.59e-03 | 39 |
| hsa0439033 | Endometrium | EEC | Hippo signaling pathway | 39/1237 | 157/8465 | 4.54e-04 | 3.47e-03 | 2.59e-03 | 39 |
| hsa0439018 | Esophagus | ESCC | Hippo signaling pathway | 92/4205 | 157/8465 | 1.46e-02 | 3.31e-02 | 1.69e-02 | 92 |
| hsa0439019 | Esophagus | ESCC | Hippo signaling pathway | 92/4205 | 157/8465 | 1.46e-02 | 3.31e-02 | 1.69e-02 | 92 |
| hsa043907 | Lung | IAC | Hippo signaling pathway | 35/1053 | 157/8465 | 3.60e-04 | 3.45e-03 | 2.29e-03 | 35 |
| hsa0439012 | Lung | IAC | Hippo signaling pathway | 35/1053 | 157/8465 | 3.60e-04 | 3.45e-03 | 2.29e-03 | 35 |
| hsa0439022 | Lung | AIS | Hippo signaling pathway | 34/961 | 157/8465 | 1.36e-04 | 1.63e-03 | 1.05e-03 | 34 |
| hsa0439032 | Lung | AIS | Hippo signaling pathway | 34/961 | 157/8465 | 1.36e-04 | 1.63e-03 | 1.05e-03 | 34 |
| hsa0439016 | Oral cavity | OSCC | Hippo signaling pathway | 86/3704 | 157/8465 | 3.30e-03 | 8.24e-03 | 4.20e-03 | 86 |
| hsa0439017 | Oral cavity | OSCC | Hippo signaling pathway | 86/3704 | 157/8465 | 3.30e-03 | 8.24e-03 | 4.20e-03 | 86 |
| Page: 1 2 |
Top |
Cell-cell communication analysis |
| Identification of potential cell-cell interactions between two cell types and their ligand-receptor pairs for different disease states |
| Ligand | Receptor | LRpair | Pathway | Tissue | Disease Stage |
| Page: 1 |
Top |
Single-cell gene regulatory network inference analysis |
| Find out the significant the regulons (TFs) and the target genes of each regulon across cell types for different disease states |
| TF | Cell Type | Tissue | Disease Stage | Target Gene | RSS | Regulon Activity |
| ∗The dot plots of a searched regulon are shown for all cell subpopulations in each disease state of each tissue based on the regulon specific score inferred using pySCENIC and by calculating the average expression. |
| Page: 1 |
Top |
Somatic mutation of malignant transformation related genes |
| Annotation of somatic variants for genes involved in malignant transformation |
| Hugo Symbol | Variant Class | Variant Classification | dbSNP RS | HGVSc | HGVSp | HGVSp Short | SWISSPROT | BIOTYPE | SIFT | PolyPhen | Tumor Sample Barcode | Tissue | Histology | Sex | Age | Stage | Therapy Types | Drugs | Outcome |
| YAP1 | SNV | Missense_Mutation | c.1426N>T | p.Pro476Ser | p.P476S | P46937 | protein_coding | deleterious(0.04) | probably_damaging(0.973) | TCGA-BH-A0C1-01 | Breast | breast invasive carcinoma | Female | <65 | III/IV | Chemotherapy | adriamycin | PD | |
| YAP1 | SNV | Missense_Mutation | novel | c.640N>A | p.Ala214Thr | p.A214T | P46937 | protein_coding | tolerated(0.14) | benign(0.018) | TCGA-2W-A8YY-01 | Cervix | cervical & endocervical cancer | Female | <65 | I/II | Chemotherapy | cisplatin | CR |
| YAP1 | SNV | Missense_Mutation | novel | c.827N>A | p.Ser276Asn | p.S276N | P46937 | protein_coding | tolerated(0.11) | benign(0.036) | TCGA-2W-A8YY-01 | Cervix | cervical & endocervical cancer | Female | <65 | I/II | Chemotherapy | cisplatin | CR |
| YAP1 | SNV | Missense_Mutation | c.317G>A | p.Arg106Gln | p.R106Q | P46937 | protein_coding | deleterious(0) | benign(0.147) | TCGA-EK-A3GJ-01 | Cervix | cervical & endocervical cancer | Female | <65 | I/II | Unknown | Unknown | SD | |
| YAP1 | SNV | Missense_Mutation | c.37N>A | p.Pro13Thr | p.P13T | P46937 | protein_coding | deleterious_low_confidence(0.04) | benign(0.005) | TCGA-A6-6780-01 | Colorectum | colon adenocarcinoma | Male | >=65 | I/II | Unknown | Unknown | SD | |
| YAP1 | SNV | Missense_Mutation | rs754280015 | c.955N>T | p.Arg319Trp | p.R319W | P46937 | protein_coding | deleterious(0) | probably_damaging(0.947) | TCGA-AA-A010-01 | Colorectum | colon adenocarcinoma | Female | <65 | I/II | Chemotherapy | folinic | CR |
| YAP1 | SNV | Missense_Mutation | novel | c.349G>C | p.Ala117Pro | p.A117P | P46937 | protein_coding | tolerated(0.1) | possibly_damaging(0.713) | TCGA-AA-A02W-01 | Colorectum | colon adenocarcinoma | Female | >=65 | I/II | Unknown | Unknown | PD |
| YAP1 | SNV | Missense_Mutation | c.363N>T | p.Gln121His | p.Q121H | P46937 | protein_coding | tolerated(0.64) | benign(0.026) | TCGA-CM-4743-01 | Colorectum | colon adenocarcinoma | Male | >=65 | I/II | Chemotherapy | capecitabine | SD | |
| YAP1 | SNV | Missense_Mutation | novel | c.413C>T | p.Ser138Phe | p.S138F | P46937 | protein_coding | deleterious(0) | possibly_damaging(0.888) | TCGA-EI-6917-01 | Colorectum | rectum adenocarcinoma | Male | <65 | III/IV | Chemotherapy | 5fluorouracil+oxaciplatina+l-folinian | SD |
| YAP1 | insertion | In_Frame_Ins | novel | c.1446_1447insGTTGAT | p.Leu482_Ser483insValAsp | p.L482_S483insVD | P46937 | protein_coding | TCGA-AM-5820-01 | Colorectum | colon adenocarcinoma | Female | <65 | I/II | Unknown | Unknown | SD |
| Page: 1 2 3 4 |
Top |
Related drugs of malignant transformation related genes |
| Identification of chemicals and drugs interact with genes involved in malignant transfromation |
| (DGIdb 4.0) |
| Entrez ID | Symbol | Category | Interaction Types | Drug Claim Name | Drug Name | PMIDs |
| Page: 1 |

Copyright 2023-Present -The University of Texas Health Science Center at Houston |