
|
|||||
|
 | |
| |
| |
| |
| |
| |
|
Gene: XYLT2 |
Gene summary for XYLT2 |
| Gene information | Species | Human | Gene symbol | XYLT2 | Gene ID | 64132 |
| Gene name | xylosyltransferase 2 | |
| Gene Alias | PXYLT2 | |
| Cytomap | 17q21.33 | |
| Gene Type | protein-coding | GO ID | GO:0006022 | UniProtAcc | B4DT06 |
Top |
Malignant transformation analysis |
| Identification of the aberrant gene expression in precancerous and cancerous lesions by comparing the gene expression of stem-like cells in diseased tissues with normal stem cells |
| Entrez ID | Symbol | Replicates | Species | Organ | Tissue | Adj P-value | Log2FC | Malignancy |
| 64132 | XYLT2 | C04 | Human | Oral cavity | OSCC | 5.66e-04 | 3.14e-01 | 0.2633 |
| 64132 | XYLT2 | C21 | Human | Oral cavity | OSCC | 4.84e-04 | 2.41e-01 | 0.2678 |
| 64132 | XYLT2 | C30 | Human | Oral cavity | OSCC | 1.78e-20 | 1.09e+00 | 0.3055 |
| 64132 | XYLT2 | C43 | Human | Oral cavity | OSCC | 2.85e-05 | 1.85e-01 | 0.1704 |
| 64132 | XYLT2 | C51 | Human | Oral cavity | OSCC | 1.01e-15 | 5.44e-01 | 0.2674 |
| 64132 | XYLT2 | C08 | Human | Oral cavity | OSCC | 2.70e-03 | 1.19e-01 | 0.1919 |
| 64132 | XYLT2 | LN22 | Human | Oral cavity | OSCC | 4.94e-05 | 5.04e-01 | 0.1733 |
| 64132 | XYLT2 | SYSMH1 | Human | Oral cavity | OSCC | 3.58e-02 | 6.76e-02 | 0.1127 |
| 64132 | XYLT2 | SYSMH3 | Human | Oral cavity | OSCC | 5.85e-14 | 3.13e-01 | 0.2442 |
| Page: 1 |
| Tissue | Expression Dynamics | Abbreviation |
| Oral Cavity | 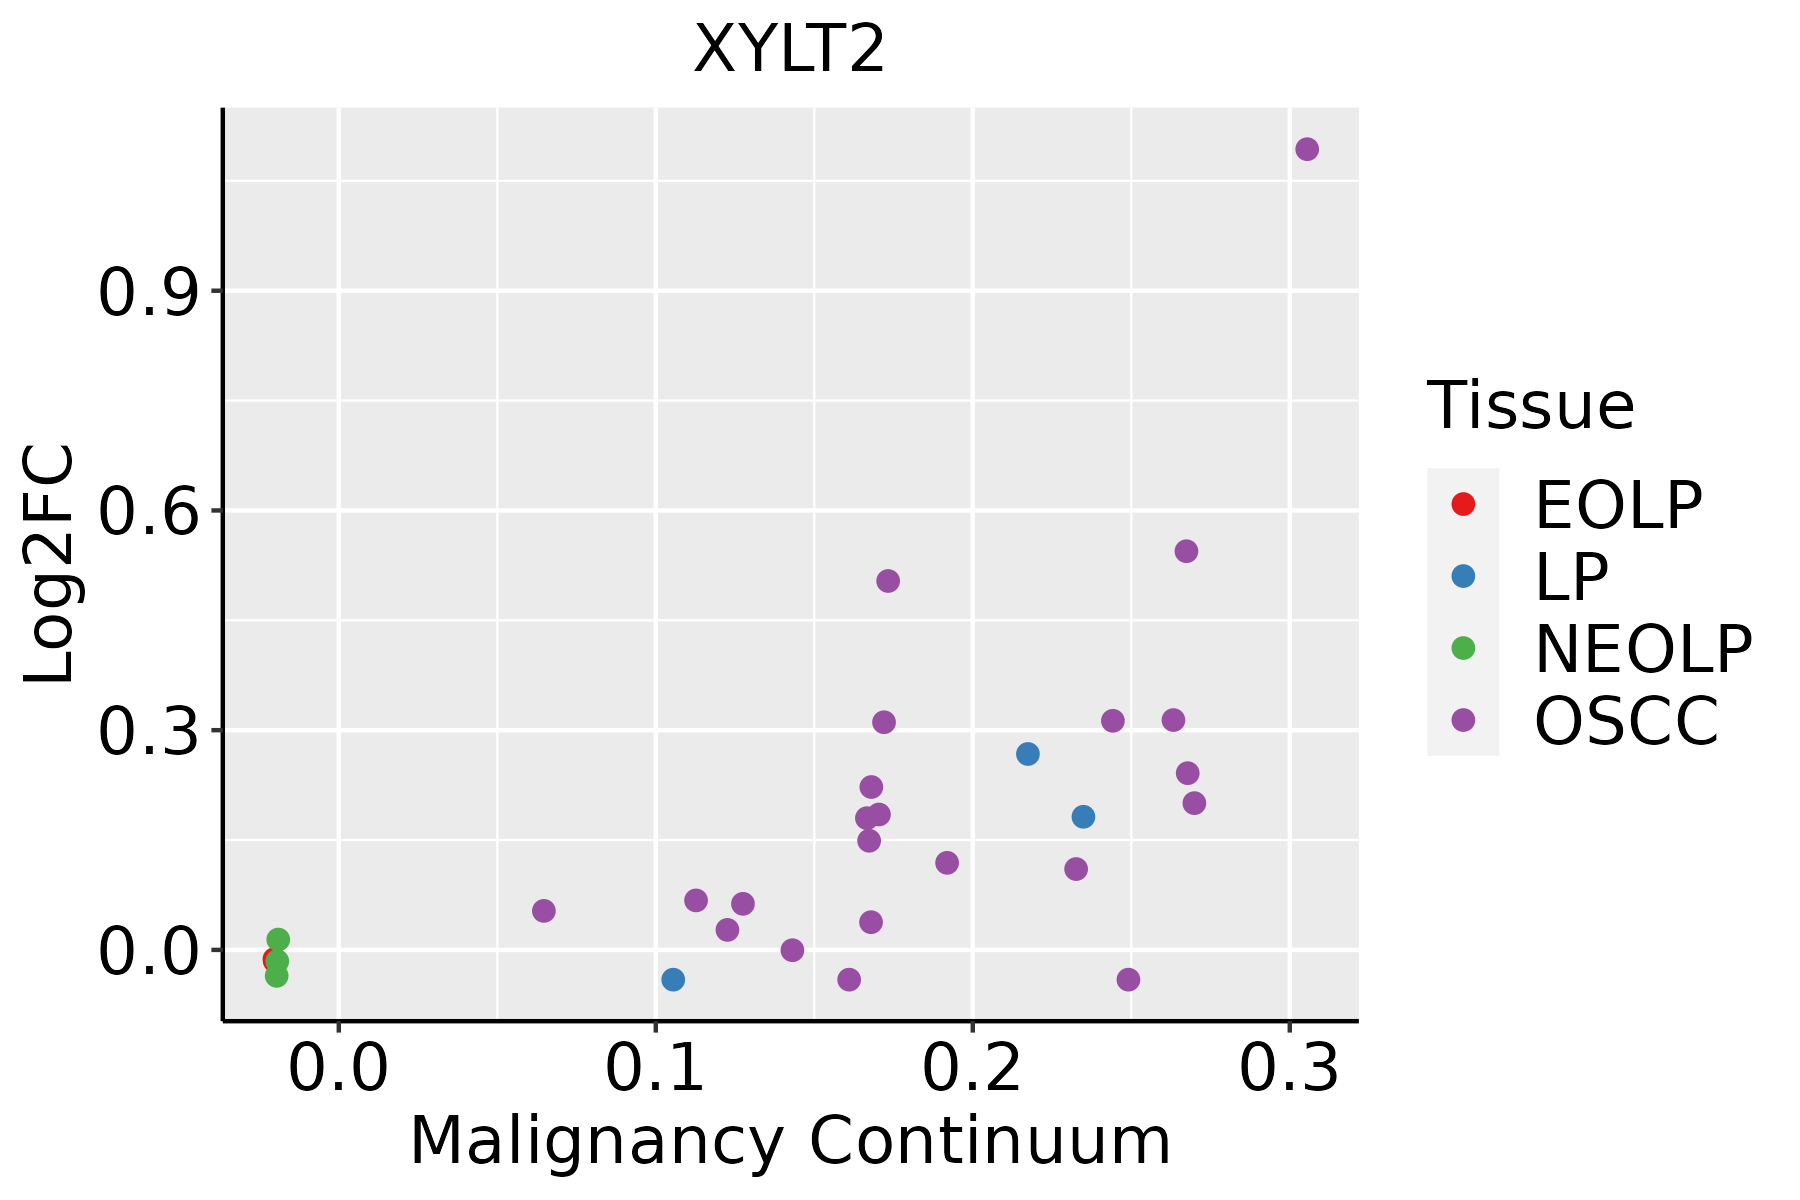 | EOLP: Erosive Oral lichen planus |
| LP: leukoplakia | ||
| NEOLP: Non-erosive oral lichen planus | ||
| OSCC: Oral squamous cell carcinoma |
| ∗log2FC in expression of this searched gene in stem-like cells from each diseased tissue sample relative to stem-like cells in normal samples in each tissue plotted against the malignancy continuum. Samples are colored based on if they are from different disease stage. |
Top |
Malignant transformation related pathway analysis |
| Find out the enriched GO biological processes and KEGG pathways involved in transition from healthy to precancer to cancer |
| Tissue | Disease Stage | Enriched GO biological Processes |
| Colorectum | AD |  |
| Colorectum | SER |  |
| Colorectum | MSS |  |
| Colorectum | MSI-H |  |
| Colorectum | FAP |  |
| ∗Top 15 enriched GO BP terms are showed in the bar plot of each disease state in each tissue. Each row represents a significant GO biological process which is colored according to the -log10(p.adjust). |
| Page: 1 2 3 4 5 6 7 8 9 |
| GO ID | Tissue | Disease Stage | Description | Gene Ratio | Bg Ratio | pvalue | p.adjust | Count |
| GO:0006486 | Colorectum | AD | protein glycosylation | 64/3918 | 226/18723 | 4.86e-03 | 3.27e-02 | 64 |
| GO:0043413 | Colorectum | AD | macromolecule glycosylation | 64/3918 | 226/18723 | 4.86e-03 | 3.27e-02 | 64 |
| GO:0070085 | Colorectum | AD | glycosylation | 67/3918 | 240/18723 | 5.78e-03 | 3.67e-02 | 67 |
| GO:00064861 | Colorectum | FAP | protein glycosylation | 48/2622 | 226/18723 | 1.85e-03 | 1.57e-02 | 48 |
| GO:00434131 | Colorectum | FAP | macromolecule glycosylation | 48/2622 | 226/18723 | 1.85e-03 | 1.57e-02 | 48 |
| GO:00700851 | Colorectum | FAP | glycosylation | 50/2622 | 240/18723 | 2.30e-03 | 1.85e-02 | 50 |
| GO:0009101 | Colorectum | FAP | glycoprotein biosynthetic process | 63/2622 | 317/18723 | 2.31e-03 | 1.86e-02 | 63 |
| GO:00442724 | Oral cavity | OSCC | sulfur compound biosynthetic process | 82/7305 | 148/18723 | 3.71e-05 | 3.31e-04 | 82 |
| GO:00067905 | Oral cavity | OSCC | sulfur compound metabolic process | 168/7305 | 339/18723 | 4.50e-05 | 3.84e-04 | 168 |
| GO:0030206 | Oral cavity | OSCC | chondroitin sulfate biosynthetic process | 15/7305 | 18/18723 | 1.53e-04 | 1.07e-03 | 15 |
| GO:00091001 | Oral cavity | OSCC | glycoprotein metabolic process | 185/7305 | 387/18723 | 2.37e-04 | 1.54e-03 | 185 |
| GO:00091011 | Oral cavity | OSCC | glycoprotein biosynthetic process | 151/7305 | 317/18723 | 1.01e-03 | 5.26e-03 | 151 |
| GO:0050650 | Oral cavity | OSCC | chondroitin sulfate proteoglycan biosynthetic process | 16/7305 | 23/18723 | 2.93e-03 | 1.27e-02 | 16 |
| GO:0030204 | Oral cavity | OSCC | chondroitin sulfate metabolic process | 19/7305 | 30/18723 | 6.03e-03 | 2.28e-02 | 19 |
| GO:00064866 | Thyroid | PTC | protein glycosylation | 94/5968 | 226/18723 | 1.25e-03 | 7.13e-03 | 94 |
| GO:00434136 | Thyroid | PTC | macromolecule glycosylation | 94/5968 | 226/18723 | 1.25e-03 | 7.13e-03 | 94 |
| GO:00700855 | Thyroid | PTC | glycosylation | 96/5968 | 240/18723 | 4.57e-03 | 2.15e-02 | 96 |
| GO:00091013 | Thyroid | PTC | glycoprotein biosynthetic process | 123/5968 | 317/18723 | 5.05e-03 | 2.33e-02 | 123 |
| GO:00091003 | Thyroid | PTC | glycoprotein metabolic process | 147/5968 | 387/18723 | 5.87e-03 | 2.64e-02 | 147 |
| GO:000648612 | Thyroid | ATC | protein glycosylation | 94/6293 | 226/18723 | 7.11e-03 | 2.82e-02 | 94 |
| Page: 1 2 |
| Pathway ID | Tissue | Disease Stage | Description | Gene Ratio | Bg Ratio | pvalue | p.adjust | qvalue | Count |
| hsa00532 | Oral cavity | OSCC | Glycosaminoglycan biosynthesis - chondroitin sulfate / dermatan sulfate | 16/3704 | 21/8465 | 2.61e-03 | 6.77e-03 | 3.45e-03 | 16 |
| hsa005321 | Oral cavity | OSCC | Glycosaminoglycan biosynthesis - chondroitin sulfate / dermatan sulfate | 16/3704 | 21/8465 | 2.61e-03 | 6.77e-03 | 3.45e-03 | 16 |
| Page: 1 |
Top |
Cell-cell communication analysis |
| Identification of potential cell-cell interactions between two cell types and their ligand-receptor pairs for different disease states |
| Ligand | Receptor | LRpair | Pathway | Tissue | Disease Stage |
| Page: 1 |
Top |
Single-cell gene regulatory network inference analysis |
| Find out the significant the regulons (TFs) and the target genes of each regulon across cell types for different disease states |
| TF | Cell Type | Tissue | Disease Stage | Target Gene | RSS | Regulon Activity |
| ∗The dot plots of a searched regulon are shown for all cell subpopulations in each disease state of each tissue based on the regulon specific score inferred using pySCENIC and by calculating the average expression. |
| Page: 1 |
Top |
Somatic mutation of malignant transformation related genes |
| Annotation of somatic variants for genes involved in malignant transformation |
| Hugo Symbol | Variant Class | Variant Classification | dbSNP RS | HGVSc | HGVSp | HGVSp Short | SWISSPROT | BIOTYPE | SIFT | PolyPhen | Tumor Sample Barcode | Tissue | Histology | Sex | Age | Stage | Therapy Types | Drugs | Outcome |
| XYLT2 | SNV | Missense_Mutation | c.1147N>T | p.Arg383Cys | p.R383C | Q9H1B5 | protein_coding | deleterious(0) | probably_damaging(0.998) | TCGA-A8-A09Z-01 | Breast | breast invasive carcinoma | Female | >=65 | I/II | Unknown | Unknown | SD | |
| XYLT2 | SNV | Missense_Mutation | rs767755450 | c.1421N>C | p.Ile474Thr | p.I474T | Q9H1B5 | protein_coding | deleterious(0) | probably_damaging(0.995) | TCGA-E2-A1B4-01 | Breast | breast invasive carcinoma | Female | >=65 | III/IV | Hormone Therapy | arimidex | SD |
| XYLT2 | SNV | Missense_Mutation | novel | c.1345N>A | p.Glu449Lys | p.E449K | Q9H1B5 | protein_coding | deleterious(0.02) | benign(0.099) | TCGA-EW-A3E8-01 | Breast | breast invasive carcinoma | Female | <65 | I/II | Hormone Therapy | anastrozole | SD |
| XYLT2 | insertion | Nonsense_Mutation | novel | c.1572_1573insTAGTTTGATGCATTCATGAATCCCAAAATATTTTGCTGAAATAAA | p.Gly524_Ser525insTer | p.G524_S525ins* | Q9H1B5 | protein_coding | TCGA-A2-A0CP-01 | Breast | breast invasive carcinoma | Female | <65 | I/II | Chemotherapy | cytoxan | SD | ||
| XYLT2 | SNV | Missense_Mutation | rs758253451 | c.935G>A | p.Arg312Gln | p.R312Q | Q9H1B5 | protein_coding | tolerated(0.88) | benign(0) | TCGA-C5-A8ZZ-01 | Cervix | cervical & endocervical cancer | Female | <65 | I/II | Unspecific | Cisplatin | SD |
| XYLT2 | SNV | Missense_Mutation | novel | c.200C>T | p.Ser67Leu | p.S67L | Q9H1B5 | protein_coding | tolerated_low_confidence(0.65) | benign(0.324) | TCGA-C5-A902-01 | Cervix | cervical & endocervical cancer | Female | <65 | I/II | Chemotherapy | cisplatin | SD |
| XYLT2 | SNV | Missense_Mutation | novel | c.1303N>A | p.Glu435Lys | p.E435K | Q9H1B5 | protein_coding | tolerated(0.05) | benign(0.327) | TCGA-VS-A8EC-01 | Cervix | cervical & endocervical cancer | Female | <65 | III/IV | Chemotherapy | carboplatin | CR |
| XYLT2 | SNV | Missense_Mutation | novel | c.946N>C | p.Glu316Gln | p.E316Q | Q9H1B5 | protein_coding | tolerated(0.11) | benign(0.223) | TCGA-VS-A958-01 | Cervix | cervical & endocervical cancer | Female | <65 | I/II | Chemotherapy | cisplatin | CR |
| XYLT2 | SNV | Missense_Mutation | c.1955N>T | p.Trp652Leu | p.W652L | Q9H1B5 | protein_coding | deleterious(0) | probably_damaging(0.98) | TCGA-AA-3672-01 | Colorectum | colon adenocarcinoma | Female | >=65 | III/IV | Unknown | Unknown | SD | |
| XYLT2 | SNV | Missense_Mutation | novel | c.1972N>A | p.Leu658Ile | p.L658I | Q9H1B5 | protein_coding | tolerated(1) | benign(0.02) | TCGA-AZ-4315-01 | Colorectum | colon adenocarcinoma | Male | <65 | I/II | Unknown | Unknown | SD |
| Page: 1 2 3 4 5 6 |
Top |
Related drugs of malignant transformation related genes |
| Identification of chemicals and drugs interact with genes involved in malignant transfromation |
| (DGIdb 4.0) |
| Entrez ID | Symbol | Category | Interaction Types | Drug Claim Name | Drug Name | PMIDs |
| 64132 | XYLT2 | ENZYME | gemcitabine | GEMCITABINE | 31616045 | |
| 64132 | XYLT2 | ENZYME | carboplatin | CARBOPLATIN | 31616045 |
| Page: 1 |

Copyright 2023-Present -The University of Texas Health Science Center at Houston |