
|
|||||
|
 | |
| |
| |
| |
| |
| |
|
Gene: XXYLT1 |
Gene summary for XXYLT1 |
| Gene information | Species | Human | Gene symbol | XXYLT1 | Gene ID | 152002 |
| Gene name | xyloside xylosyltransferase 1 | |
| Gene Alias | C3orf21 | |
| Cytomap | 3q29 | |
| Gene Type | protein-coding | GO ID | GO:0006464 | UniProtAcc | A0A140T9D0 |
Top |
Malignant transformation analysis |
| Identification of the aberrant gene expression in precancerous and cancerous lesions by comparing the gene expression of stem-like cells in diseased tissues with normal stem cells |
| Entrez ID | Symbol | Replicates | Species | Organ | Tissue | Adj P-value | Log2FC | Malignancy |
| 152002 | XXYLT1 | CCI_1 | Human | Cervix | CC | 5.27e-04 | 6.10e-01 | 0.528 |
| 152002 | XXYLT1 | CCI_2 | Human | Cervix | CC | 2.19e-05 | 9.87e-01 | 0.5249 |
| 152002 | XXYLT1 | CCI_3 | Human | Cervix | CC | 1.07e-04 | 6.72e-01 | 0.516 |
| 152002 | XXYLT1 | LZE2T | Human | Esophagus | ESCC | 4.73e-03 | 3.04e-01 | 0.082 |
| 152002 | XXYLT1 | LZE4T | Human | Esophagus | ESCC | 1.20e-04 | 1.48e-01 | 0.0811 |
| 152002 | XXYLT1 | LZE5T | Human | Esophagus | ESCC | 1.57e-02 | 1.89e-01 | 0.0514 |
| 152002 | XXYLT1 | LZE7T | Human | Esophagus | ESCC | 6.33e-03 | 2.09e-01 | 0.0667 |
| 152002 | XXYLT1 | LZE22T | Human | Esophagus | ESCC | 1.57e-03 | 2.48e-01 | 0.068 |
| 152002 | XXYLT1 | LZE24T | Human | Esophagus | ESCC | 6.43e-22 | 5.08e-01 | 0.0596 |
| 152002 | XXYLT1 | LZE21T | Human | Esophagus | ESCC | 2.11e-16 | 6.88e-01 | 0.0655 |
| 152002 | XXYLT1 | P1T-E | Human | Esophagus | ESCC | 4.62e-03 | 2.00e-01 | 0.0875 |
| 152002 | XXYLT1 | P2T-E | Human | Esophagus | ESCC | 1.33e-65 | 1.12e+00 | 0.1177 |
| 152002 | XXYLT1 | P4T-E | Human | Esophagus | ESCC | 1.35e-52 | 1.19e+00 | 0.1323 |
| 152002 | XXYLT1 | P5T-E | Human | Esophagus | ESCC | 4.40e-09 | 1.93e-01 | 0.1327 |
| 152002 | XXYLT1 | P8T-E | Human | Esophagus | ESCC | 3.89e-12 | 2.53e-01 | 0.0889 |
| 152002 | XXYLT1 | P9T-E | Human | Esophagus | ESCC | 1.69e-18 | 3.98e-01 | 0.1131 |
| 152002 | XXYLT1 | P10T-E | Human | Esophagus | ESCC | 6.38e-31 | 5.12e-01 | 0.116 |
| 152002 | XXYLT1 | P11T-E | Human | Esophagus | ESCC | 6.73e-20 | 6.26e-01 | 0.1426 |
| 152002 | XXYLT1 | P12T-E | Human | Esophagus | ESCC | 2.20e-48 | 8.33e-01 | 0.1122 |
| 152002 | XXYLT1 | P15T-E | Human | Esophagus | ESCC | 1.71e-29 | 5.79e-01 | 0.1149 |
| Page: 1 2 3 4 5 |
| Tissue | Expression Dynamics | Abbreviation |
| Cervix |  | CC: Cervix cancer |
| HSIL_HPV: HPV-infected high-grade squamous intraepithelial lesions | ||
| N_HPV: HPV-infected normal cervix | ||
| Esophagus | 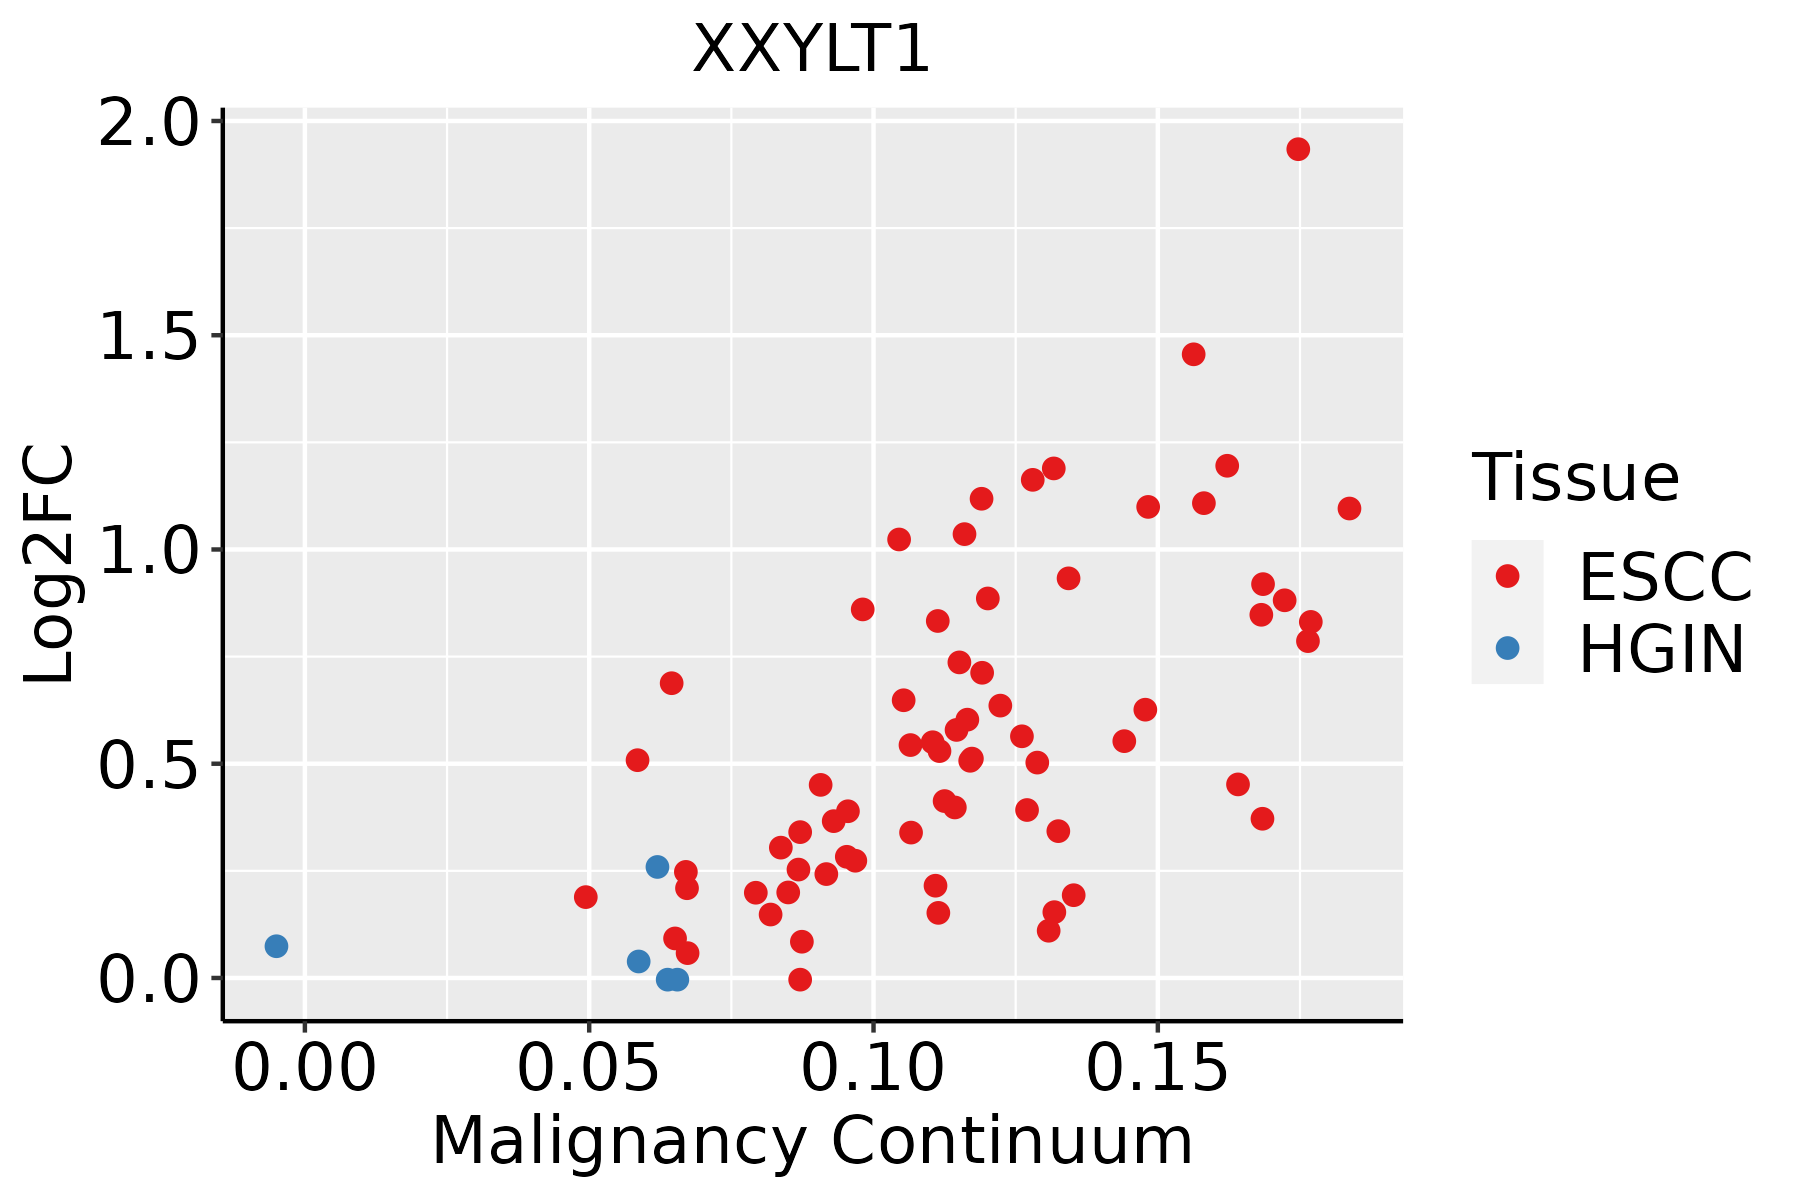 | ESCC: Esophageal squamous cell carcinoma |
| HGIN: High-grade intraepithelial neoplasias | ||
| LGIN: Low-grade intraepithelial neoplasias | ||
| Liver | 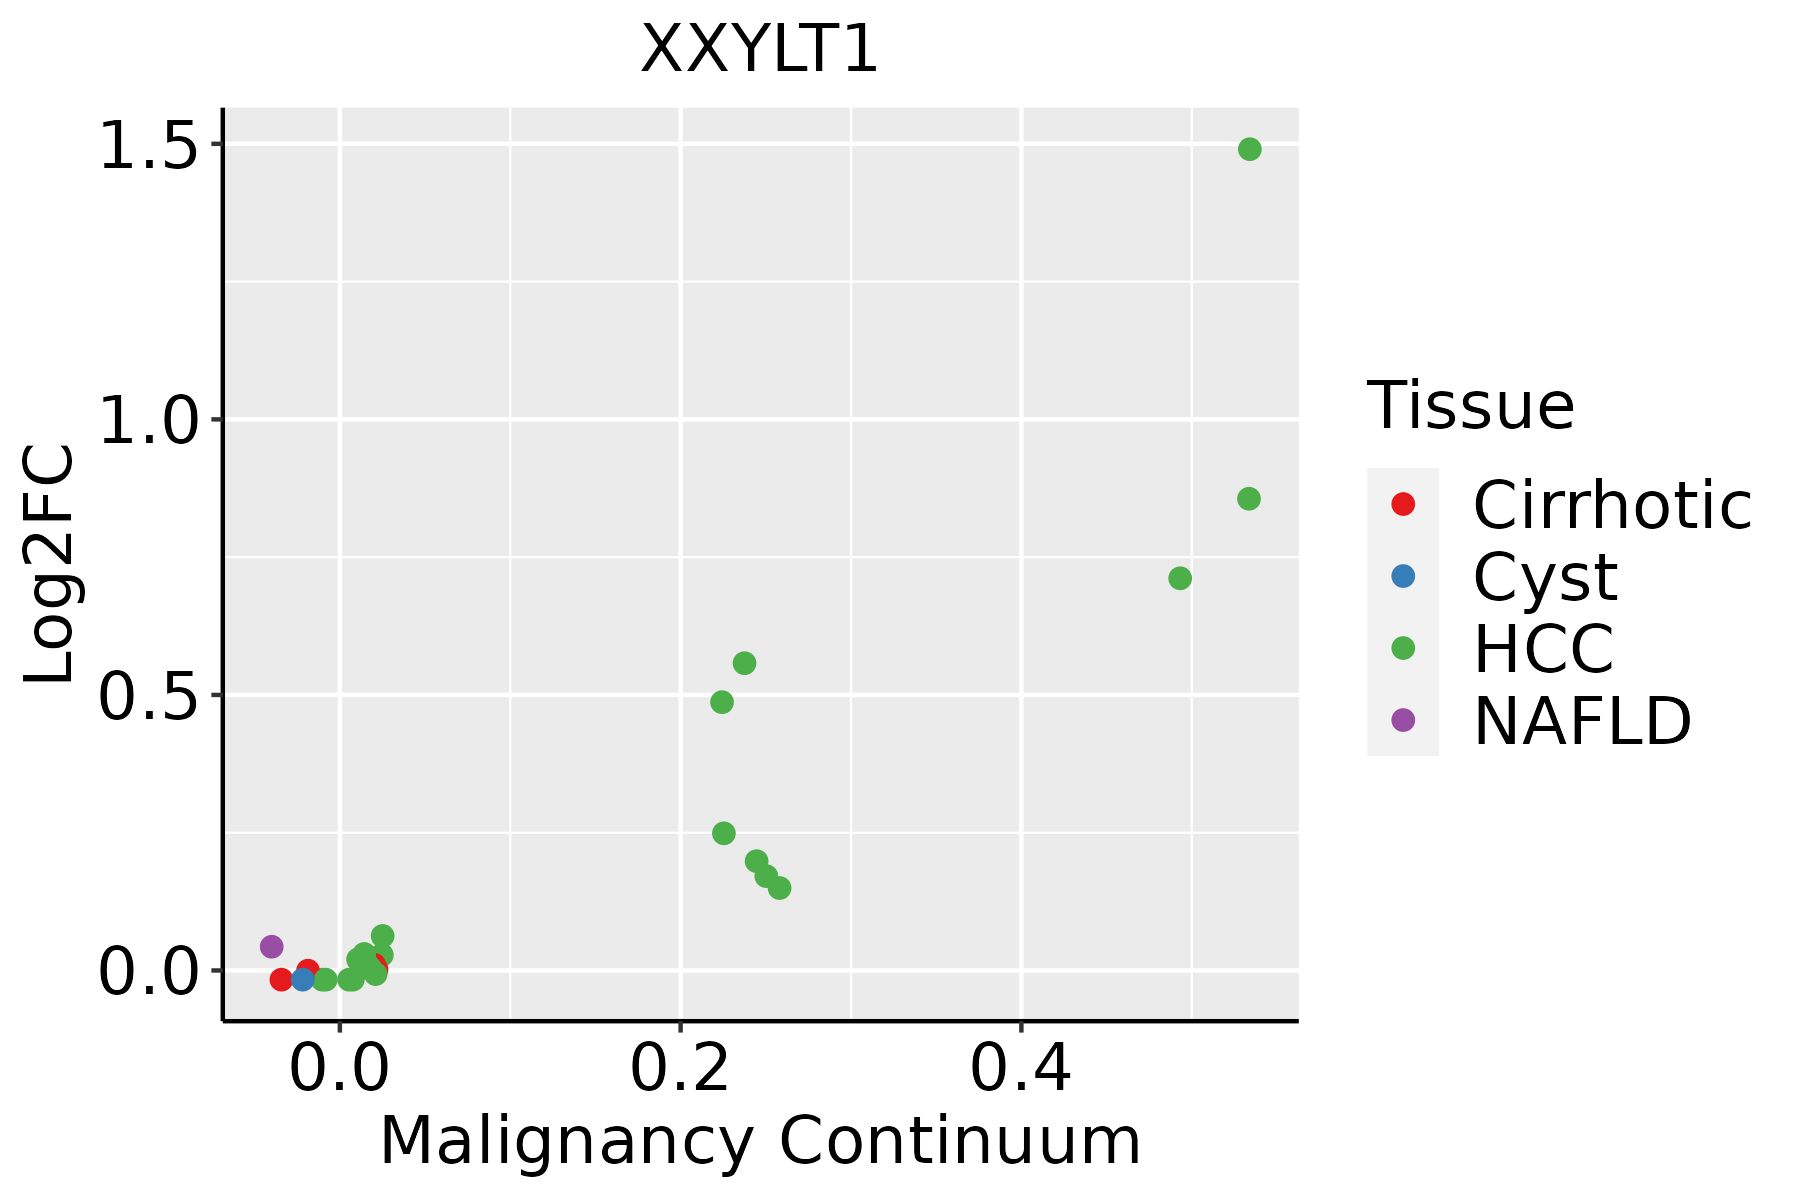 | HCC: Hepatocellular carcinoma |
| NAFLD: Non-alcoholic fatty liver disease | ||
| Oral Cavity | 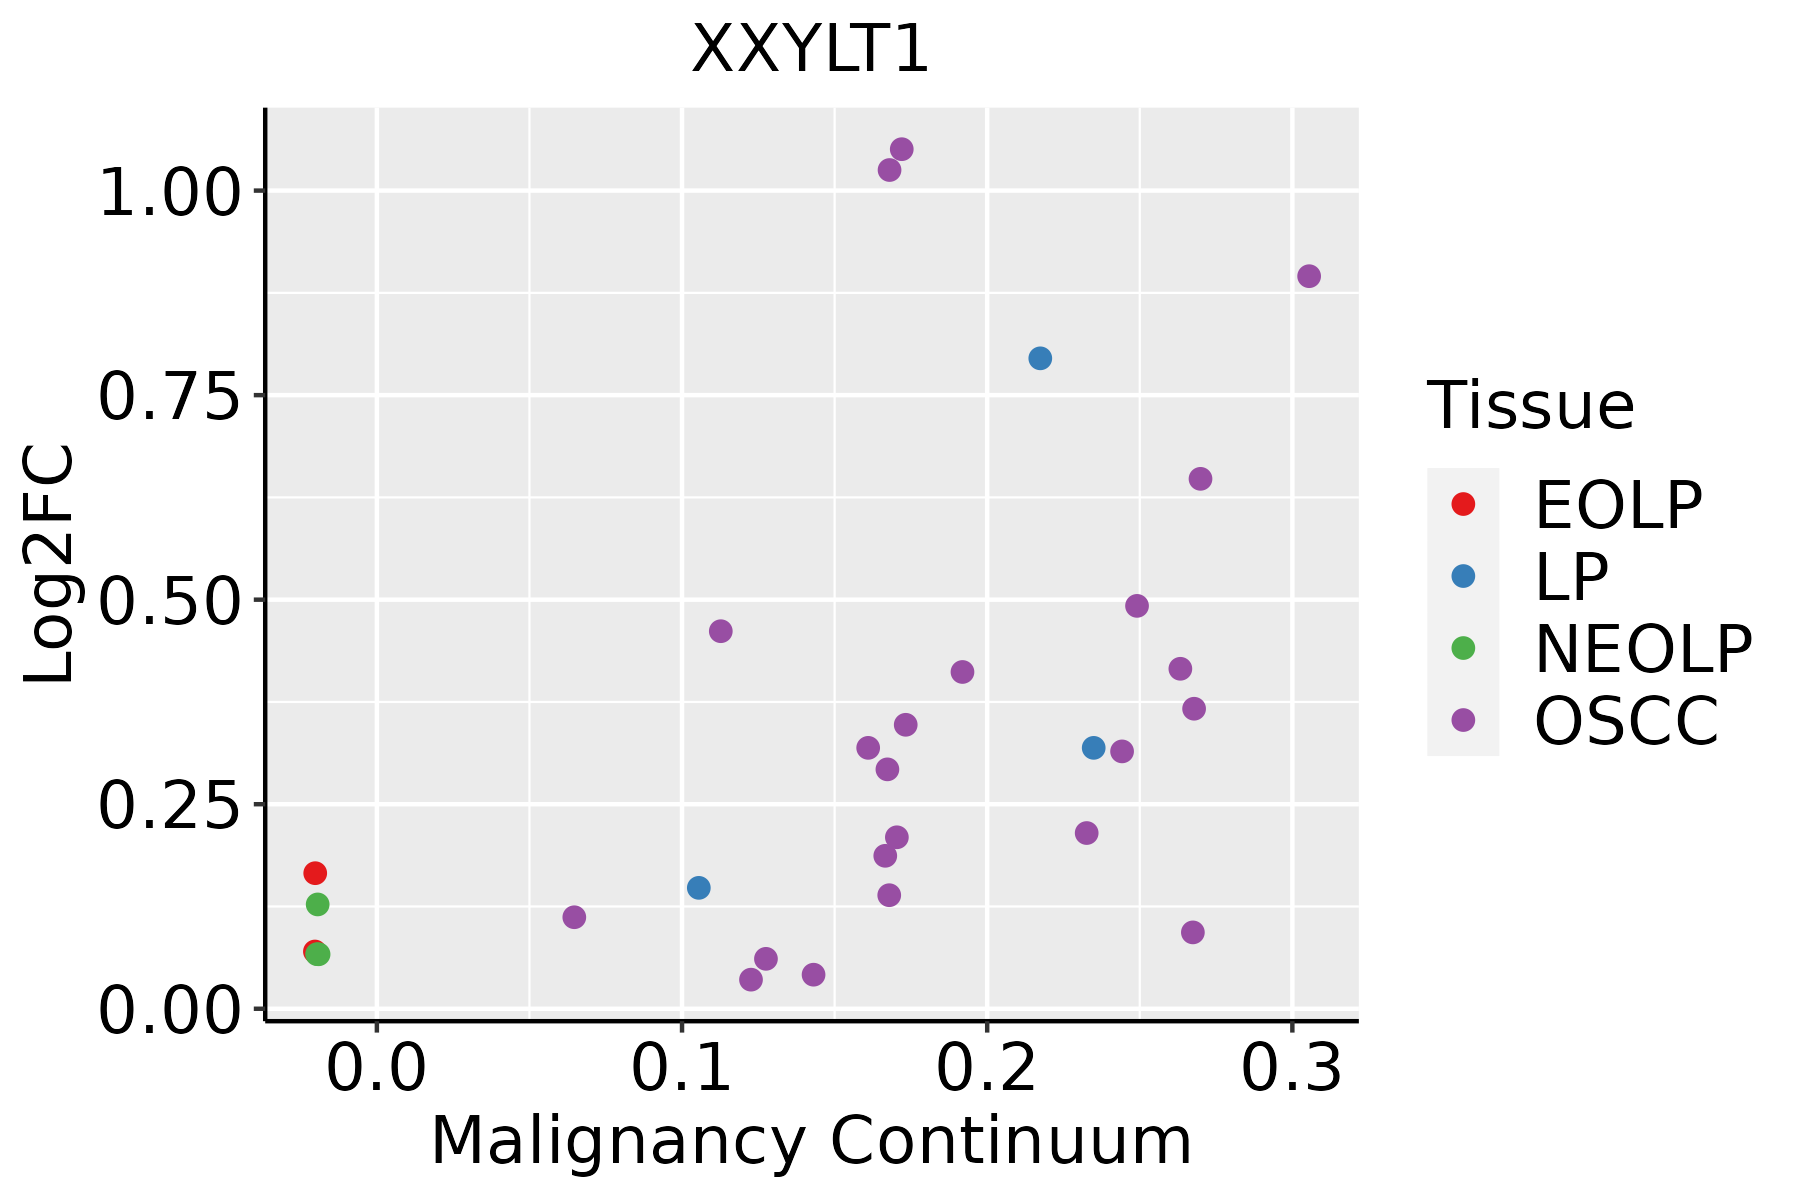 | EOLP: Erosive Oral lichen planus |
| LP: leukoplakia | ||
| NEOLP: Non-erosive oral lichen planus | ||
| OSCC: Oral squamous cell carcinoma |
| ∗log2FC in expression of this searched gene in stem-like cells from each diseased tissue sample relative to stem-like cells in normal samples in each tissue plotted against the malignancy continuum. Samples are colored based on if they are from different disease stage. |
Top |
Malignant transformation related pathway analysis |
| Find out the enriched GO biological processes and KEGG pathways involved in transition from healthy to precancer to cancer |
| Tissue | Disease Stage | Enriched GO biological Processes |
| Colorectum | AD |  |
| Colorectum | SER |  |
| Colorectum | MSS |  |
| Colorectum | MSI-H |  |
| Colorectum | FAP |  |
| ∗Top 15 enriched GO BP terms are showed in the bar plot of each disease state in each tissue. Each row represents a significant GO biological process which is colored according to the -log10(p.adjust). |
| Page: 1 2 3 4 5 6 7 8 9 |
| GO ID | Tissue | Disease Stage | Description | Gene Ratio | Bg Ratio | pvalue | p.adjust | Count |
| GO:00091002 | Esophagus | ESCC | glycoprotein metabolic process | 226/8552 | 387/18723 | 2.64e-07 | 3.94e-06 | 226 |
| GO:00700854 | Esophagus | ESCC | glycosylation | 144/8552 | 240/18723 | 5.12e-06 | 5.38e-05 | 144 |
| GO:00064865 | Esophagus | ESCC | protein glycosylation | 135/8552 | 226/18723 | 1.36e-05 | 1.24e-04 | 135 |
| GO:00434135 | Esophagus | ESCC | macromolecule glycosylation | 135/8552 | 226/18723 | 1.36e-05 | 1.24e-04 | 135 |
| GO:00091012 | Esophagus | ESCC | glycoprotein biosynthetic process | 181/8552 | 317/18723 | 2.54e-05 | 2.15e-04 | 181 |
| GO:00064931 | Esophagus | ESCC | protein O-linked glycosylation | 51/8552 | 86/18723 | 7.54e-03 | 2.70e-02 | 51 |
| GO:00064862 | Liver | HCC | protein glycosylation | 122/7958 | 226/18723 | 3.11e-04 | 2.21e-03 | 122 |
| GO:00434132 | Liver | HCC | macromolecule glycosylation | 122/7958 | 226/18723 | 3.11e-04 | 2.21e-03 | 122 |
| GO:00700852 | Liver | HCC | glycosylation | 128/7958 | 240/18723 | 4.35e-04 | 2.92e-03 | 128 |
| GO:0009100 | Liver | HCC | glycoprotein metabolic process | 193/7958 | 387/18723 | 1.89e-03 | 9.62e-03 | 193 |
| GO:00091001 | Oral cavity | OSCC | glycoprotein metabolic process | 185/7305 | 387/18723 | 2.37e-04 | 1.54e-03 | 185 |
| GO:00091011 | Oral cavity | OSCC | glycoprotein biosynthetic process | 151/7305 | 317/18723 | 1.01e-03 | 5.26e-03 | 151 |
| GO:00064864 | Oral cavity | OSCC | protein glycosylation | 111/7305 | 226/18723 | 1.22e-03 | 6.10e-03 | 111 |
| GO:00434134 | Oral cavity | OSCC | macromolecule glycosylation | 111/7305 | 226/18723 | 1.22e-03 | 6.10e-03 | 111 |
| GO:00700853 | Oral cavity | OSCC | glycosylation | 117/7305 | 240/18723 | 1.29e-03 | 6.42e-03 | 117 |
| GO:007008511 | Oral cavity | LP | glycosylation | 77/4623 | 240/18723 | 5.60e-03 | 3.38e-02 | 77 |
| GO:000648611 | Oral cavity | LP | protein glycosylation | 73/4623 | 226/18723 | 5.72e-03 | 3.44e-02 | 73 |
| GO:004341311 | Oral cavity | LP | macromolecule glycosylation | 73/4623 | 226/18723 | 5.72e-03 | 3.44e-02 | 73 |
| Page: 1 |
| Pathway ID | Tissue | Disease Stage | Description | Gene Ratio | Bg Ratio | pvalue | p.adjust | qvalue | Count |
| Page: 1 |
Top |
Cell-cell communication analysis |
| Identification of potential cell-cell interactions between two cell types and their ligand-receptor pairs for different disease states |
| Ligand | Receptor | LRpair | Pathway | Tissue | Disease Stage |
| Page: 1 |
Top |
Single-cell gene regulatory network inference analysis |
| Find out the significant the regulons (TFs) and the target genes of each regulon across cell types for different disease states |
| TF | Cell Type | Tissue | Disease Stage | Target Gene | RSS | Regulon Activity |
| ∗The dot plots of a searched regulon are shown for all cell subpopulations in each disease state of each tissue based on the regulon specific score inferred using pySCENIC and by calculating the average expression. |
| Page: 1 |
Top |
Somatic mutation of malignant transformation related genes |
| Annotation of somatic variants for genes involved in malignant transformation |
| Hugo Symbol | Variant Class | Variant Classification | dbSNP RS | HGVSc | HGVSp | HGVSp Short | SWISSPROT | BIOTYPE | SIFT | PolyPhen | Tumor Sample Barcode | Tissue | Histology | Sex | Age | Stage | Therapy Types | Drugs | Outcome |
| XXYLT1 | SNV | Missense_Mutation | c.724N>C | p.Phe242Leu | p.F242L | Q8NBI6 | protein_coding | deleterious(0) | probably_damaging(0.939) | TCGA-B6-A1KI-01 | Breast | breast invasive carcinoma | Female | <65 | I/II | Unknown | Unknown | SD | |
| XXYLT1 | SNV | Missense_Mutation | c.922C>T | p.Arg308Cys | p.R308C | Q8NBI6 | protein_coding | deleterious(0.01) | benign(0.347) | TCGA-D8-A27N-01 | Breast | breast invasive carcinoma | Female | <65 | III/IV | Chemotherapy | taxol+adriamycin+cyclophosphamide+herceptin | SD | |
| XXYLT1 | SNV | Missense_Mutation | rs570090519 | c.1135N>A | p.Val379Ile | p.V379I | Q8NBI6 | protein_coding | tolerated(0.39) | benign(0.019) | TCGA-EA-A410-01 | Cervix | cervical & endocervical cancer | Female | <65 | I/II | Unknown | Unknown | SD |
| XXYLT1 | SNV | Missense_Mutation | c.913N>T | p.Leu305Phe | p.L305F | Q8NBI6 | protein_coding | deleterious(0.03) | probably_damaging(0.959) | TCGA-A6-5665-01 | Colorectum | colon adenocarcinoma | Female | >=65 | I/II | Unknown | Unknown | PD | |
| XXYLT1 | SNV | Missense_Mutation | novel | c.1034N>C | p.Phe345Ser | p.F345S | Q8NBI6 | protein_coding | deleterious(0) | probably_damaging(0.999) | TCGA-AJ-A3EL-01 | Endometrium | uterine corpus endometrioid carcinoma | Female | <65 | I/II | Unknown | Unknown | SD |
| XXYLT1 | SNV | Missense_Mutation | novel | c.720N>T | p.Glu240Asp | p.E240D | Q8NBI6 | protein_coding | tolerated(0.4) | benign(0.031) | TCGA-AX-A1CE-01 | Endometrium | uterine corpus endometrioid carcinoma | Female | <65 | I/II | Unspecific | Paclitaxel | SD |
| XXYLT1 | SNV | Missense_Mutation | rs367727409 | c.623C>T | p.Ser208Leu | p.S208L | Q8NBI6 | protein_coding | deleterious(0) | probably_damaging(0.996) | TCGA-AX-A2HC-01 | Endometrium | uterine corpus endometrioid carcinoma | Female | <65 | III/IV | Chemotherapy | paclitaxel | PD |
| XXYLT1 | SNV | Missense_Mutation | rs779456915 | c.902N>A | p.Arg301His | p.R301H | Q8NBI6 | protein_coding | deleterious(0) | probably_damaging(0.966) | TCGA-B5-A0JZ-01 | Endometrium | uterine corpus endometrioid carcinoma | Female | <65 | III/IV | Chemotherapy | carboplatin | PD |
| XXYLT1 | SNV | Missense_Mutation | rs200992381 | c.1060N>T | p.Arg354Trp | p.R354W | Q8NBI6 | protein_coding | deleterious(0) | probably_damaging(0.986) | TCGA-EY-A215-01 | Endometrium | uterine corpus endometrioid carcinoma | Female | <65 | I/II | Unknown | Unknown | SD |
| XXYLT1 | SNV | Missense_Mutation | novel | c.901N>T | p.Arg301Cys | p.R301C | Q8NBI6 | protein_coding | deleterious(0) | probably_damaging(0.966) | TCGA-EY-A215-01 | Endometrium | uterine corpus endometrioid carcinoma | Female | <65 | I/II | Unknown | Unknown | SD |
| Page: 1 2 3 |
Top |
Related drugs of malignant transformation related genes |
| Identification of chemicals and drugs interact with genes involved in malignant transfromation |
| (DGIdb 4.0) |
| Entrez ID | Symbol | Category | Interaction Types | Drug Claim Name | Drug Name | PMIDs |
| Page: 1 |

Copyright 2023-Present -The University of Texas Health Science Center at Houston |