
|
|||||
|
 | |
| |
| |
| |
| |
| |
|
Gene: XRRA1 |
Gene summary for XRRA1 |
| Gene information | Species | Human | Gene symbol | XRRA1 | Gene ID | 143570 |
| Gene name | X-ray radiation resistance associated 1 | |
| Gene Alias | XRRA1 | |
| Cytomap | 11q13.4 | |
| Gene Type | protein-coding | GO ID | GO:0008150 | UniProtAcc | Q6P2D8 |
Top |
Malignant transformation analysis |
| Identification of the aberrant gene expression in precancerous and cancerous lesions by comparing the gene expression of stem-like cells in diseased tissues with normal stem cells |
| Entrez ID | Symbol | Replicates | Species | Organ | Tissue | Adj P-value | Log2FC | Malignancy |
| 143570 | XRRA1 | LZE4T | Human | Esophagus | ESCC | 3.01e-14 | 3.46e-01 | 0.0811 |
| 143570 | XRRA1 | LZE20T | Human | Esophagus | ESCC | 2.84e-03 | 1.37e-01 | 0.0662 |
| 143570 | XRRA1 | LZE24T | Human | Esophagus | ESCC | 4.75e-04 | 1.82e-01 | 0.0596 |
| 143570 | XRRA1 | LZE6T | Human | Esophagus | ESCC | 1.17e-02 | 1.55e-01 | 0.0845 |
| 143570 | XRRA1 | P1T-E | Human | Esophagus | ESCC | 9.82e-05 | 2.43e-01 | 0.0875 |
| 143570 | XRRA1 | P2T-E | Human | Esophagus | ESCC | 2.78e-47 | 8.26e-01 | 0.1177 |
| 143570 | XRRA1 | P4T-E | Human | Esophagus | ESCC | 2.15e-16 | 3.41e-01 | 0.1323 |
| 143570 | XRRA1 | P5T-E | Human | Esophagus | ESCC | 1.54e-12 | 2.60e-01 | 0.1327 |
| 143570 | XRRA1 | P8T-E | Human | Esophagus | ESCC | 1.63e-15 | 2.36e-01 | 0.0889 |
| 143570 | XRRA1 | P9T-E | Human | Esophagus | ESCC | 6.65e-05 | 1.52e-01 | 0.1131 |
| 143570 | XRRA1 | P10T-E | Human | Esophagus | ESCC | 4.58e-18 | 1.66e-01 | 0.116 |
| 143570 | XRRA1 | P11T-E | Human | Esophagus | ESCC | 7.48e-15 | 5.91e-01 | 0.1426 |
| 143570 | XRRA1 | P12T-E | Human | Esophagus | ESCC | 1.31e-20 | 3.43e-01 | 0.1122 |
| 143570 | XRRA1 | P16T-E | Human | Esophagus | ESCC | 6.45e-15 | 2.04e-01 | 0.1153 |
| 143570 | XRRA1 | P17T-E | Human | Esophagus | ESCC | 8.08e-06 | 2.83e-01 | 0.1278 |
| 143570 | XRRA1 | P20T-E | Human | Esophagus | ESCC | 1.24e-03 | 1.17e-01 | 0.1124 |
| 143570 | XRRA1 | P21T-E | Human | Esophagus | ESCC | 8.46e-06 | 1.27e-01 | 0.1617 |
| 143570 | XRRA1 | P22T-E | Human | Esophagus | ESCC | 1.20e-11 | 2.29e-01 | 0.1236 |
| 143570 | XRRA1 | P23T-E | Human | Esophagus | ESCC | 1.32e-22 | 5.43e-01 | 0.108 |
| 143570 | XRRA1 | P24T-E | Human | Esophagus | ESCC | 4.39e-04 | 5.48e-02 | 0.1287 |
| Page: 1 2 3 4 |
| Tissue | Expression Dynamics | Abbreviation |
| Esophagus | 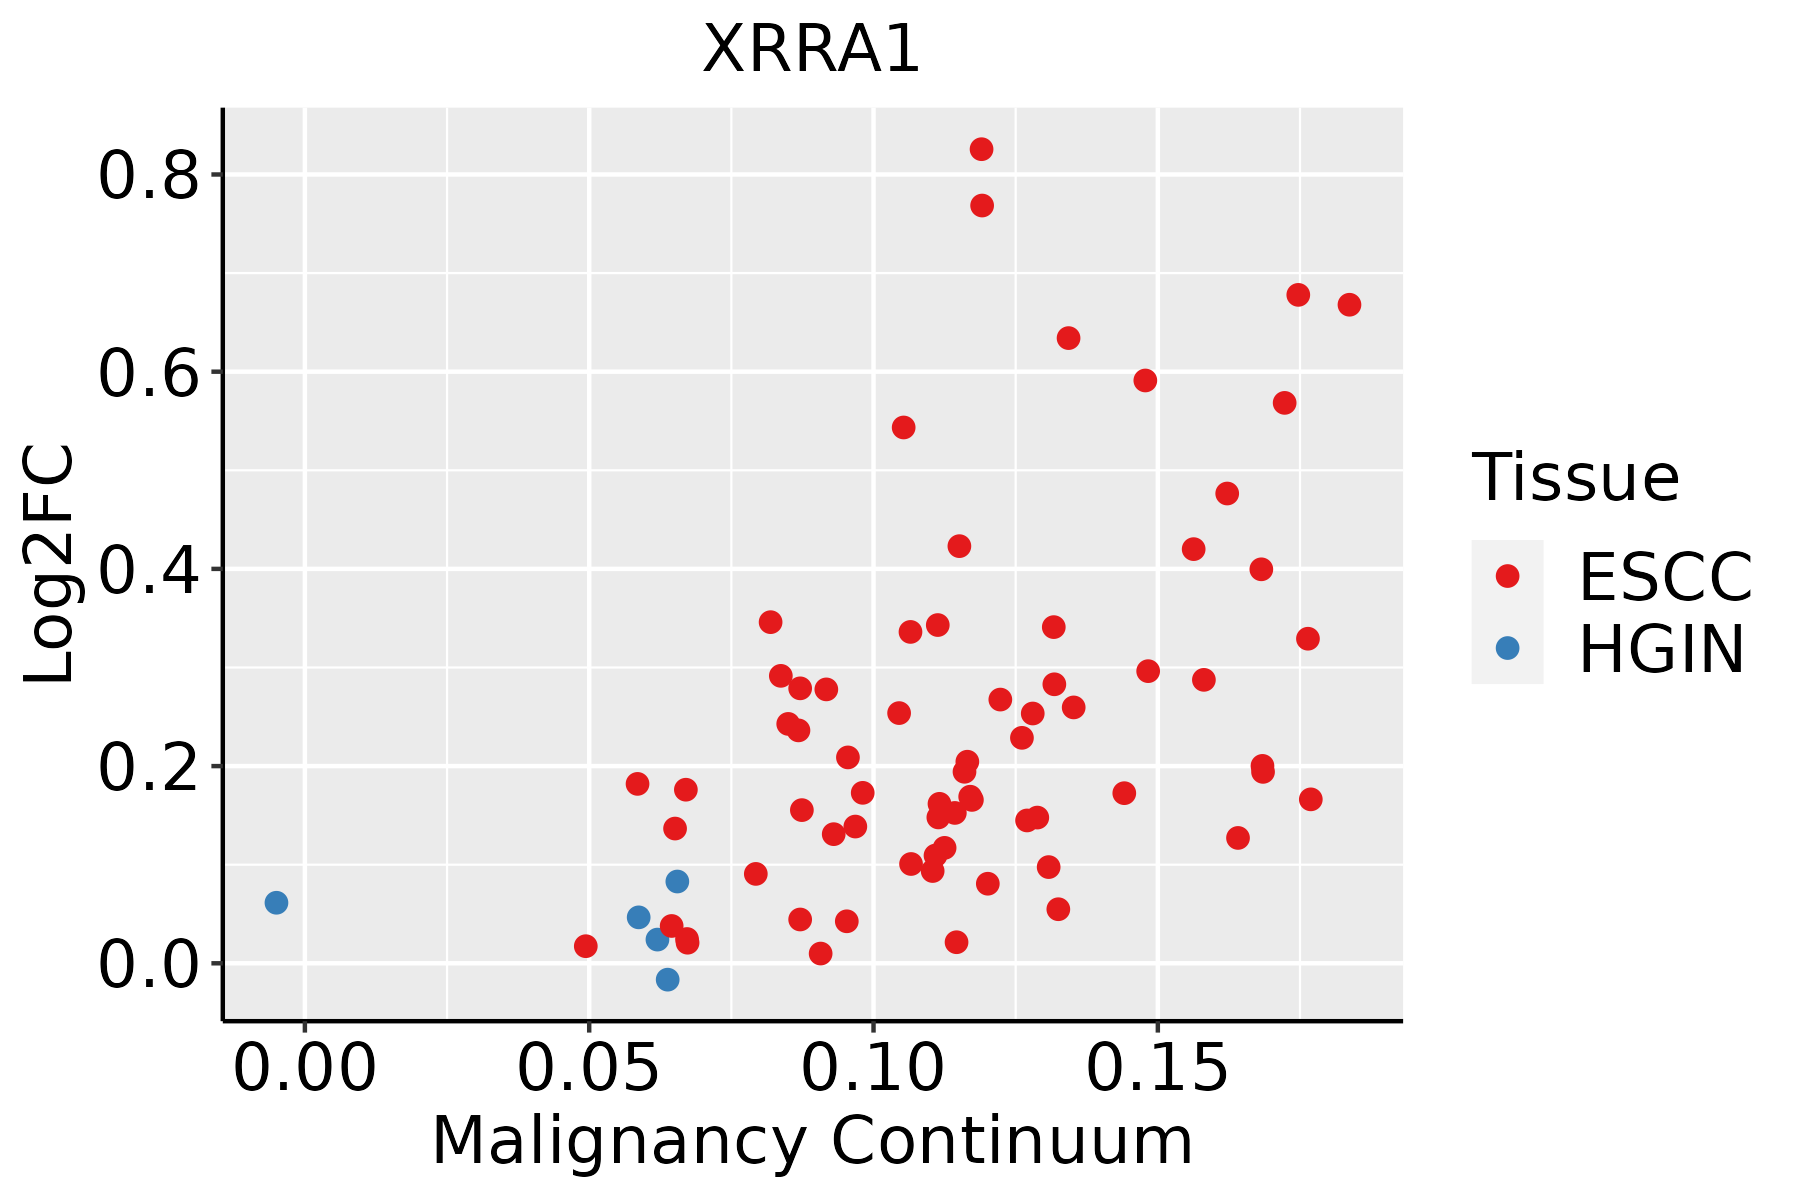 | ESCC: Esophageal squamous cell carcinoma |
| HGIN: High-grade intraepithelial neoplasias | ||
| LGIN: Low-grade intraepithelial neoplasias | ||
| Oral Cavity | 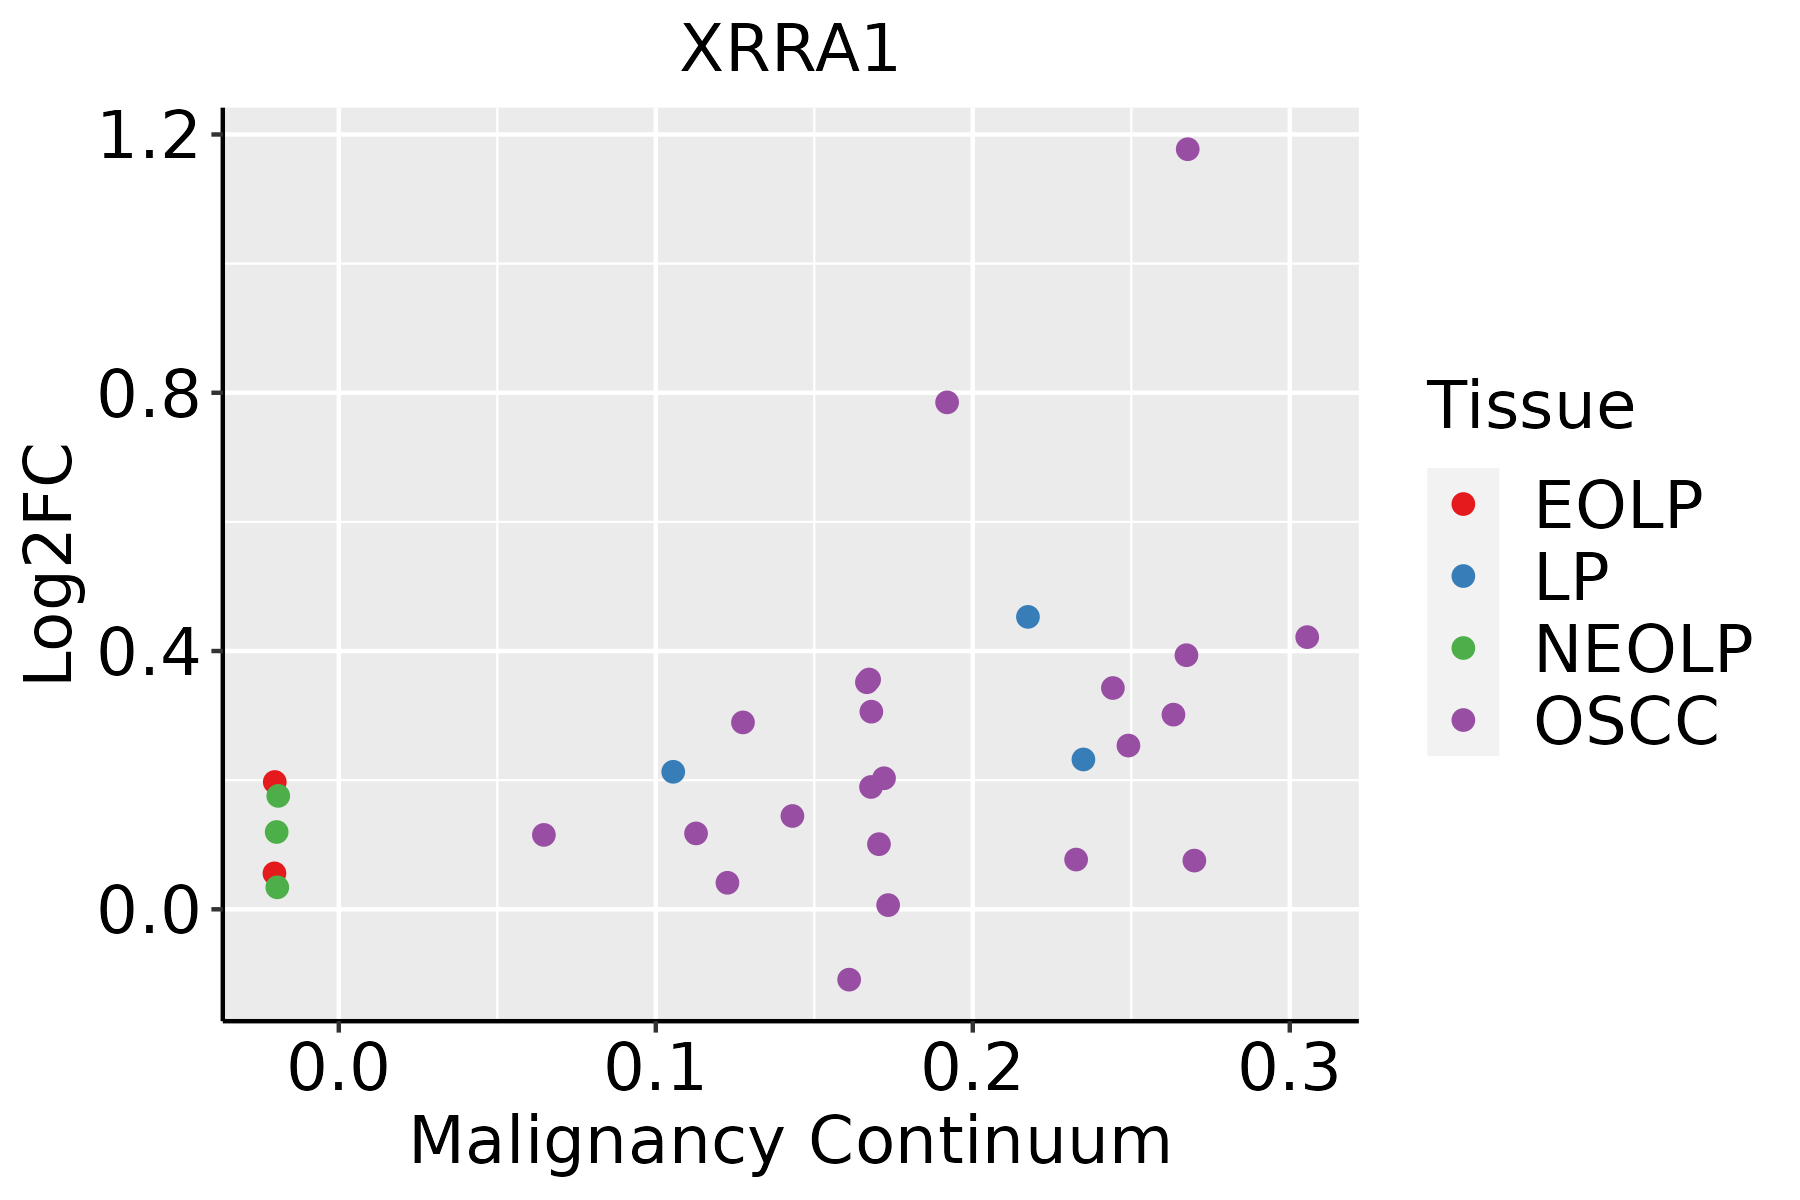 | EOLP: Erosive Oral lichen planus |
| LP: leukoplakia | ||
| NEOLP: Non-erosive oral lichen planus | ||
| OSCC: Oral squamous cell carcinoma | ||
| Thyroid |  | ATC: Anaplastic thyroid cancer |
| HT: Hashimoto's thyroiditis | ||
| PTC: Papillary thyroid cancer |
| ∗log2FC in expression of this searched gene in stem-like cells from each diseased tissue sample relative to stem-like cells in normal samples in each tissue plotted against the malignancy continuum. Samples are colored based on if they are from different disease stage. |
Top |
Malignant transformation related pathway analysis |
| Find out the enriched GO biological processes and KEGG pathways involved in transition from healthy to precancer to cancer |
| Tissue | Disease Stage | Enriched GO biological Processes |
| Colorectum | AD |  |
| Colorectum | SER |  |
| Colorectum | MSS |  |
| Colorectum | MSI-H |  |
| Colorectum | FAP |  |
| ∗Top 15 enriched GO BP terms are showed in the bar plot of each disease state in each tissue. Each row represents a significant GO biological process which is colored according to the -log10(p.adjust). |
| Page: 1 2 3 4 5 6 7 8 9 |
| GO ID | Tissue | Disease Stage | Description | Gene Ratio | Bg Ratio | pvalue | p.adjust | Count |
| GO:001021217 | Esophagus | ESCC | response to ionizing radiation | 110/8552 | 148/18723 | 1.11e-12 | 4.78e-11 | 110 |
| GO:000931419 | Esophagus | ESCC | response to radiation | 277/8552 | 456/18723 | 4.42e-11 | 1.43e-09 | 277 |
| GO:00101653 | Esophagus | ESCC | response to X-ray | 24/8552 | 33/18723 | 1.50e-03 | 7.06e-03 | 24 |
| GO:00102128 | Oral cavity | OSCC | response to ionizing radiation | 99/7305 | 148/18723 | 5.49e-12 | 2.08e-10 | 99 |
| GO:000931416 | Oral cavity | OSCC | response to radiation | 241/7305 | 456/18723 | 9.76e-10 | 2.40e-08 | 241 |
| GO:00101652 | Oral cavity | OSCC | response to X-ray | 22/7305 | 33/18723 | 1.19e-03 | 6.03e-03 | 22 |
| GO:001021224 | Oral cavity | EOLP | response to ionizing radiation | 34/2218 | 148/18723 | 1.01e-04 | 1.15e-03 | 34 |
| GO:000931423 | Oral cavity | EOLP | response to radiation | 72/2218 | 456/18723 | 6.60e-03 | 3.23e-02 | 72 |
| GO:001021219 | Thyroid | PTC | response to ionizing radiation | 79/5968 | 148/18723 | 4.56e-08 | 9.74e-07 | 79 |
| GO:0009314111 | Thyroid | PTC | response to radiation | 195/5968 | 456/18723 | 5.10e-07 | 8.27e-06 | 195 |
| GO:00101655 | Thyroid | PTC | response to X-ray | 18/5968 | 33/18723 | 5.77e-03 | 2.60e-02 | 18 |
| GO:000931426 | Thyroid | ATC | response to radiation | 210/6293 | 456/18723 | 1.69e-08 | 3.39e-07 | 210 |
| GO:0010212110 | Thyroid | ATC | response to ionizing radiation | 82/6293 | 148/18723 | 3.88e-08 | 7.15e-07 | 82 |
| GO:001016511 | Thyroid | ATC | response to X-ray | 20/6293 | 33/18723 | 1.33e-03 | 6.96e-03 | 20 |
| Page: 1 |
| Pathway ID | Tissue | Disease Stage | Description | Gene Ratio | Bg Ratio | pvalue | p.adjust | qvalue | Count |
| Page: 1 |
Top |
Cell-cell communication analysis |
| Identification of potential cell-cell interactions between two cell types and their ligand-receptor pairs for different disease states |
| Ligand | Receptor | LRpair | Pathway | Tissue | Disease Stage |
| Page: 1 |
Top |
Single-cell gene regulatory network inference analysis |
| Find out the significant the regulons (TFs) and the target genes of each regulon across cell types for different disease states |
| TF | Cell Type | Tissue | Disease Stage | Target Gene | RSS | Regulon Activity |
| ∗The dot plots of a searched regulon are shown for all cell subpopulations in each disease state of each tissue based on the regulon specific score inferred using pySCENIC and by calculating the average expression. |
| Page: 1 |
Top |
Somatic mutation of malignant transformation related genes |
| Annotation of somatic variants for genes involved in malignant transformation |
| Hugo Symbol | Variant Class | Variant Classification | dbSNP RS | HGVSc | HGVSp | HGVSp Short | SWISSPROT | BIOTYPE | SIFT | PolyPhen | Tumor Sample Barcode | Tissue | Histology | Sex | Age | Stage | Therapy Types | Drugs | Outcome |
| XRRA1 | SNV | Missense_Mutation | c.925G>C | p.Asp309His | p.D309H | Q6P2D8 | protein_coding | deleterious(0.02) | benign(0.253) | TCGA-AR-A250-01 | Breast | breast invasive carcinoma | Female | <65 | I/II | Chemotherapy | doxorubicin | SD | |
| XRRA1 | SNV | Missense_Mutation | novel | c.1081N>A | p.Ala361Thr | p.A361T | Q6P2D8 | protein_coding | tolerated(0.14) | benign(0.212) | TCGA-BH-A0B4-01 | Breast | breast invasive carcinoma | Male | >=65 | III/IV | Hormone Therapy | tamoxiphen | SD |
| XRRA1 | SNV | Missense_Mutation | rs765465931 | c.584N>T | p.Thr195Ile | p.T195I | Q6P2D8 | protein_coding | deleterious(0) | probably_damaging(0.993) | TCGA-BH-A0BP-01 | Breast | breast invasive carcinoma | Female | >=65 | I/II | Unknown | Unknown | SD |
| XRRA1 | SNV | Missense_Mutation | c.1127N>G | p.Leu376Arg | p.L376R | Q6P2D8 | protein_coding | deleterious(0) | probably_damaging(0.998) | TCGA-C8-A130-01 | Breast | breast invasive carcinoma | Female | <65 | III/IV | Unknown | Unknown | SD | |
| XRRA1 | SNV | Missense_Mutation | novel | c.17N>G | p.Ile6Ser | p.I6S | Q6P2D8 | protein_coding | tolerated(0.08) | benign(0.001) | TCGA-E2-A15H-01 | Breast | breast invasive carcinoma | Female | <65 | I/II | Chemotherapy | herceptin | SD |
| XRRA1 | SNV | Missense_Mutation | c.544N>T | p.Asp182Tyr | p.D182Y | Q6P2D8 | protein_coding | deleterious(0.02) | possibly_damaging(0.73) | TCGA-E9-A243-01 | Breast | breast invasive carcinoma | Female | <65 | I/II | Chemotherapy | 5-fluorouracil | PD | |
| XRRA1 | insertion | Frame_Shift_Ins | novel | c.205_206insGGATGCTTGCTAGCTTTGTGGTTAAACC | p.Phe69TrpfsTer50 | p.F69Wfs*50 | Q6P2D8 | protein_coding | TCGA-AN-A04A-01 | Breast | breast invasive carcinoma | Female | <65 | III/IV | Unknown | Unknown | SD | ||
| XRRA1 | SNV | Missense_Mutation | novel | c.11C>T | p.Ser4Leu | p.S4L | Q6P2D8 | protein_coding | tolerated(0.07) | benign(0.001) | TCGA-C5-A3HF-01 | Cervix | cervical & endocervical cancer | Female | <65 | I/II | Unknown | Unknown | PD |
| XRRA1 | SNV | Missense_Mutation | c.2298N>C | p.Glu766Asp | p.E766D | Q6P2D8 | protein_coding | tolerated_low_confidence(0.12) | benign(0.073) | TCGA-LP-A4AX-01 | Cervix | cervical & endocervical cancer | Female | <65 | I/II | Unknown | Unknown | SD | |
| XRRA1 | SNV | Missense_Mutation | c.2249N>T | p.Thr750Ile | p.T750I | Q6P2D8 | protein_coding | deleterious(0.01) | benign(0.23) | TCGA-A6-2682-01 | Colorectum | colon adenocarcinoma | Male | >=65 | III/IV | Chemotherapy | 5 | PD |
| Page: 1 2 3 4 5 6 7 |
Top |
Related drugs of malignant transformation related genes |
| Identification of chemicals and drugs interact with genes involved in malignant transfromation |
| (DGIdb 4.0) |
| Entrez ID | Symbol | Category | Interaction Types | Drug Claim Name | Drug Name | PMIDs |
| Page: 1 |

Copyright 2023-Present -The University of Texas Health Science Center at Houston |