
|
|||||
|
 | |
| |
| |
| |
| |
| |
|
Gene: XRN1 |
Gene summary for XRN1 |
| Gene information | Species | Human | Gene symbol | XRN1 | Gene ID | 54464 |
| Gene name | 5'-3' exoribonuclease 1 | |
| Gene Alias | SEP1 | |
| Cytomap | 3q23 | |
| Gene Type | protein-coding | GO ID | GO:0000723 | UniProtAcc | Q8IZH2 |
Top |
Malignant transformation analysis |
| Identification of the aberrant gene expression in precancerous and cancerous lesions by comparing the gene expression of stem-like cells in diseased tissues with normal stem cells |
| Entrez ID | Symbol | Replicates | Species | Organ | Tissue | Adj P-value | Log2FC | Malignancy |
| 54464 | XRN1 | CA_HPV_1 | Human | Cervix | CC | 2.24e-02 | 2.39e-01 | 0.0264 |
| 54464 | XRN1 | CA_HPV_3 | Human | Cervix | CC | 3.08e-02 | 8.48e-02 | 0.0414 |
| 54464 | XRN1 | CCI_1 | Human | Cervix | CC | 1.59e-10 | 1.17e+00 | 0.528 |
| 54464 | XRN1 | CCI_2 | Human | Cervix | CC | 2.83e-19 | 2.37e+00 | 0.5249 |
| 54464 | XRN1 | CCI_3 | Human | Cervix | CC | 3.51e-24 | 1.46e+00 | 0.516 |
| 54464 | XRN1 | T3 | Human | Cervix | CC | 1.61e-03 | 1.96e-01 | 0.1389 |
| 54464 | XRN1 | LZE4T | Human | Esophagus | ESCC | 1.68e-20 | 6.69e-01 | 0.0811 |
| 54464 | XRN1 | LZE5T | Human | Esophagus | ESCC | 8.01e-06 | 2.20e-01 | 0.0514 |
| 54464 | XRN1 | LZE7T | Human | Esophagus | ESCC | 1.22e-08 | 5.31e-01 | 0.0667 |
| 54464 | XRN1 | LZE8T | Human | Esophagus | ESCC | 8.81e-17 | 4.62e-01 | 0.067 |
| 54464 | XRN1 | LZE20T | Human | Esophagus | ESCC | 5.43e-04 | 2.33e-01 | 0.0662 |
| 54464 | XRN1 | LZE22D1 | Human | Esophagus | HGIN | 4.57e-02 | 1.49e-01 | 0.0595 |
| 54464 | XRN1 | LZE22T | Human | Esophagus | ESCC | 2.40e-03 | 3.77e-01 | 0.068 |
| 54464 | XRN1 | LZE24T | Human | Esophagus | ESCC | 6.89e-27 | 6.86e-01 | 0.0596 |
| 54464 | XRN1 | LZE6T | Human | Esophagus | ESCC | 1.95e-03 | 2.52e-01 | 0.0845 |
| 54464 | XRN1 | P1T-E | Human | Esophagus | ESCC | 3.86e-11 | 7.00e-01 | 0.0875 |
| 54464 | XRN1 | P2T-E | Human | Esophagus | ESCC | 2.06e-94 | 1.51e+00 | 0.1177 |
| 54464 | XRN1 | P4T-E | Human | Esophagus | ESCC | 1.62e-20 | 4.86e-01 | 0.1323 |
| 54464 | XRN1 | P5T-E | Human | Esophagus | ESCC | 2.07e-35 | 5.74e-01 | 0.1327 |
| 54464 | XRN1 | P8T-E | Human | Esophagus | ESCC | 2.19e-41 | 6.73e-01 | 0.0889 |
| Page: 1 2 3 4 5 6 7 8 |
| Tissue | Expression Dynamics | Abbreviation |
| Cervix | 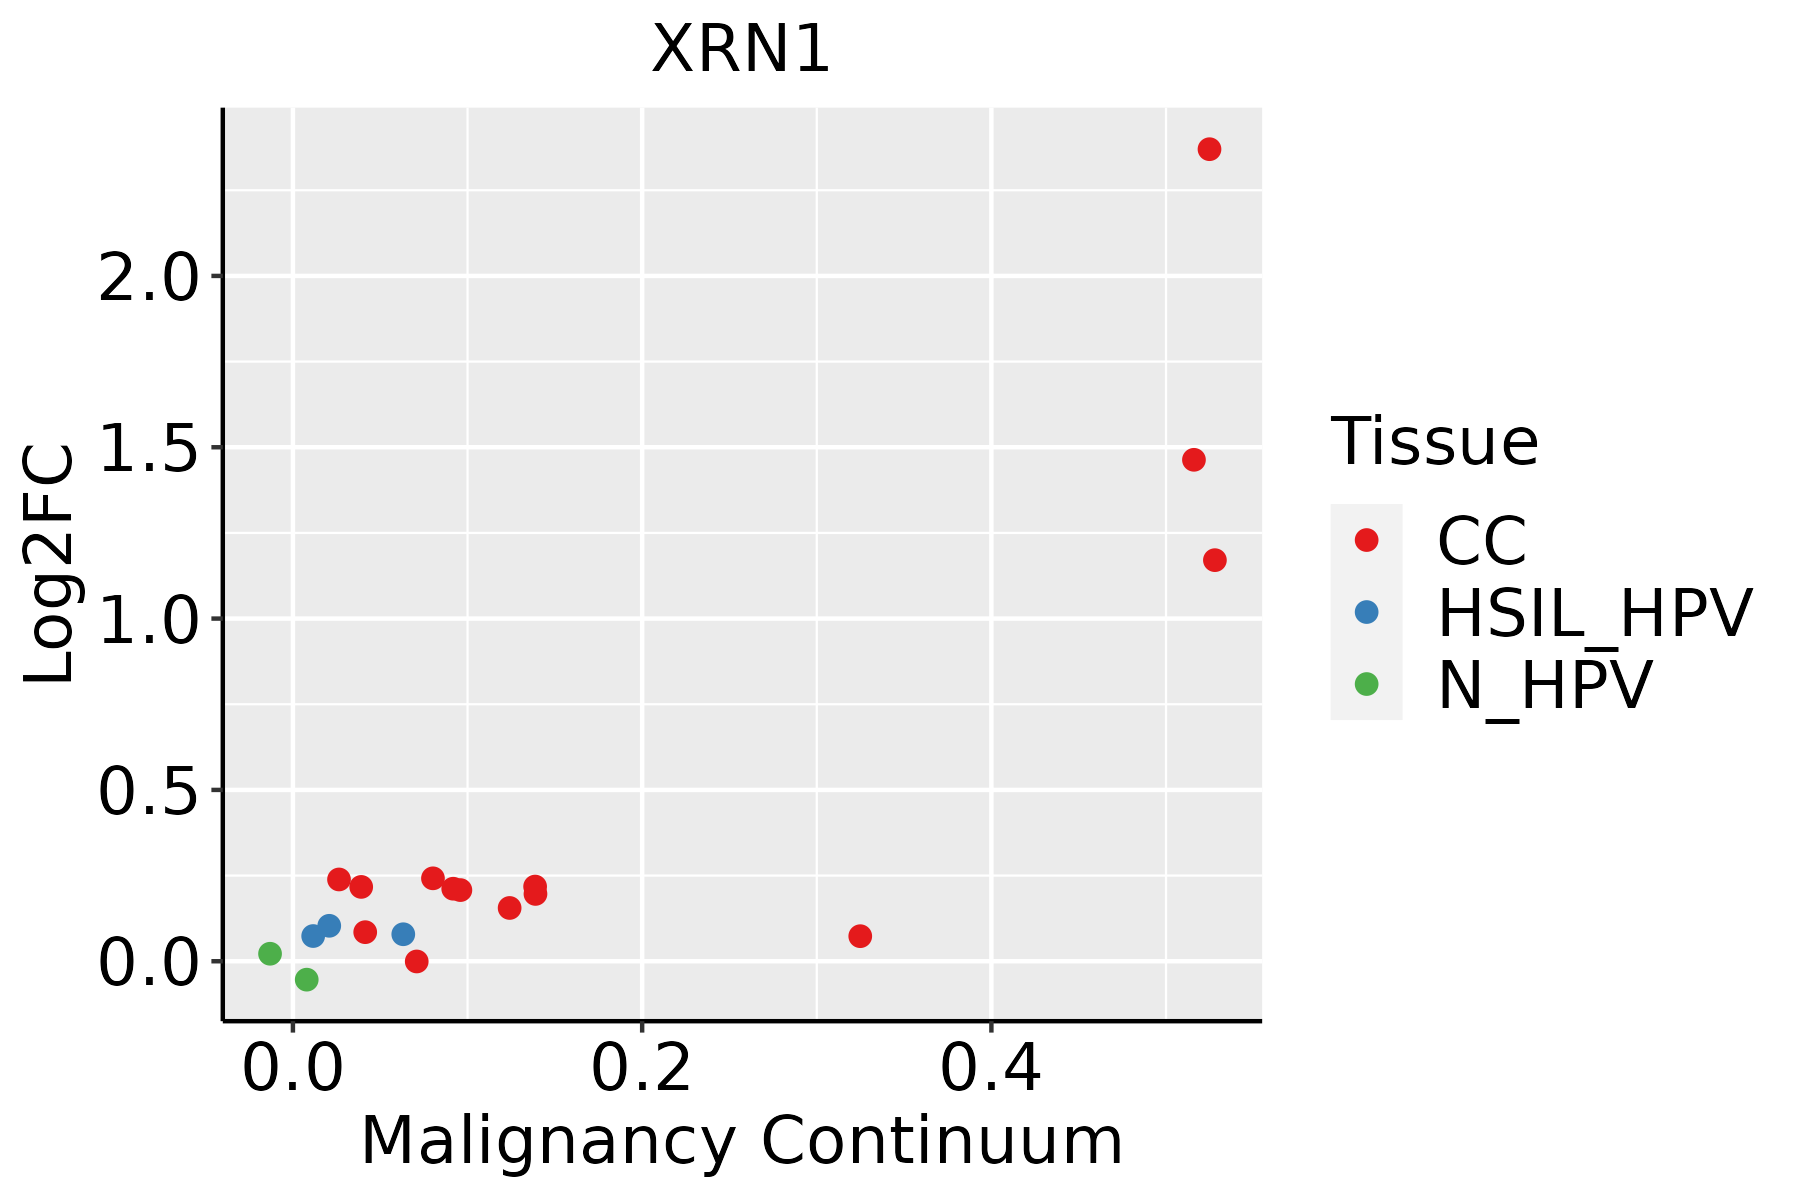 | CC: Cervix cancer |
| HSIL_HPV: HPV-infected high-grade squamous intraepithelial lesions | ||
| N_HPV: HPV-infected normal cervix | ||
| Esophagus |  | ESCC: Esophageal squamous cell carcinoma |
| HGIN: High-grade intraepithelial neoplasias | ||
| LGIN: Low-grade intraepithelial neoplasias | ||
| Liver | 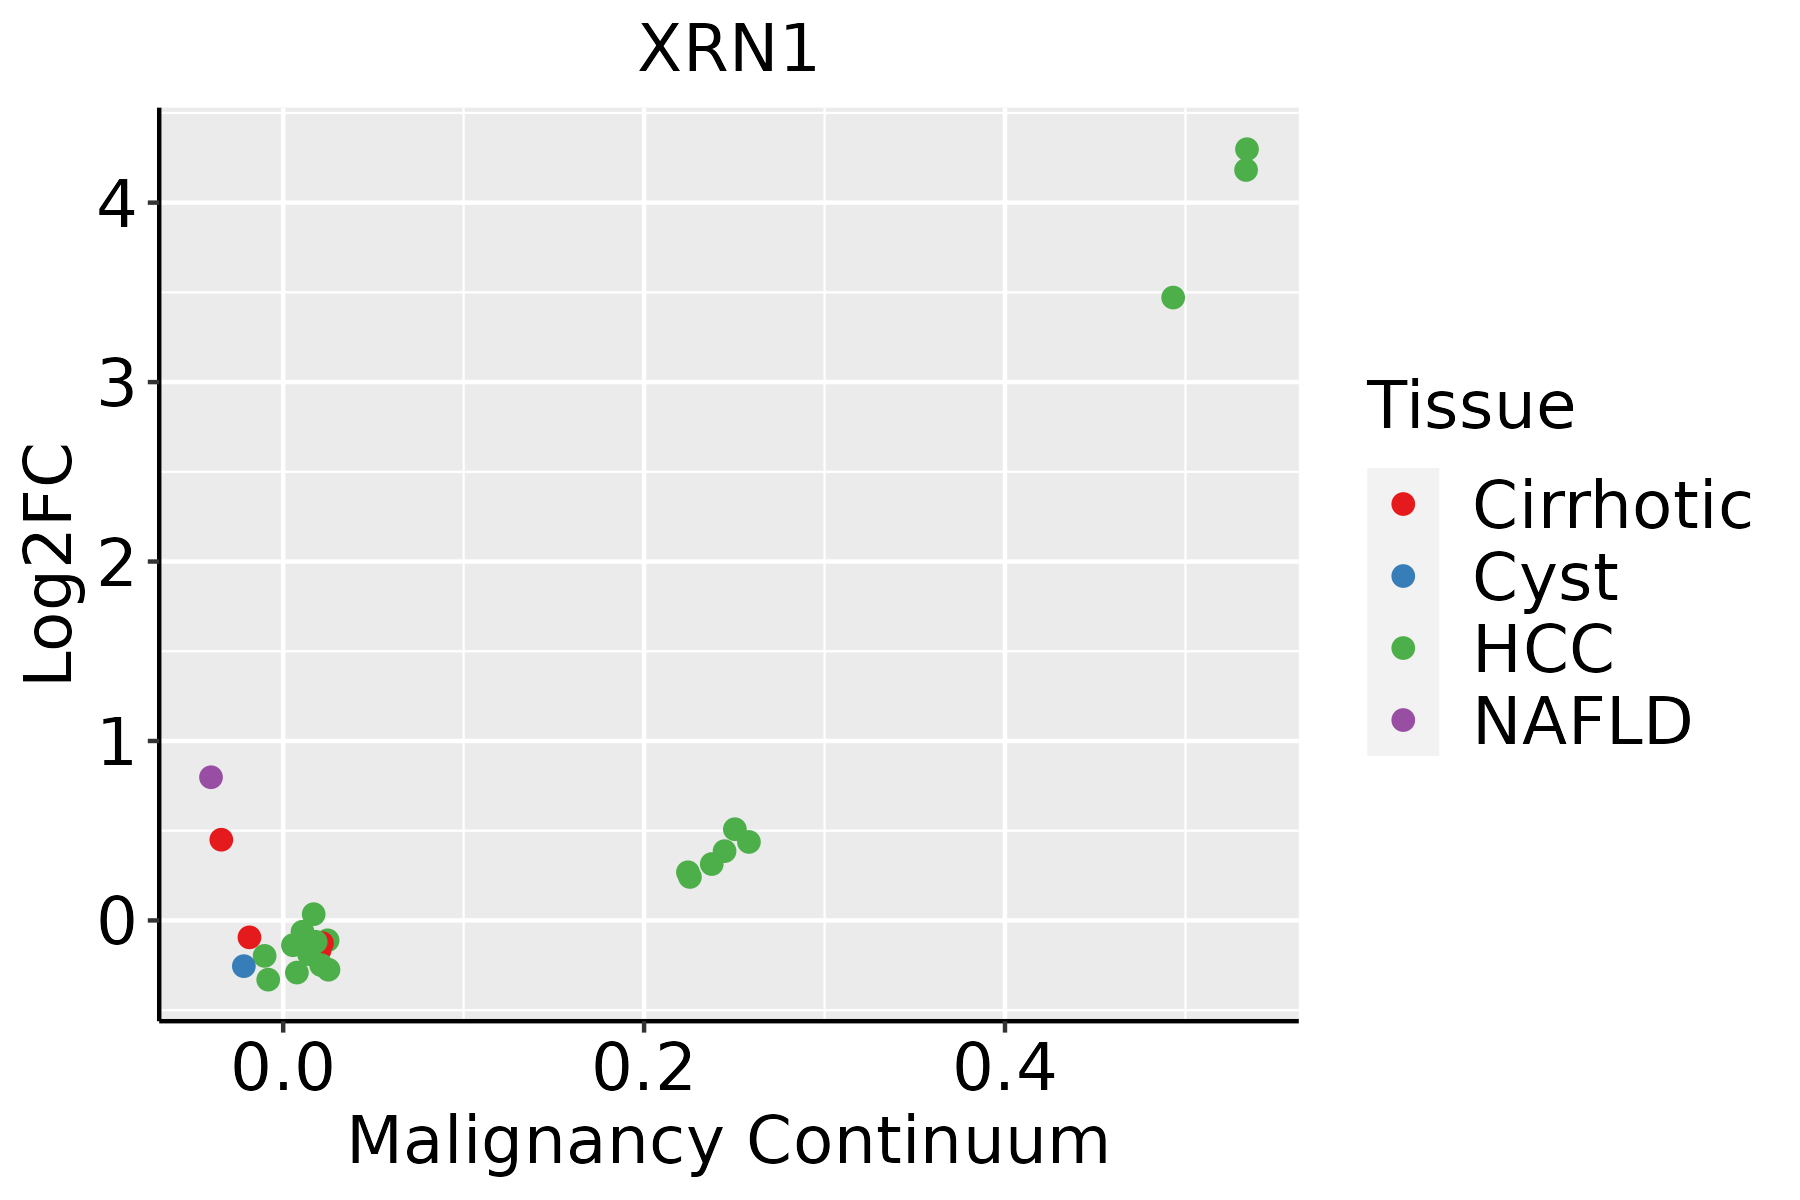 | HCC: Hepatocellular carcinoma |
| NAFLD: Non-alcoholic fatty liver disease | ||
| Lung | 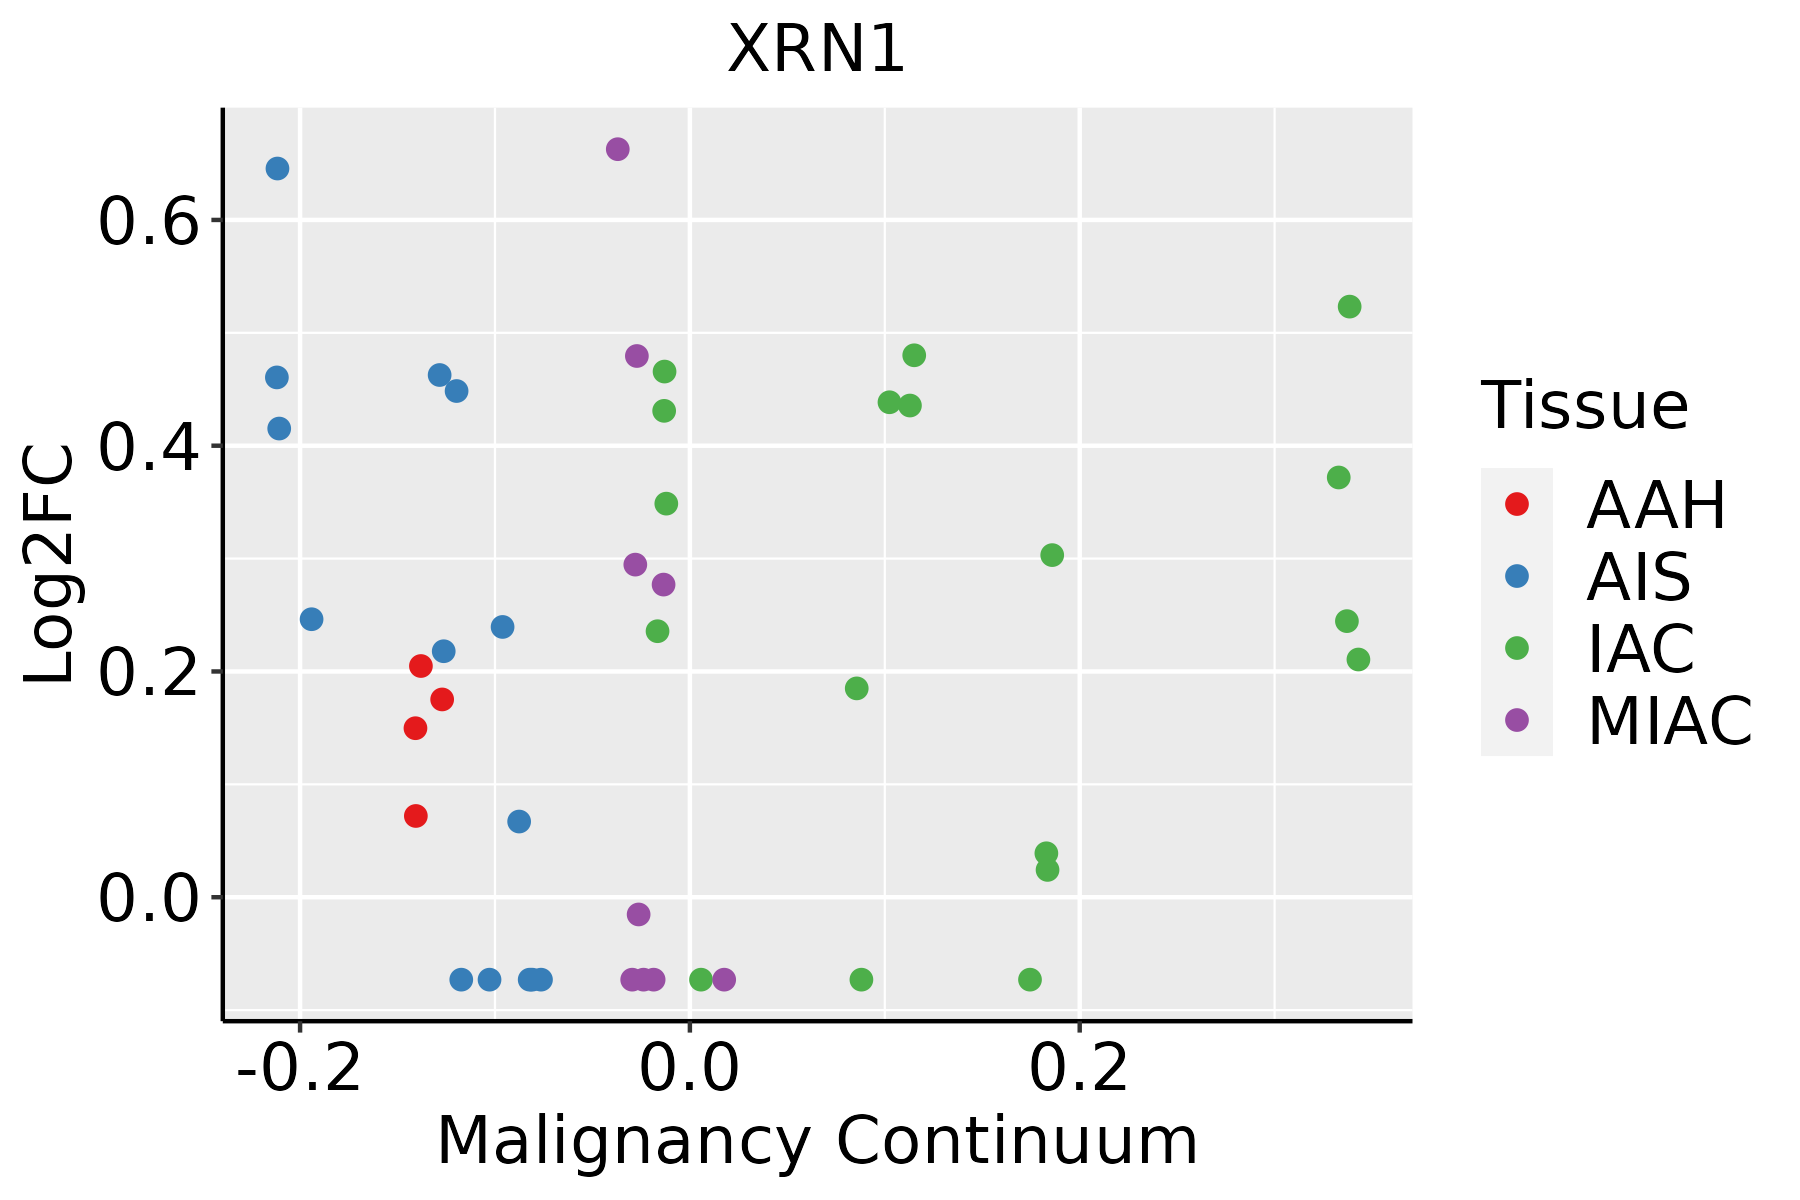 | AAH: Atypical adenomatous hyperplasia |
| AIS: Adenocarcinoma in situ | ||
| IAC: Invasive lung adenocarcinoma | ||
| MIA: Minimally invasive adenocarcinoma | ||
| Oral Cavity |  | EOLP: Erosive Oral lichen planus |
| LP: leukoplakia | ||
| NEOLP: Non-erosive oral lichen planus | ||
| OSCC: Oral squamous cell carcinoma | ||
| Prostate |  | BPH: Benign Prostatic Hyperplasia |
| Skin |  | AK: Actinic keratosis |
| cSCC: Cutaneous squamous cell carcinoma | ||
| SCCIS:squamous cell carcinoma in situ | ||
| Thyroid |  | ATC: Anaplastic thyroid cancer |
| HT: Hashimoto's thyroiditis | ||
| PTC: Papillary thyroid cancer |
| ∗log2FC in expression of this searched gene in stem-like cells from each diseased tissue sample relative to stem-like cells in normal samples in each tissue plotted against the malignancy continuum. Samples are colored based on if they are from different disease stage. |
Top |
Malignant transformation related pathway analysis |
| Find out the enriched GO biological processes and KEGG pathways involved in transition from healthy to precancer to cancer |
| Tissue | Disease Stage | Enriched GO biological Processes |
| Colorectum | AD |  |
| Colorectum | SER |  |
| Colorectum | MSS |  |
| Colorectum | MSI-H |  |
| Colorectum | FAP |  |
| ∗Top 15 enriched GO BP terms are showed in the bar plot of each disease state in each tissue. Each row represents a significant GO biological process which is colored according to the -log10(p.adjust). |
| Page: 1 2 3 4 5 6 7 8 9 |
| GO ID | Tissue | Disease Stage | Description | Gene Ratio | Bg Ratio | pvalue | p.adjust | Count |
| GO:00064029 | Cervix | CC | mRNA catabolic process | 56/2311 | 232/18723 | 4.81e-07 | 1.83e-05 | 56 |
| GO:00064019 | Cervix | CC | RNA catabolic process | 62/2311 | 278/18723 | 2.18e-06 | 6.56e-05 | 62 |
| GO:190165410 | Cervix | CC | response to ketone | 45/2311 | 194/18723 | 1.83e-05 | 3.44e-04 | 45 |
| GO:000641710 | Cervix | CC | regulation of translation | 89/2311 | 468/18723 | 1.86e-05 | 3.46e-04 | 89 |
| GO:00009567 | Cervix | CC | nuclear-transcribed mRNA catabolic process | 30/2311 | 112/18723 | 2.60e-05 | 4.37e-04 | 30 |
| GO:00106399 | Cervix | CC | negative regulation of organelle organization | 68/2311 | 348/18723 | 7.40e-05 | 1.03e-03 | 68 |
| GO:00467008 | Cervix | CC | heterocycle catabolic process | 80/2311 | 445/18723 | 3.23e-04 | 3.42e-03 | 80 |
| GO:00346559 | Cervix | CC | nucleobase-containing compound catabolic process | 74/2311 | 407/18723 | 3.77e-04 | 3.88e-03 | 74 |
| GO:00442709 | Cervix | CC | cellular nitrogen compound catabolic process | 79/2311 | 451/18723 | 7.80e-04 | 6.91e-03 | 79 |
| GO:00510528 | Cervix | CC | regulation of DNA metabolic process | 65/2311 | 359/18723 | 9.25e-04 | 7.84e-03 | 65 |
| GO:00194398 | Cervix | CC | aromatic compound catabolic process | 79/2311 | 467/18723 | 2.14e-03 | 1.54e-02 | 79 |
| GO:00973059 | Cervix | CC | response to alcohol | 46/2311 | 253/18723 | 4.40e-03 | 2.69e-02 | 46 |
| GO:20002789 | Cervix | CC | regulation of DNA biosynthetic process | 23/2311 | 106/18723 | 4.65e-03 | 2.81e-02 | 23 |
| GO:19013618 | Cervix | CC | organic cyclic compound catabolic process | 80/2311 | 495/18723 | 6.77e-03 | 3.72e-02 | 80 |
| GO:00160727 | Cervix | CC | rRNA metabolic process | 42/2311 | 236/18723 | 9.12e-03 | 4.60e-02 | 42 |
| GO:00007239 | Cervix | CC | telomere maintenance | 26/2311 | 131/18723 | 9.33e-03 | 4.66e-02 | 26 |
| GO:000641727 | Esophagus | HGIN | regulation of translation | 139/2587 | 468/18723 | 1.46e-19 | 7.98e-17 | 139 |
| GO:001607219 | Esophagus | HGIN | rRNA metabolic process | 72/2587 | 236/18723 | 2.26e-11 | 2.56e-09 | 72 |
| GO:000640120 | Esophagus | HGIN | RNA catabolic process | 77/2587 | 278/18723 | 7.63e-10 | 6.36e-08 | 77 |
| GO:000640220 | Esophagus | HGIN | mRNA catabolic process | 67/2587 | 232/18723 | 1.47e-09 | 1.13e-07 | 67 |
| Page: 1 2 3 4 5 6 7 8 9 10 11 12 13 14 15 16 17 18 19 20 21 22 23 24 25 26 |
| Pathway ID | Tissue | Disease Stage | Description | Gene Ratio | Bg Ratio | pvalue | p.adjust | qvalue | Count |
| hsa0301810 | Esophagus | HGIN | RNA degradation | 27/1383 | 79/8465 | 7.73e-05 | 9.00e-04 | 7.15e-04 | 27 |
| hsa0301815 | Esophagus | HGIN | RNA degradation | 27/1383 | 79/8465 | 7.73e-05 | 9.00e-04 | 7.15e-04 | 27 |
| hsa0301824 | Esophagus | ESCC | RNA degradation | 62/4205 | 79/8465 | 1.18e-07 | 9.39e-07 | 4.81e-07 | 62 |
| hsa0301834 | Esophagus | ESCC | RNA degradation | 62/4205 | 79/8465 | 1.18e-07 | 9.39e-07 | 4.81e-07 | 62 |
| hsa03018 | Liver | Cirrhotic | RNA degradation | 44/2530 | 79/8465 | 1.43e-06 | 1.65e-05 | 1.02e-05 | 44 |
| hsa030181 | Liver | Cirrhotic | RNA degradation | 44/2530 | 79/8465 | 1.43e-06 | 1.65e-05 | 1.02e-05 | 44 |
| hsa030182 | Liver | HCC | RNA degradation | 58/4020 | 79/8465 | 2.29e-06 | 2.19e-05 | 1.22e-05 | 58 |
| hsa030183 | Liver | HCC | RNA degradation | 58/4020 | 79/8465 | 2.29e-06 | 2.19e-05 | 1.22e-05 | 58 |
| hsa030189 | Oral cavity | OSCC | RNA degradation | 59/3704 | 79/8465 | 2.05e-08 | 1.91e-07 | 9.70e-08 | 59 |
| hsa0301814 | Oral cavity | OSCC | RNA degradation | 59/3704 | 79/8465 | 2.05e-08 | 1.91e-07 | 9.70e-08 | 59 |
| hsa0301841 | Oral cavity | EOLP | RNA degradation | 22/1218 | 79/8465 | 1.33e-03 | 4.80e-03 | 2.83e-03 | 22 |
| hsa0301851 | Oral cavity | EOLP | RNA degradation | 22/1218 | 79/8465 | 1.33e-03 | 4.80e-03 | 2.83e-03 | 22 |
| hsa0301861 | Oral cavity | NEOLP | RNA degradation | 18/1112 | 79/8465 | 1.25e-02 | 4.06e-02 | 2.56e-02 | 18 |
| hsa0301871 | Oral cavity | NEOLP | RNA degradation | 18/1112 | 79/8465 | 1.25e-02 | 4.06e-02 | 2.56e-02 | 18 |
| hsa030188 | Prostate | BPH | RNA degradation | 29/1718 | 79/8465 | 5.17e-04 | 2.67e-03 | 1.65e-03 | 29 |
| hsa0301813 | Prostate | BPH | RNA degradation | 29/1718 | 79/8465 | 5.17e-04 | 2.67e-03 | 1.65e-03 | 29 |
| hsa0301822 | Prostate | Tumor | RNA degradation | 30/1791 | 79/8465 | 4.48e-04 | 2.35e-03 | 1.46e-03 | 30 |
| hsa0301832 | Prostate | Tumor | RNA degradation | 30/1791 | 79/8465 | 4.48e-04 | 2.35e-03 | 1.46e-03 | 30 |
| Page: 1 |
Top |
Cell-cell communication analysis |
| Identification of potential cell-cell interactions between two cell types and their ligand-receptor pairs for different disease states |
| Ligand | Receptor | LRpair | Pathway | Tissue | Disease Stage |
| Page: 1 |
Top |
Single-cell gene regulatory network inference analysis |
| Find out the significant the regulons (TFs) and the target genes of each regulon across cell types for different disease states |
| TF | Cell Type | Tissue | Disease Stage | Target Gene | RSS | Regulon Activity |
| ∗The dot plots of a searched regulon are shown for all cell subpopulations in each disease state of each tissue based on the regulon specific score inferred using pySCENIC and by calculating the average expression. |
| Page: 1 |
Top |
Somatic mutation of malignant transformation related genes |
| Annotation of somatic variants for genes involved in malignant transformation |
| Hugo Symbol | Variant Class | Variant Classification | dbSNP RS | HGVSc | HGVSp | HGVSp Short | SWISSPROT | BIOTYPE | SIFT | PolyPhen | Tumor Sample Barcode | Tissue | Histology | Sex | Age | Stage | Therapy Types | Drugs | Outcome |
| XRN1 | SNV | Missense_Mutation | c.3854G>C | p.Arg1285Thr | p.R1285T | Q8IZH2 | protein_coding | tolerated_low_confidence(0.2) | benign(0.057) | TCGA-A2-A0YK-01 | Breast | breast invasive carcinoma | Female | <65 | I/II | Chemotherapy | cytoxan | SD | |
| XRN1 | SNV | Missense_Mutation | novel | c.2813G>C | p.Gly938Ala | p.G938A | Q8IZH2 | protein_coding | tolerated(0.16) | benign(0.053) | TCGA-A7-A4SE-01 | Breast | breast invasive carcinoma | Female | <65 | I/II | Chemotherapy | adriamycin | CR |
| XRN1 | SNV | Missense_Mutation | c.1069N>T | p.Asp357Tyr | p.D357Y | Q8IZH2 | protein_coding | deleterious(0) | probably_damaging(0.989) | TCGA-A8-A08L-01 | Breast | breast invasive carcinoma | Female | >=65 | III/IV | Unknown | Unknown | SD | |
| XRN1 | SNV | Missense_Mutation | c.3187N>C | p.Glu1063Gln | p.E1063Q | Q8IZH2 | protein_coding | tolerated(0.09) | possibly_damaging(0.65) | TCGA-AC-A23H-01 | Breast | breast invasive carcinoma | Female | >=65 | I/II | Unknown | Unknown | PD | |
| XRN1 | SNV | Missense_Mutation | rs746074142 | c.218N>A | p.Arg73His | p.R73H | Q8IZH2 | protein_coding | deleterious(0) | benign(0.189) | TCGA-AC-A8OQ-01 | Breast | breast invasive carcinoma | Female | >=65 | I/II | Unknown | Unknown | SD |
| XRN1 | SNV | Missense_Mutation | rs757311402 | c.2410N>T | p.Arg804Cys | p.R804C | Q8IZH2 | protein_coding | deleterious(0.04) | possibly_damaging(0.462) | TCGA-AN-A046-01 | Breast | breast invasive carcinoma | Female | >=65 | I/II | Unknown | Unknown | SD |
| XRN1 | SNV | Missense_Mutation | rs372819812 | c.2510N>A | p.Arg837Gln | p.R837Q | Q8IZH2 | protein_coding | tolerated(0.23) | benign(0) | TCGA-D8-A27M-01 | Breast | breast invasive carcinoma | Female | <65 | I/II | Chemotherapy | methotrexate+5 | SD |
| XRN1 | SNV | Missense_Mutation | c.1889A>G | p.Lys630Arg | p.K630R | Q8IZH2 | protein_coding | tolerated(0.28) | benign(0) | TCGA-E2-A1LH-01 | Breast | breast invasive carcinoma | Female | <65 | I/II | Chemotherapy | adriamycin | SD | |
| XRN1 | SNV | Missense_Mutation | rs372819812 | c.2510G>A | p.Arg837Gln | p.R837Q | Q8IZH2 | protein_coding | tolerated(0.23) | benign(0) | TCGA-GM-A2D9-01 | Breast | breast invasive carcinoma | Female | >=65 | I/II | Hormone Therapy | arimidex | SD |
| XRN1 | SNV | Missense_Mutation | c.1765G>C | p.Glu589Gln | p.E589Q | Q8IZH2 | protein_coding | deleterious(0) | possibly_damaging(0.872) | TCGA-GM-A2D9-01 | Breast | breast invasive carcinoma | Female | >=65 | I/II | Hormone Therapy | arimidex | SD |
| Page: 1 2 3 4 5 6 7 8 9 10 11 12 13 14 15 16 17 18 19 |
Top |
Related drugs of malignant transformation related genes |
| Identification of chemicals and drugs interact with genes involved in malignant transfromation |
| (DGIdb 4.0) |
| Entrez ID | Symbol | Category | Interaction Types | Drug Claim Name | Drug Name | PMIDs |
| Page: 1 |

Copyright 2023-Present -The University of Texas Health Science Center at Houston |