
|
|||||
|
 | |
| |
| |
| |
| |
| |
|
Gene: XRCC1 |
Gene summary for XRCC1 |
| Gene information | Species | Human | Gene symbol | XRCC1 | Gene ID | 7515 |
| Gene name | X-ray repair cross complementing 1 | |
| Gene Alias | RCC | |
| Cytomap | 19q13.31 | |
| Gene Type | protein-coding | GO ID | GO:0000012 | UniProtAcc | B2RCY5 |
Top |
Malignant transformation analysis |
| Identification of the aberrant gene expression in precancerous and cancerous lesions by comparing the gene expression of stem-like cells in diseased tissues with normal stem cells |
| Entrez ID | Symbol | Replicates | Species | Organ | Tissue | Adj P-value | Log2FC | Malignancy |
| 7515 | XRCC1 | LZE7T | Human | Esophagus | ESCC | 2.37e-02 | 2.47e-01 | 0.0667 |
| 7515 | XRCC1 | LZE24T | Human | Esophagus | ESCC | 6.05e-12 | 3.63e-01 | 0.0596 |
| 7515 | XRCC1 | P1T-E | Human | Esophagus | ESCC | 4.16e-02 | 2.26e-01 | 0.0875 |
| 7515 | XRCC1 | P2T-E | Human | Esophagus | ESCC | 8.16e-27 | 5.52e-01 | 0.1177 |
| 7515 | XRCC1 | P4T-E | Human | Esophagus | ESCC | 7.54e-07 | 2.10e-01 | 0.1323 |
| 7515 | XRCC1 | P5T-E | Human | Esophagus | ESCC | 3.55e-13 | 2.18e-01 | 0.1327 |
| 7515 | XRCC1 | P8T-E | Human | Esophagus | ESCC | 1.80e-14 | 3.32e-01 | 0.0889 |
| 7515 | XRCC1 | P9T-E | Human | Esophagus | ESCC | 3.78e-07 | 1.53e-01 | 0.1131 |
| 7515 | XRCC1 | P10T-E | Human | Esophagus | ESCC | 2.04e-30 | 5.24e-01 | 0.116 |
| 7515 | XRCC1 | P11T-E | Human | Esophagus | ESCC | 1.91e-03 | 2.48e-01 | 0.1426 |
| 7515 | XRCC1 | P12T-E | Human | Esophagus | ESCC | 1.41e-23 | 4.59e-01 | 0.1122 |
| 7515 | XRCC1 | P15T-E | Human | Esophagus | ESCC | 6.30e-16 | 4.07e-01 | 0.1149 |
| 7515 | XRCC1 | P16T-E | Human | Esophagus | ESCC | 6.08e-16 | 1.86e-01 | 0.1153 |
| 7515 | XRCC1 | P17T-E | Human | Esophagus | ESCC | 4.59e-10 | 3.69e-01 | 0.1278 |
| 7515 | XRCC1 | P19T-E | Human | Esophagus | ESCC | 3.98e-13 | 6.10e-01 | 0.1662 |
| 7515 | XRCC1 | P20T-E | Human | Esophagus | ESCC | 1.42e-18 | 3.81e-01 | 0.1124 |
| 7515 | XRCC1 | P21T-E | Human | Esophagus | ESCC | 1.93e-05 | 1.15e-01 | 0.1617 |
| 7515 | XRCC1 | P22T-E | Human | Esophagus | ESCC | 1.27e-20 | 3.40e-01 | 0.1236 |
| 7515 | XRCC1 | P23T-E | Human | Esophagus | ESCC | 6.37e-18 | 5.22e-01 | 0.108 |
| 7515 | XRCC1 | P24T-E | Human | Esophagus | ESCC | 2.65e-14 | 1.95e-01 | 0.1287 |
| Page: 1 2 3 4 5 |
| Tissue | Expression Dynamics | Abbreviation |
| Esophagus | 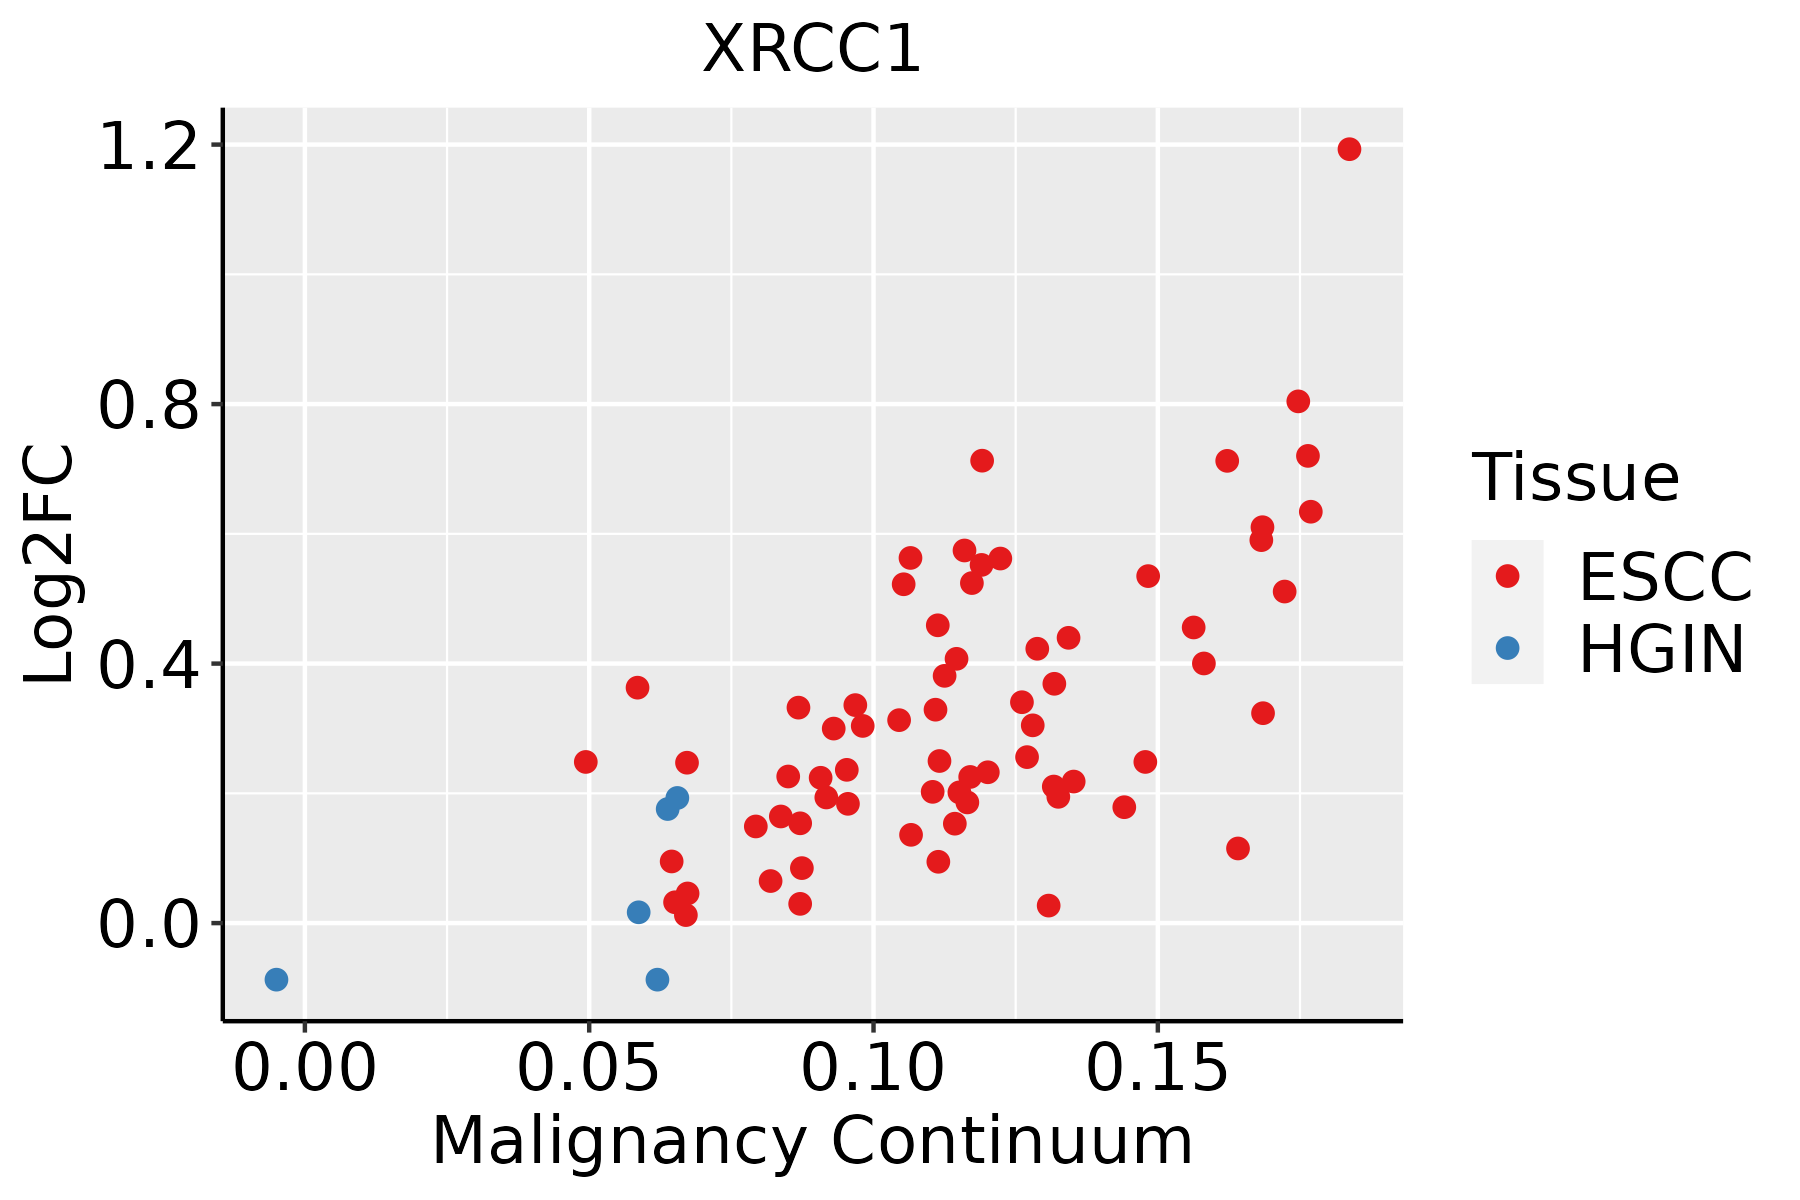 | ESCC: Esophageal squamous cell carcinoma |
| HGIN: High-grade intraepithelial neoplasias | ||
| LGIN: Low-grade intraepithelial neoplasias | ||
| Oral Cavity | 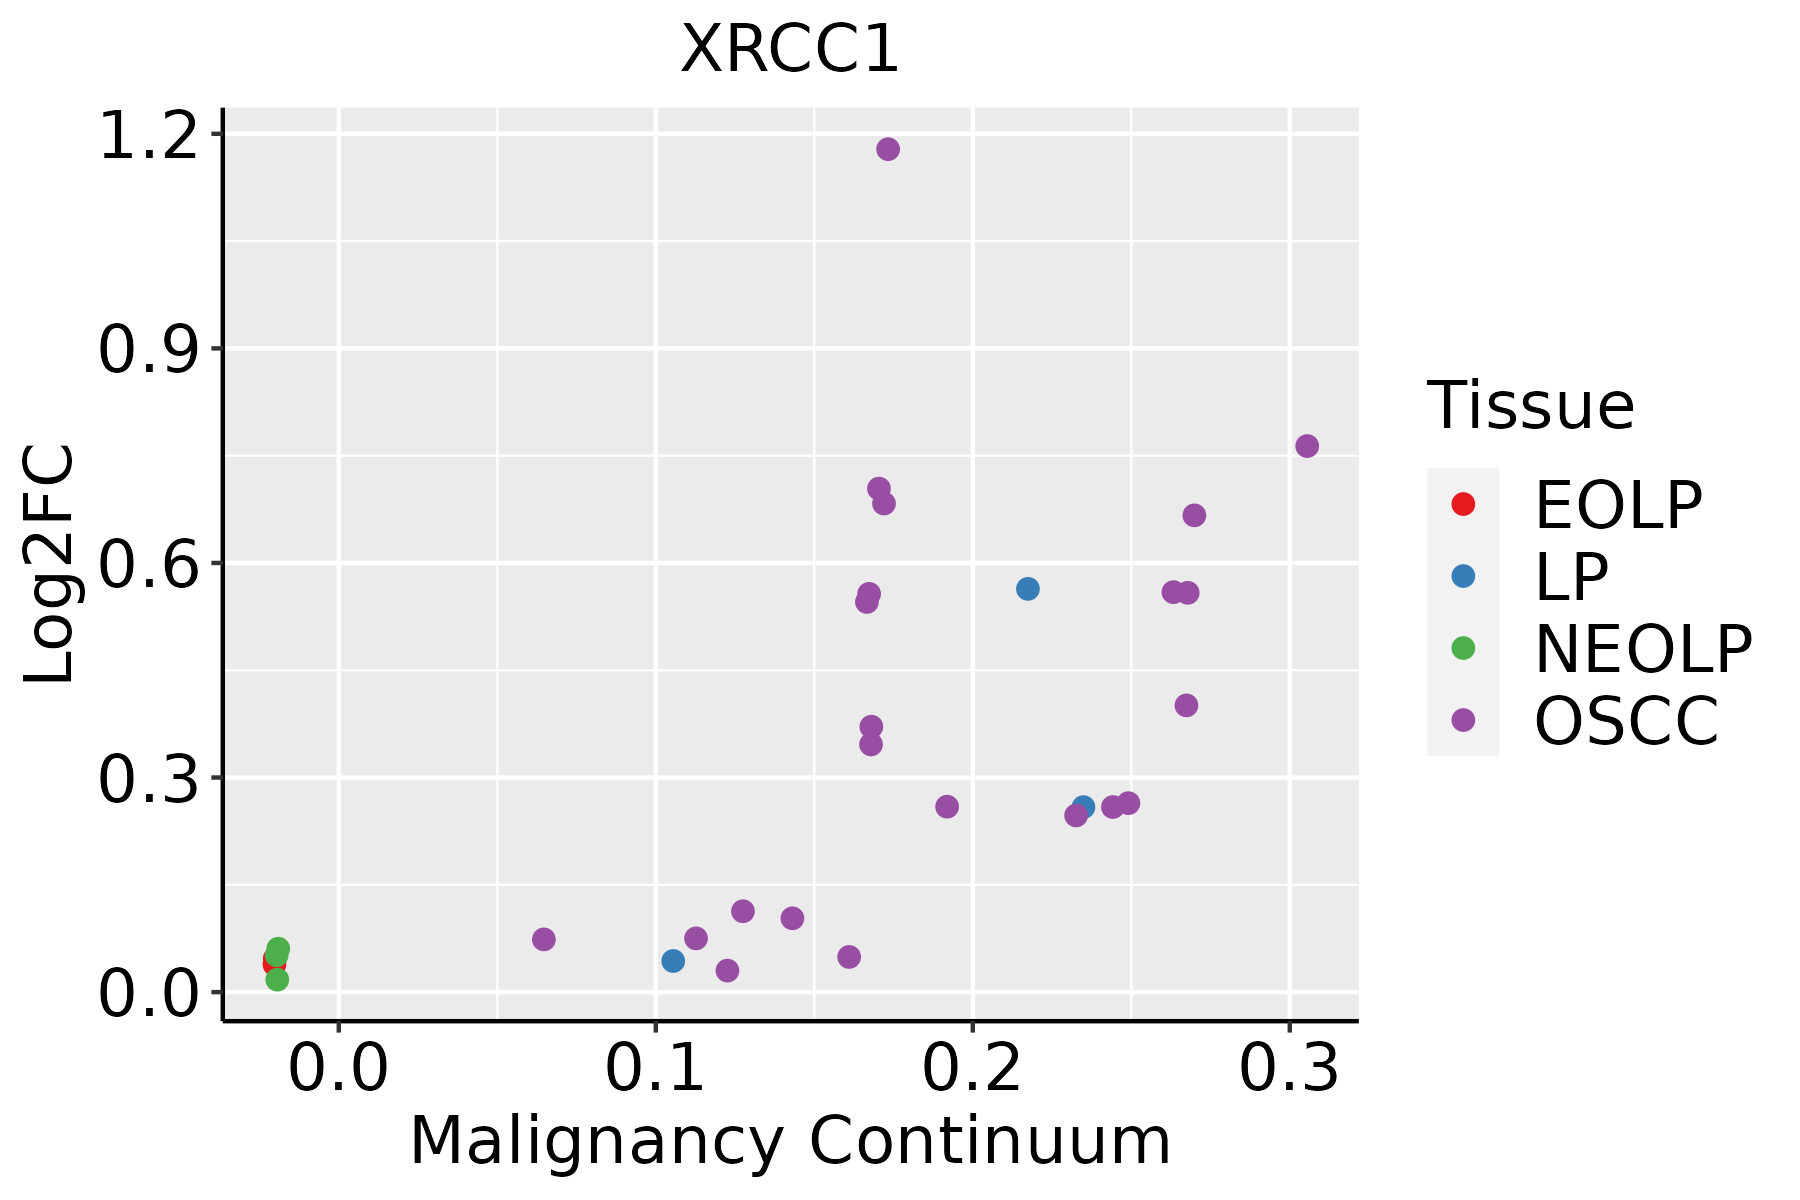 | EOLP: Erosive Oral lichen planus |
| LP: leukoplakia | ||
| NEOLP: Non-erosive oral lichen planus | ||
| OSCC: Oral squamous cell carcinoma | ||
| Thyroid | 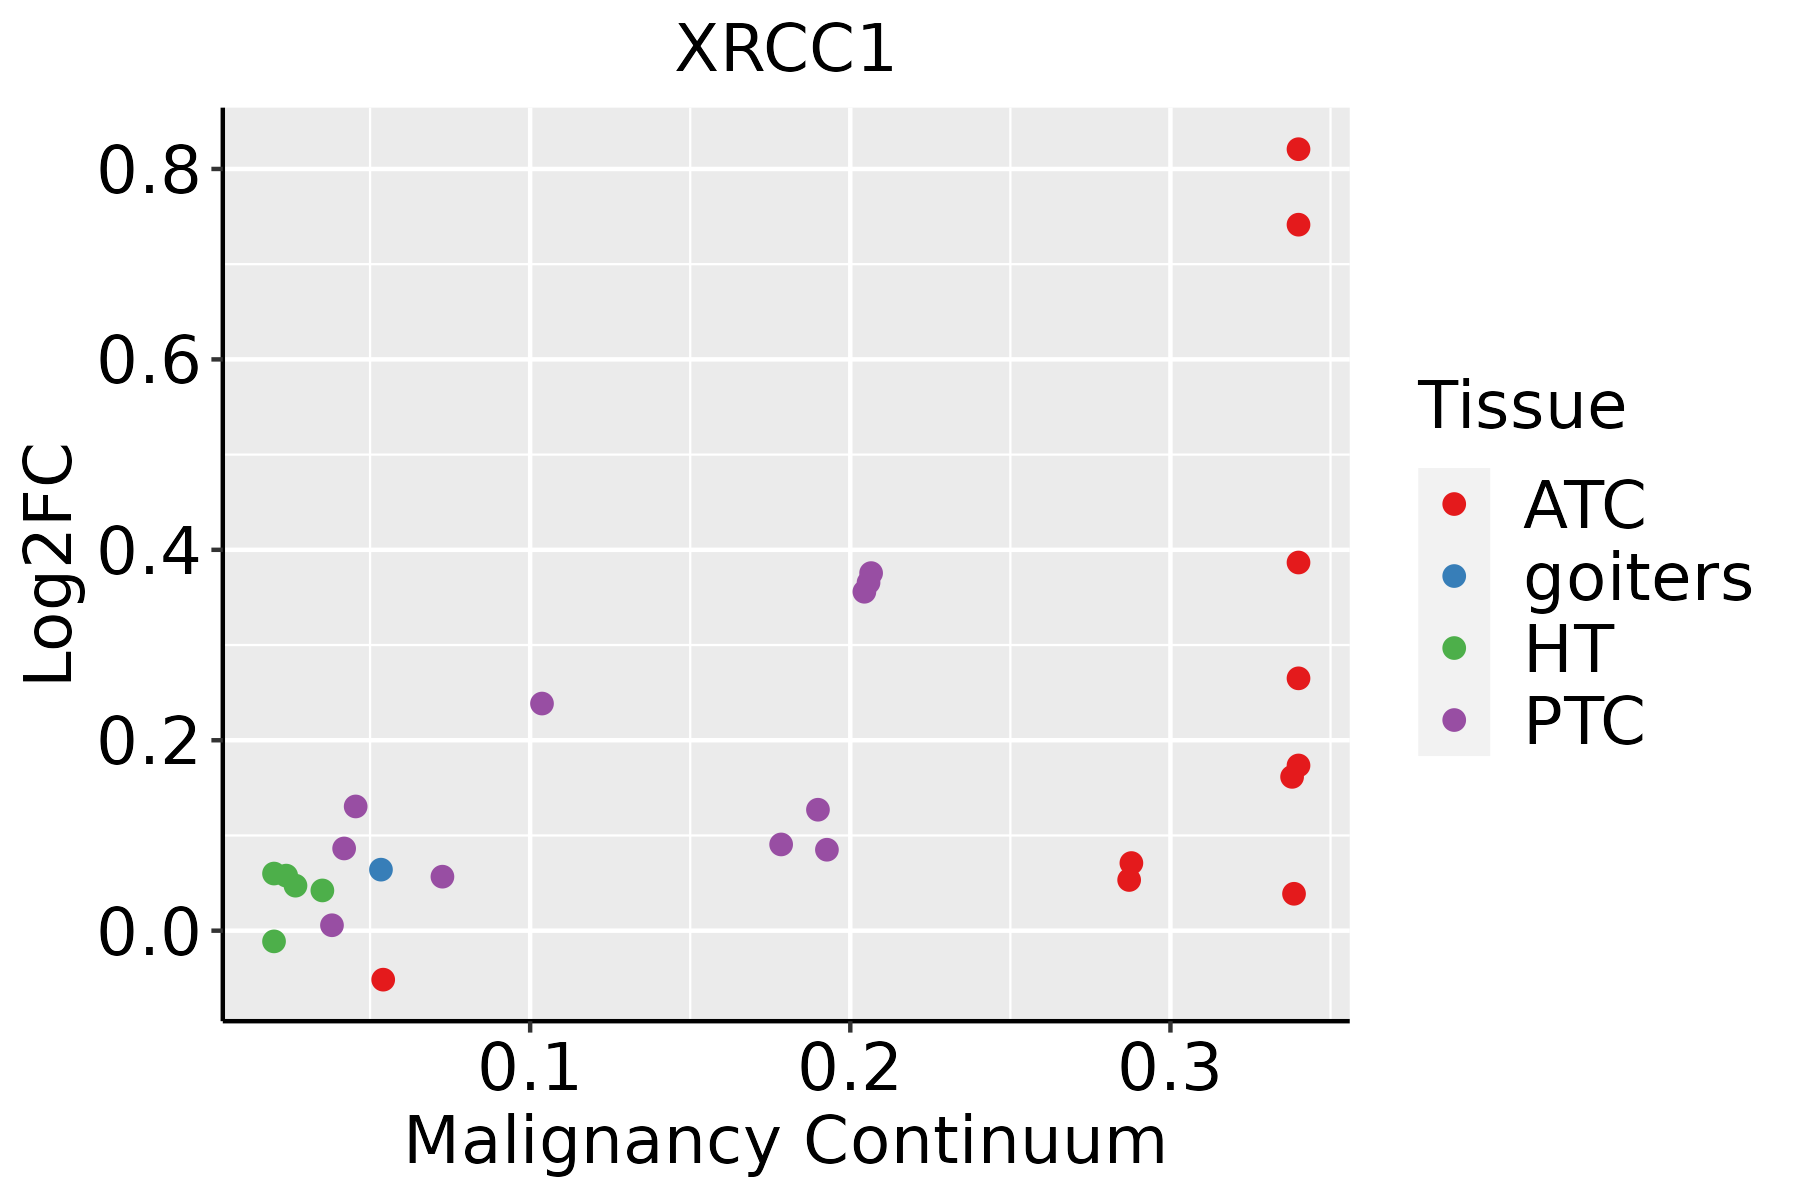 | ATC: Anaplastic thyroid cancer |
| HT: Hashimoto's thyroiditis | ||
| PTC: Papillary thyroid cancer |
| ∗log2FC in expression of this searched gene in stem-like cells from each diseased tissue sample relative to stem-like cells in normal samples in each tissue plotted against the malignancy continuum. Samples are colored based on if they are from different disease stage. |
Top |
Malignant transformation related pathway analysis |
| Find out the enriched GO biological processes and KEGG pathways involved in transition from healthy to precancer to cancer |
| Tissue | Disease Stage | Enriched GO biological Processes |
| Colorectum | AD |  |
| Colorectum | SER |  |
| Colorectum | MSS |  |
| Colorectum | MSI-H |  |
| Colorectum | FAP |  |
| ∗Top 15 enriched GO BP terms are showed in the bar plot of each disease state in each tissue. Each row represents a significant GO biological process which is colored according to the -log10(p.adjust). |
| Page: 1 2 3 4 5 6 7 8 9 |
| GO ID | Tissue | Disease Stage | Description | Gene Ratio | Bg Ratio | pvalue | p.adjust | Count |
| GO:0006979111 | Esophagus | ESCC | response to oxidative stress | 303/8552 | 446/18723 | 7.15e-22 | 1.30e-19 | 303 |
| GO:003304416 | Esophagus | ESCC | regulation of chromosome organization | 145/8552 | 187/18723 | 3.80e-19 | 4.31e-17 | 145 |
| GO:005105215 | Esophagus | ESCC | regulation of DNA metabolic process | 232/8552 | 359/18723 | 2.40e-13 | 1.13e-11 | 232 |
| GO:000072319 | Esophagus | ESCC | telomere maintenance | 99/8552 | 131/18723 | 2.68e-12 | 1.08e-10 | 99 |
| GO:005105417 | Esophagus | ESCC | positive regulation of DNA metabolic process | 139/8552 | 201/18723 | 1.20e-11 | 4.33e-10 | 139 |
| GO:003220417 | Esophagus | ESCC | regulation of telomere maintenance | 65/8552 | 80/18723 | 6.02e-11 | 1.90e-09 | 65 |
| GO:0070482111 | Esophagus | ESCC | response to oxygen levels | 218/8552 | 347/18723 | 6.91e-11 | 2.17e-09 | 218 |
| GO:2001020110 | Esophagus | ESCC | regulation of response to DNA damage stimulus | 145/8552 | 219/18723 | 5.97e-10 | 1.50e-08 | 145 |
| GO:0010639110 | Esophagus | ESCC | negative regulation of organelle organization | 215/8552 | 348/18723 | 8.20e-10 | 2.01e-08 | 215 |
| GO:0036293111 | Esophagus | ESCC | response to decreased oxygen levels | 201/8552 | 322/18723 | 8.37e-10 | 2.04e-08 | 201 |
| GO:0001666111 | Esophagus | ESCC | response to hypoxia | 192/8552 | 307/18723 | 1.59e-09 | 3.69e-08 | 192 |
| GO:00063024 | Esophagus | ESCC | double-strand break repair | 152/8552 | 251/18723 | 1.33e-06 | 1.62e-05 | 152 |
| GO:20012513 | Esophagus | ESCC | negative regulation of chromosome organization | 60/8552 | 86/18723 | 5.20e-06 | 5.45e-05 | 60 |
| GO:003220014 | Esophagus | ESCC | telomere organization | 99/8552 | 159/18723 | 1.77e-05 | 1.57e-04 | 99 |
| GO:20010228 | Esophagus | ESCC | positive regulation of response to DNA damage stimulus | 69/8552 | 105/18723 | 2.66e-05 | 2.22e-04 | 69 |
| GO:00062843 | Esophagus | ESCC | base-excision repair | 33/8552 | 43/18723 | 3.25e-05 | 2.69e-04 | 33 |
| GO:000941020 | Esophagus | ESCC | response to xenobiotic stimulus | 253/8552 | 462/18723 | 4.55e-05 | 3.58e-04 | 253 |
| GO:00062826 | Esophagus | ESCC | regulation of DNA repair | 82/8552 | 130/18723 | 4.65e-05 | 3.66e-04 | 82 |
| GO:19043532 | Esophagus | ESCC | regulation of telomere capping | 22/8552 | 26/18723 | 4.88e-05 | 3.83e-04 | 22 |
| GO:200102112 | Esophagus | ESCC | negative regulation of response to DNA damage stimulus | 54/8552 | 81/18723 | 1.09e-04 | 7.64e-04 | 54 |
| Page: 1 2 3 4 5 6 7 |
| Pathway ID | Tissue | Disease Stage | Description | Gene Ratio | Bg Ratio | pvalue | p.adjust | qvalue | Count |
| hsa034104 | Esophagus | ESCC | Base excision repair | 38/4205 | 44/8465 | 3.59e-07 | 2.62e-06 | 1.34e-06 | 38 |
| hsa0341011 | Esophagus | ESCC | Base excision repair | 38/4205 | 44/8465 | 3.59e-07 | 2.62e-06 | 1.34e-06 | 38 |
| hsa03410 | Oral cavity | OSCC | Base excision repair | 32/3704 | 44/8465 | 9.11e-05 | 3.25e-04 | 1.65e-04 | 32 |
| hsa034101 | Oral cavity | OSCC | Base excision repair | 32/3704 | 44/8465 | 9.11e-05 | 3.25e-04 | 1.65e-04 | 32 |
| hsa034102 | Oral cavity | LP | Base excision repair | 23/2418 | 44/8465 | 7.66e-04 | 3.75e-03 | 2.42e-03 | 23 |
| hsa034103 | Oral cavity | LP | Base excision repair | 23/2418 | 44/8465 | 7.66e-04 | 3.75e-03 | 2.42e-03 | 23 |
| Page: 1 |
Top |
Cell-cell communication analysis |
| Identification of potential cell-cell interactions between two cell types and their ligand-receptor pairs for different disease states |
| Ligand | Receptor | LRpair | Pathway | Tissue | Disease Stage |
| Page: 1 |
Top |
Single-cell gene regulatory network inference analysis |
| Find out the significant the regulons (TFs) and the target genes of each regulon across cell types for different disease states |
| TF | Cell Type | Tissue | Disease Stage | Target Gene | RSS | Regulon Activity |
| ∗The dot plots of a searched regulon are shown for all cell subpopulations in each disease state of each tissue based on the regulon specific score inferred using pySCENIC and by calculating the average expression. |
| Page: 1 |
Top |
Somatic mutation of malignant transformation related genes |
| Annotation of somatic variants for genes involved in malignant transformation |
| Hugo Symbol | Variant Class | Variant Classification | dbSNP RS | HGVSc | HGVSp | HGVSp Short | SWISSPROT | BIOTYPE | SIFT | PolyPhen | Tumor Sample Barcode | Tissue | Histology | Sex | Age | Stage | Therapy Types | Drugs | Outcome |
| XRCC1 | SNV | Missense_Mutation | c.70N>T | p.Leu24Phe | p.L24F | P18887 | protein_coding | deleterious(0) | probably_damaging(0.998) | TCGA-A2-A0SW-01 | Breast | breast invasive carcinoma | Female | >=65 | III/IV | Hormone Therapy | arimidex | PD | |
| XRCC1 | SNV | Missense_Mutation | c.1870N>T | p.His624Tyr | p.H624Y | P18887 | protein_coding | tolerated(0.69) | benign(0.02) | TCGA-AC-A23H-01 | Breast | breast invasive carcinoma | Female | >=65 | I/II | Unknown | Unknown | PD | |
| XRCC1 | SNV | Missense_Mutation | novel | c.736N>G | p.Arg246Gly | p.R246G | P18887 | protein_coding | deleterious(0) | probably_damaging(0.991) | TCGA-B6-A400-01 | Breast | breast invasive carcinoma | Female | <65 | III/IV | Unknown | Unknown | SD |
| XRCC1 | SNV | Missense_Mutation | c.1190N>T | p.Pro397Leu | p.P397L | P18887 | protein_coding | deleterious(0) | benign(0.361) | TCGA-BH-A208-01 | Breast | breast invasive carcinoma | Female | <65 | I/II | Unknown | Unknown | SD | |
| XRCC1 | SNV | Missense_Mutation | rs746331654 | c.1180C>T | p.Arg394Trp | p.R394W | P18887 | protein_coding | deleterious(0.01) | probably_damaging(0.938) | TCGA-C8-A275-01 | Breast | breast invasive carcinoma | Female | <65 | I/II | Unknown | Unknown | SD |
| XRCC1 | SNV | Missense_Mutation | rs148471252 | c.235N>A | p.Ala79Thr | p.A79T | P18887 | protein_coding | tolerated(0.67) | benign(0) | TCGA-D8-A1XK-01 | Breast | breast invasive carcinoma | Female | <65 | I/II | Chemotherapy | doxorubicine+cyclophosphamide | SD |
| XRCC1 | SNV | Missense_Mutation | novel | c.1070N>A | p.Ser357Asn | p.S357N | P18887 | protein_coding | deleterious(0.01) | probably_damaging(0.941) | TCGA-2W-A8YY-01 | Cervix | cervical & endocervical cancer | Female | <65 | I/II | Chemotherapy | cisplatin | CR |
| XRCC1 | SNV | Missense_Mutation | c.808N>T | p.Pro270Ser | p.P270S | P18887 | protein_coding | tolerated(0.89) | benign(0) | TCGA-IR-A3LA-01 | Cervix | cervical & endocervical cancer | Female | <65 | I/II | Chemotherapy | cisplatin | CR | |
| XRCC1 | SNV | Missense_Mutation | c.1783G>C | p.Glu595Gln | p.E595Q | P18887 | protein_coding | deleterious(0.01) | possibly_damaging(0.906) | TCGA-Q1-A73O-01 | Cervix | cervical & endocervical cancer | Female | <65 | I/II | Chemotherapy | cisplatin | CR | |
| XRCC1 | SNV | Missense_Mutation | rs370972033 | c.253G>A | p.Glu85Lys | p.E85K | P18887 | protein_coding | tolerated(0.12) | benign(0.043) | TCGA-UC-A7PI-01 | Cervix | cervical & endocervical cancer | Female | <65 | I/II | Unknown | Unknown | PD |
| Page: 1 2 3 4 5 6 |
Top |
Related drugs of malignant transformation related genes |
| Identification of chemicals and drugs interact with genes involved in malignant transfromation |
| (DGIdb 4.0) |
| Entrez ID | Symbol | Category | Interaction Types | Drug Claim Name | Drug Name | PMIDs |
| 7515 | XRCC1 | CLINICALLY ACTIONABLE | CARBOPLATIN | CARBOPLATIN | 16875718 | |
| 7515 | XRCC1 | CLINICALLY ACTIONABLE | ALPHA-TOCOPHEROL | VITAMIN E | 12618330 | |
| 7515 | XRCC1 | CLINICALLY ACTIONABLE | PLATINUM | PLATINUM | 17925548 | |
| 7515 | XRCC1 | CLINICALLY ACTIONABLE | CISPLATIN | CISPLATIN | 16875718 | |
| 7515 | XRCC1 | CLINICALLY ACTIONABLE | fluorouracil | FLUOROURACIL | 23314736 | |
| 7515 | XRCC1 | CLINICALLY ACTIONABLE | DOCETAXEL | DOCETAXEL | 19157633 | |
| 7515 | XRCC1 | CLINICALLY ACTIONABLE | GEMCITABINE | GEMCITABINE | 19157633 | |
| 7515 | XRCC1 | CLINICALLY ACTIONABLE | MUSTARD | 8765433 | ||
| 7515 | XRCC1 | CLINICALLY ACTIONABLE | Platinum compounds | 19786980,22188361,27636246,21057378,29662106,24446315,22821704,19362955,16875718,24224851,22026922 | ||
| 7515 | XRCC1 | CLINICALLY ACTIONABLE | doxorubicin | DOXORUBICIN |
| Page: 1 2 |

Copyright 2023-Present -The University of Texas Health Science Center at Houston |