
|
|||||
|
 | |
| |
| |
| |
| |
| |
|
Gene: XPOT |
Gene summary for XPOT |
| Gene information | Species | Human | Gene symbol | XPOT | Gene ID | 11260 |
| Gene name | exportin for tRNA | |
| Gene Alias | XPO3 | |
| Cytomap | 12q14.2 | |
| Gene Type | protein-coding | GO ID | GO:0006403 | UniProtAcc | O43592 |
Top |
Malignant transformation analysis |
| Identification of the aberrant gene expression in precancerous and cancerous lesions by comparing the gene expression of stem-like cells in diseased tissues with normal stem cells |
| Entrez ID | Symbol | Replicates | Species | Organ | Tissue | Adj P-value | Log2FC | Malignancy |
| 11260 | XPOT | LZE4T | Human | Esophagus | ESCC | 1.45e-09 | 1.95e-01 | 0.0811 |
| 11260 | XPOT | LZE7T | Human | Esophagus | ESCC | 1.41e-08 | 4.51e-01 | 0.0667 |
| 11260 | XPOT | LZE8T | Human | Esophagus | ESCC | 1.81e-02 | 1.16e-01 | 0.067 |
| 11260 | XPOT | LZE22T | Human | Esophagus | ESCC | 4.15e-02 | 1.38e-01 | 0.068 |
| 11260 | XPOT | LZE24T | Human | Esophagus | ESCC | 9.83e-12 | 4.44e-01 | 0.0596 |
| 11260 | XPOT | LZE21T | Human | Esophagus | ESCC | 2.43e-04 | 4.24e-01 | 0.0655 |
| 11260 | XPOT | P1T-E | Human | Esophagus | ESCC | 3.56e-12 | 4.86e-01 | 0.0875 |
| 11260 | XPOT | P2T-E | Human | Esophagus | ESCC | 1.11e-49 | 9.53e-01 | 0.1177 |
| 11260 | XPOT | P4T-E | Human | Esophagus | ESCC | 3.37e-24 | 5.59e-01 | 0.1323 |
| 11260 | XPOT | P5T-E | Human | Esophagus | ESCC | 1.33e-10 | 2.77e-01 | 0.1327 |
| 11260 | XPOT | P8T-E | Human | Esophagus | ESCC | 9.70e-22 | 2.09e-01 | 0.0889 |
| 11260 | XPOT | P9T-E | Human | Esophagus | ESCC | 1.60e-06 | 9.76e-02 | 0.1131 |
| 11260 | XPOT | P10T-E | Human | Esophagus | ESCC | 3.07e-20 | 4.86e-01 | 0.116 |
| 11260 | XPOT | P11T-E | Human | Esophagus | ESCC | 2.00e-08 | 2.23e-01 | 0.1426 |
| 11260 | XPOT | P12T-E | Human | Esophagus | ESCC | 6.41e-20 | 5.00e-01 | 0.1122 |
| 11260 | XPOT | P15T-E | Human | Esophagus | ESCC | 9.80e-33 | 6.68e-01 | 0.1149 |
| 11260 | XPOT | P16T-E | Human | Esophagus | ESCC | 7.83e-23 | 4.45e-01 | 0.1153 |
| 11260 | XPOT | P17T-E | Human | Esophagus | ESCC | 2.79e-07 | 4.50e-01 | 0.1278 |
| 11260 | XPOT | P19T-E | Human | Esophagus | ESCC | 5.41e-09 | 1.05e+00 | 0.1662 |
| 11260 | XPOT | P20T-E | Human | Esophagus | ESCC | 6.30e-30 | 3.73e-01 | 0.1124 |
| Page: 1 2 3 4 5 6 |
| Tissue | Expression Dynamics | Abbreviation |
| Esophagus | 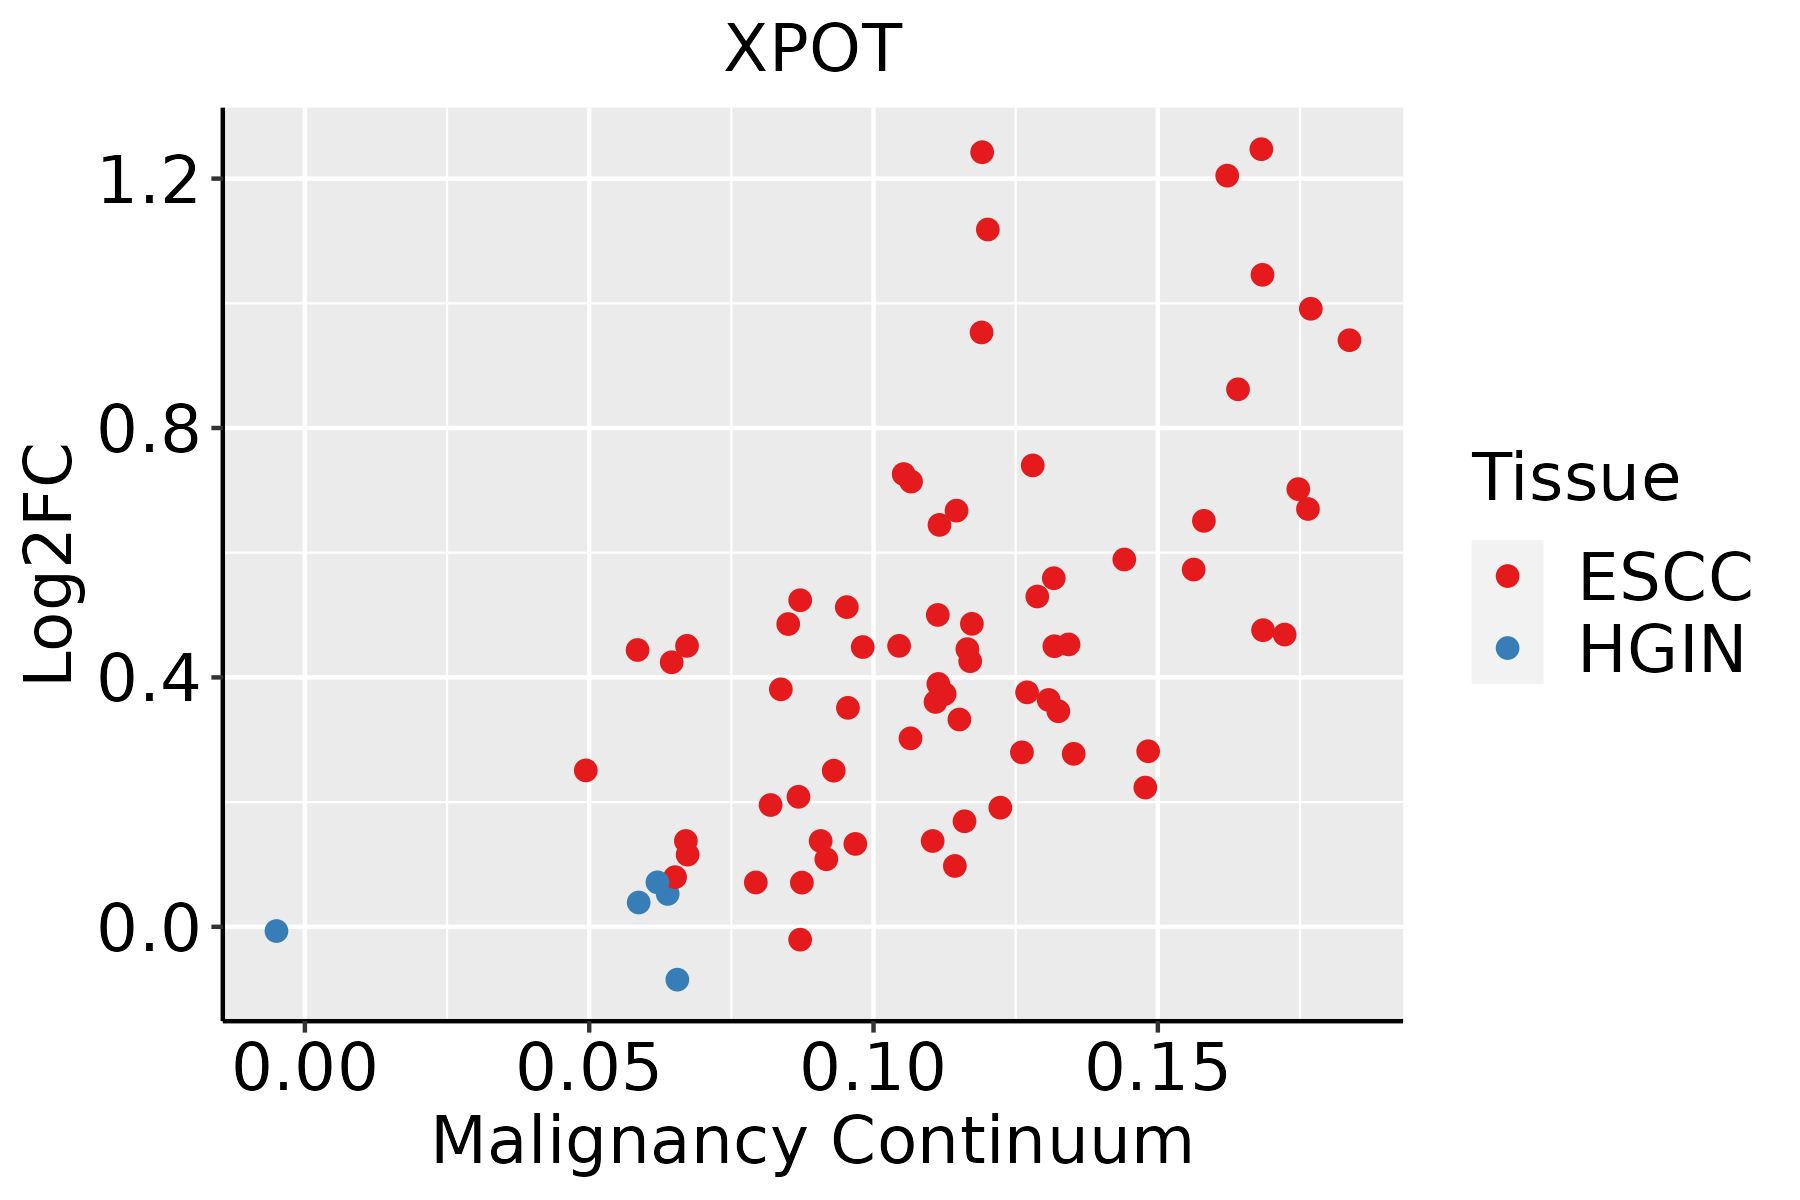 | ESCC: Esophageal squamous cell carcinoma |
| HGIN: High-grade intraepithelial neoplasias | ||
| LGIN: Low-grade intraepithelial neoplasias | ||
| Liver |  | HCC: Hepatocellular carcinoma |
| NAFLD: Non-alcoholic fatty liver disease | ||
| Oral Cavity | 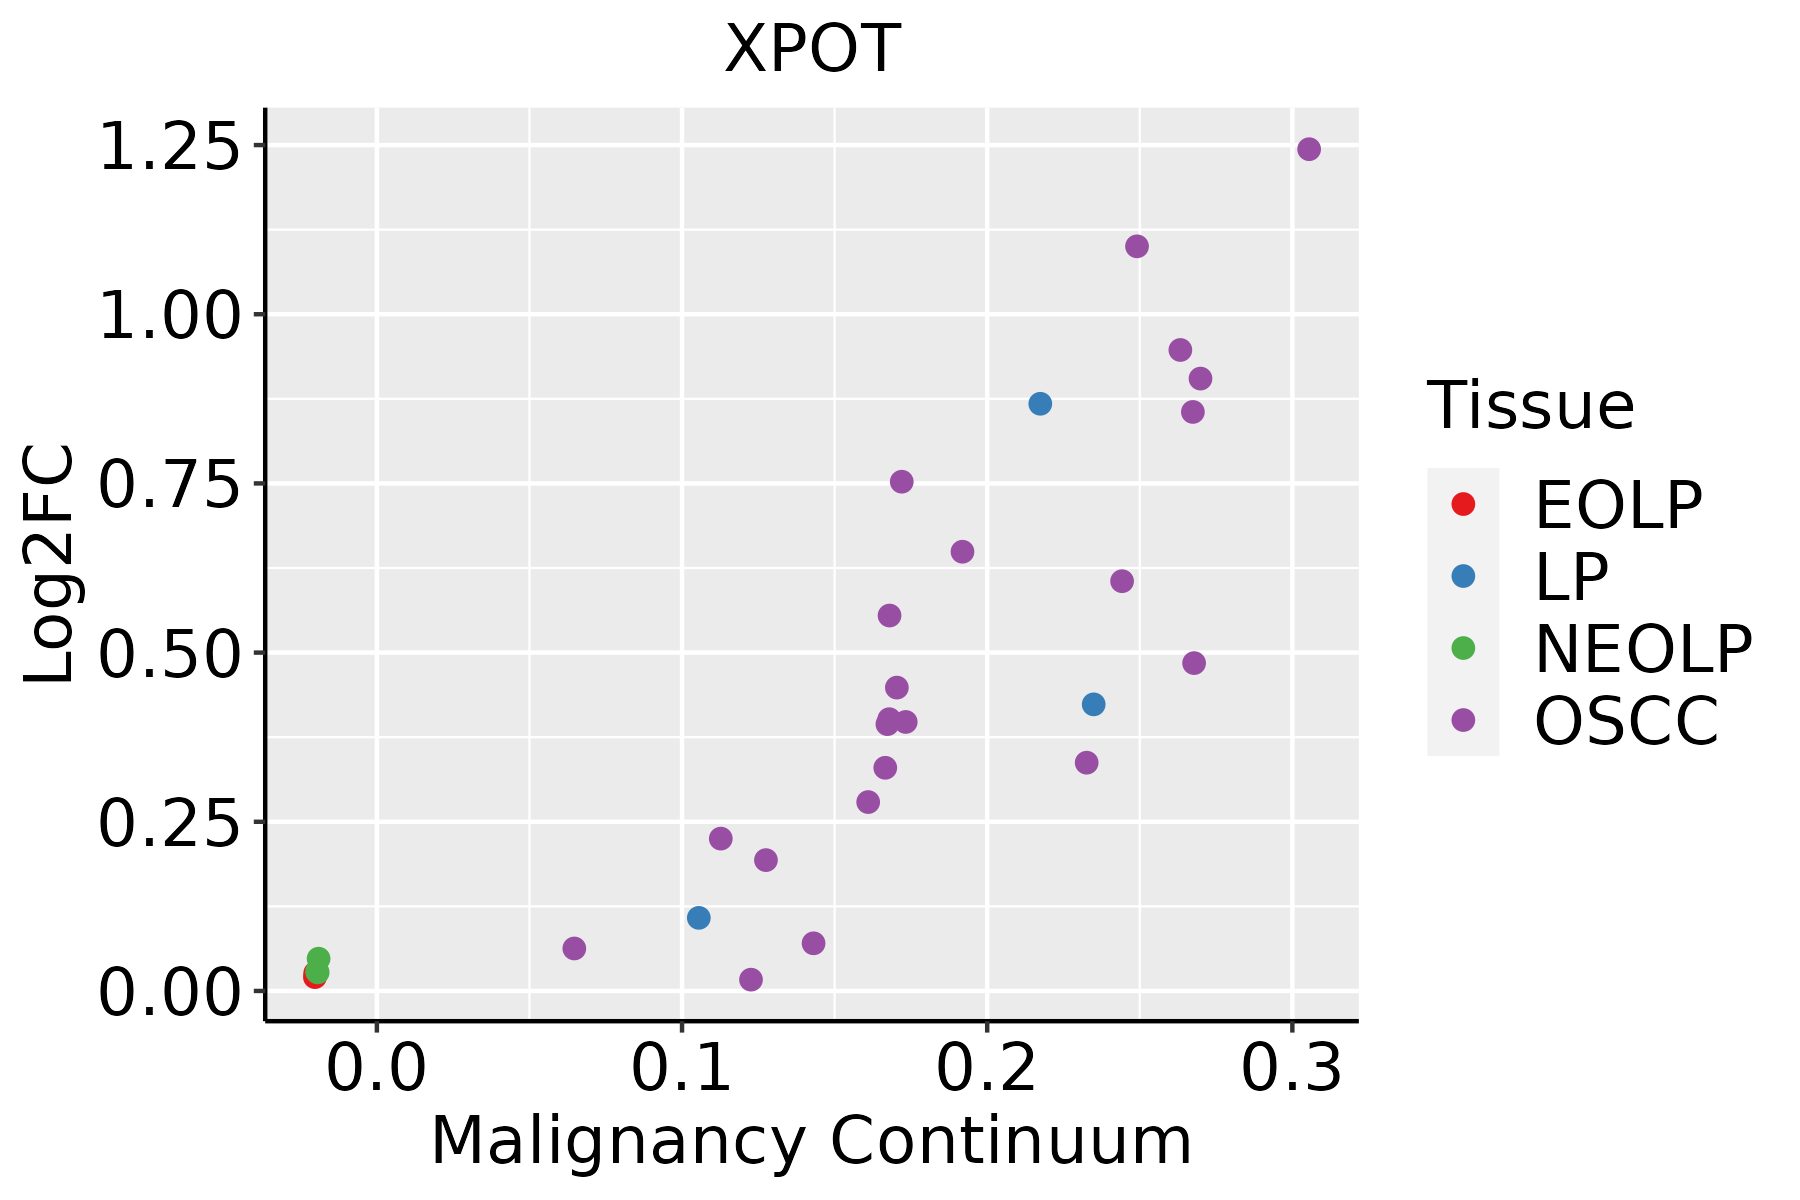 | EOLP: Erosive Oral lichen planus |
| LP: leukoplakia | ||
| NEOLP: Non-erosive oral lichen planus | ||
| OSCC: Oral squamous cell carcinoma | ||
| Skin |  | AK: Actinic keratosis |
| cSCC: Cutaneous squamous cell carcinoma | ||
| SCCIS:squamous cell carcinoma in situ | ||
| Thyroid | 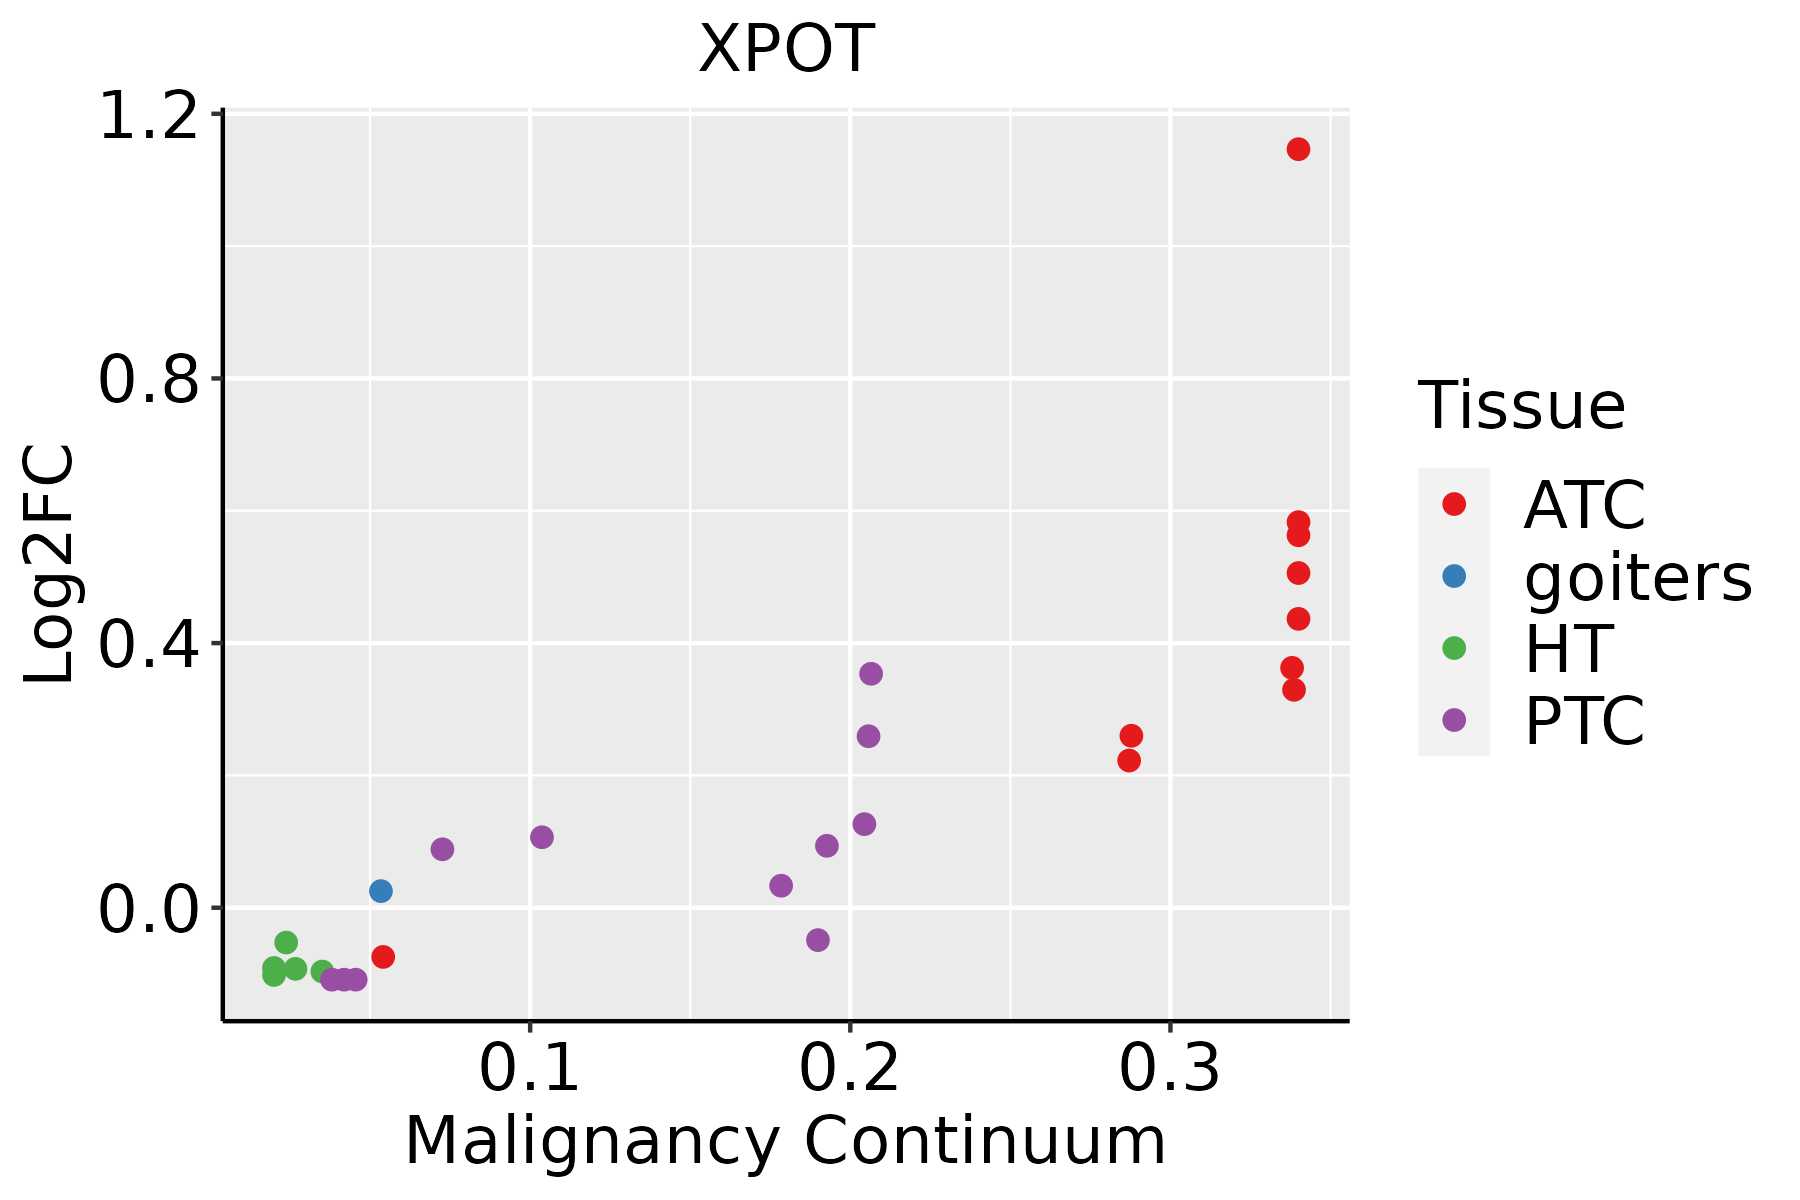 | ATC: Anaplastic thyroid cancer |
| HT: Hashimoto's thyroiditis | ||
| PTC: Papillary thyroid cancer |
| ∗log2FC in expression of this searched gene in stem-like cells from each diseased tissue sample relative to stem-like cells in normal samples in each tissue plotted against the malignancy continuum. Samples are colored based on if they are from different disease stage. |
Top |
Malignant transformation related pathway analysis |
| Find out the enriched GO biological processes and KEGG pathways involved in transition from healthy to precancer to cancer |
| Tissue | Disease Stage | Enriched GO biological Processes |
| Colorectum | AD |  |
| Colorectum | SER |  |
| Colorectum | MSS |  |
| Colorectum | MSI-H |  |
| Colorectum | FAP |  |
| ∗Top 15 enriched GO BP terms are showed in the bar plot of each disease state in each tissue. Each row represents a significant GO biological process which is colored according to the -log10(p.adjust). |
| Page: 1 2 3 4 5 6 7 8 9 |
| GO ID | Tissue | Disease Stage | Description | Gene Ratio | Bg Ratio | pvalue | p.adjust | Count |
| GO:0006913110 | Esophagus | ESCC | nucleocytoplasmic transport | 230/8552 | 301/18723 | 6.04e-28 | 2.02e-25 | 230 |
| GO:0051169110 | Esophagus | ESCC | nuclear transport | 230/8552 | 301/18723 | 6.04e-28 | 2.02e-25 | 230 |
| GO:0006403110 | Esophagus | ESCC | RNA localization | 166/8552 | 201/18723 | 1.95e-27 | 6.18e-25 | 166 |
| GO:005123617 | Esophagus | ESCC | establishment of RNA localization | 134/8552 | 166/18723 | 1.23e-20 | 1.81e-18 | 134 |
| GO:0051168110 | Esophagus | ESCC | nuclear export | 126/8552 | 154/18723 | 1.88e-20 | 2.65e-18 | 126 |
| GO:005065717 | Esophagus | ESCC | nucleic acid transport | 131/8552 | 163/18723 | 6.94e-20 | 8.46e-18 | 131 |
| GO:005065817 | Esophagus | ESCC | RNA transport | 131/8552 | 163/18723 | 6.94e-20 | 8.46e-18 | 131 |
| GO:001593117 | Esophagus | ESCC | nucleobase-containing compound transport | 162/8552 | 222/18723 | 9.87e-17 | 7.93e-15 | 162 |
| GO:007116612 | Esophagus | ESCC | ribonucleoprotein complex localization | 66/8552 | 77/18723 | 2.94e-13 | 1.38e-11 | 66 |
| GO:007142612 | Esophagus | ESCC | ribonucleoprotein complex export from nucleus | 65/8552 | 76/18723 | 5.56e-13 | 2.50e-11 | 65 |
| GO:000640512 | Esophagus | ESCC | RNA export from nucleus | 68/8552 | 84/18723 | 2.99e-11 | 1.01e-09 | 68 |
| GO:003150314 | Esophagus | ESCC | protein-containing complex localization | 139/8552 | 220/18723 | 1.14e-07 | 1.85e-06 | 139 |
| GO:000640321 | Liver | HCC | RNA localization | 151/7958 | 201/18723 | 3.72e-21 | 5.89e-19 | 151 |
| GO:000691322 | Liver | HCC | nucleocytoplasmic transport | 208/7958 | 301/18723 | 5.51e-21 | 8.12e-19 | 208 |
| GO:005116922 | Liver | HCC | nuclear transport | 208/7958 | 301/18723 | 5.51e-21 | 8.12e-19 | 208 |
| GO:005123621 | Liver | HCC | establishment of RNA localization | 121/7958 | 166/18723 | 1.61e-15 | 1.19e-13 | 121 |
| GO:005116822 | Liver | HCC | nuclear export | 113/7958 | 154/18723 | 6.30e-15 | 4.39e-13 | 113 |
| GO:005065711 | Liver | HCC | nucleic acid transport | 118/7958 | 163/18723 | 8.30e-15 | 5.60e-13 | 118 |
| GO:005065811 | Liver | HCC | RNA transport | 118/7958 | 163/18723 | 8.30e-15 | 5.60e-13 | 118 |
| GO:001593111 | Liver | HCC | nucleobase-containing compound transport | 150/7958 | 222/18723 | 3.17e-14 | 2.03e-12 | 150 |
| Page: 1 2 3 4 5 |
| Pathway ID | Tissue | Disease Stage | Description | Gene Ratio | Bg Ratio | pvalue | p.adjust | qvalue | Count |
| hsa0301321 | Esophagus | ESCC | Nucleocytoplasmic transport | 89/4205 | 108/8465 | 1.20e-12 | 2.37e-11 | 1.21e-11 | 89 |
| hsa0301331 | Esophagus | ESCC | Nucleocytoplasmic transport | 89/4205 | 108/8465 | 1.20e-12 | 2.37e-11 | 1.21e-11 | 89 |
| hsa030136 | Oral cavity | OSCC | Nucleocytoplasmic transport | 82/3704 | 108/8465 | 7.93e-12 | 1.33e-10 | 6.77e-11 | 82 |
| hsa0301311 | Oral cavity | OSCC | Nucleocytoplasmic transport | 82/3704 | 108/8465 | 7.93e-12 | 1.33e-10 | 6.77e-11 | 82 |
| hsa030132 | Oral cavity | LP | Nucleocytoplasmic transport | 53/2418 | 108/8465 | 4.68e-06 | 4.10e-05 | 2.64e-05 | 53 |
| hsa030133 | Oral cavity | LP | Nucleocytoplasmic transport | 53/2418 | 108/8465 | 4.68e-06 | 4.10e-05 | 2.64e-05 | 53 |
| Page: 1 |
Top |
Cell-cell communication analysis |
| Identification of potential cell-cell interactions between two cell types and their ligand-receptor pairs for different disease states |
| Ligand | Receptor | LRpair | Pathway | Tissue | Disease Stage |
| Page: 1 |
Top |
Single-cell gene regulatory network inference analysis |
| Find out the significant the regulons (TFs) and the target genes of each regulon across cell types for different disease states |
| TF | Cell Type | Tissue | Disease Stage | Target Gene | RSS | Regulon Activity |
| ∗The dot plots of a searched regulon are shown for all cell subpopulations in each disease state of each tissue based on the regulon specific score inferred using pySCENIC and by calculating the average expression. |
| Page: 1 |
Top |
Somatic mutation of malignant transformation related genes |
| Annotation of somatic variants for genes involved in malignant transformation |
| Hugo Symbol | Variant Class | Variant Classification | dbSNP RS | HGVSc | HGVSp | HGVSp Short | SWISSPROT | BIOTYPE | SIFT | PolyPhen | Tumor Sample Barcode | Tissue | Histology | Sex | Age | Stage | Therapy Types | Drugs | Outcome |
| XPOT | SNV | Missense_Mutation | novel | c.1706N>C | p.Arg569Thr | p.R569T | O43592 | protein_coding | deleterious(0.01) | benign(0.188) | TCGA-3C-AALI-01 | Breast | breast invasive carcinoma | Female | <65 | I/II | Unspecific | Poly E | Complete Response |
| XPOT | SNV | Missense_Mutation | novel | c.2519N>A | p.Ile840Asn | p.I840N | O43592 | protein_coding | deleterious(0.02) | benign(0.003) | TCGA-3C-AALK-01 | Breast | breast invasive carcinoma | Female | <65 | I/II | Chemotherapy | docetaxel | SD |
| XPOT | SNV | Missense_Mutation | c.917G>C | p.Trp306Ser | p.W306S | O43592 | protein_coding | deleterious(0.01) | possibly_damaging(0.446) | TCGA-AN-A0AL-01 | Breast | breast invasive carcinoma | Female | <65 | III/IV | Unknown | Unknown | SD | |
| XPOT | SNV | Missense_Mutation | c.1271T>C | p.Leu424Pro | p.L424P | O43592 | protein_coding | deleterious(0) | probably_damaging(0.972) | TCGA-BH-A0E7-01 | Breast | breast invasive carcinoma | Female | >=65 | I/II | Hormone Therapy | arimidex | SD | |
| XPOT | SNV | Missense_Mutation | c.745N>C | p.Glu249Gln | p.E249Q | O43592 | protein_coding | tolerated(0.05) | probably_damaging(0.946) | TCGA-BH-A0HP-01 | Breast | breast invasive carcinoma | Female | >=65 | III/IV | Chemotherapy | doxorubicin | SD | |
| XPOT | SNV | Missense_Mutation | c.1730C>T | p.Ser577Phe | p.S577F | O43592 | protein_coding | tolerated(0.07) | benign(0.101) | TCGA-D8-A13Z-01 | Breast | breast invasive carcinoma | Female | <65 | I/II | Chemotherapy | doxorubicine | SD | |
| XPOT | SNV | Missense_Mutation | novel | c.367N>C | p.Lys123Gln | p.K123Q | O43592 | protein_coding | tolerated(0.37) | benign(0.072) | TCGA-E9-A3QA-01 | Breast | breast invasive carcinoma | Female | <65 | I/II | Unknown | Unknown | SD |
| XPOT | SNV | Missense_Mutation | c.745N>C | p.Glu249Gln | p.E249Q | O43592 | protein_coding | tolerated(0.05) | probably_damaging(0.946) | TCGA-LD-A74U-01 | Breast | breast invasive carcinoma | Female | >=65 | III/IV | Chemotherapy | taxotere | SD | |
| XPOT | deletion | Frame_Shift_Del | rs762052135 | c.370delN | p.Phe126LeufsTer6 | p.F126Lfs*6 | O43592 | protein_coding | TCGA-A8-A09Z-01 | Breast | breast invasive carcinoma | Female | >=65 | I/II | Unknown | Unknown | SD | ||
| XPOT | insertion | Nonsense_Mutation | novel | c.930_931insCTGCAGCCAGGTCTGTTGTGTTAGGCTGTCTCAGGTTCGGCTCCTG | p.Lys311LeufsTer8 | p.K311Lfs*8 | O43592 | protein_coding | TCGA-AN-A03X-01 | Breast | breast invasive carcinoma | Female | >=65 | I/II | Unknown | Unknown | SD |
| Page: 1 2 3 4 5 6 7 8 9 10 11 12 13 14 15 |
Top |
Related drugs of malignant transformation related genes |
| Identification of chemicals and drugs interact with genes involved in malignant transfromation |
| (DGIdb 4.0) |
| Entrez ID | Symbol | Category | Interaction Types | Drug Claim Name | Drug Name | PMIDs |
| Page: 1 |

Copyright 2023-Present -The University of Texas Health Science Center at Houston |