
|
|||||
|
 | |
| |
| |
| |
| |
| |
|
Gene: XPO6 |
Gene summary for XPO6 |
| Gene information | Species | Human | Gene symbol | XPO6 | Gene ID | 23214 |
| Gene name | exportin 6 | |
| Gene Alias | EXP6 | |
| Cytomap | 16p12.1 | |
| Gene Type | protein-coding | GO ID | GO:0006611 | UniProtAcc | Q96QU8 |
Top |
Malignant transformation analysis |
| Identification of the aberrant gene expression in precancerous and cancerous lesions by comparing the gene expression of stem-like cells in diseased tissues with normal stem cells |
| Entrez ID | Symbol | Replicates | Species | Organ | Tissue | Adj P-value | Log2FC | Malignancy |
| 23214 | XPO6 | LZE7T | Human | Esophagus | ESCC | 9.72e-07 | 4.26e-01 | 0.0667 |
| 23214 | XPO6 | LZE24T | Human | Esophagus | ESCC | 4.36e-05 | 3.23e-01 | 0.0596 |
| 23214 | XPO6 | P1T-E | Human | Esophagus | ESCC | 5.20e-05 | 2.85e-01 | 0.0875 |
| 23214 | XPO6 | P2T-E | Human | Esophagus | ESCC | 2.66e-05 | 1.29e-01 | 0.1177 |
| 23214 | XPO6 | P4T-E | Human | Esophagus | ESCC | 2.01e-18 | 5.15e-01 | 0.1323 |
| 23214 | XPO6 | P5T-E | Human | Esophagus | ESCC | 1.66e-22 | 2.20e-01 | 0.1327 |
| 23214 | XPO6 | P8T-E | Human | Esophagus | ESCC | 5.73e-19 | 2.85e-01 | 0.0889 |
| 23214 | XPO6 | P9T-E | Human | Esophagus | ESCC | 1.48e-04 | 8.26e-02 | 0.1131 |
| 23214 | XPO6 | P10T-E | Human | Esophagus | ESCC | 7.07e-13 | 7.16e-02 | 0.116 |
| 23214 | XPO6 | P12T-E | Human | Esophagus | ESCC | 5.42e-12 | 2.15e-01 | 0.1122 |
| 23214 | XPO6 | P15T-E | Human | Esophagus | ESCC | 9.48e-07 | 1.12e-01 | 0.1149 |
| 23214 | XPO6 | P16T-E | Human | Esophagus | ESCC | 9.61e-10 | 1.12e-01 | 0.1153 |
| 23214 | XPO6 | P17T-E | Human | Esophagus | ESCC | 8.64e-04 | 2.79e-01 | 0.1278 |
| 23214 | XPO6 | P20T-E | Human | Esophagus | ESCC | 1.74e-03 | 1.10e-01 | 0.1124 |
| 23214 | XPO6 | P21T-E | Human | Esophagus | ESCC | 7.49e-17 | 2.72e-01 | 0.1617 |
| 23214 | XPO6 | P22T-E | Human | Esophagus | ESCC | 2.44e-05 | 1.02e-01 | 0.1236 |
| 23214 | XPO6 | P23T-E | Human | Esophagus | ESCC | 5.50e-03 | 1.20e-01 | 0.108 |
| 23214 | XPO6 | P24T-E | Human | Esophagus | ESCC | 2.19e-06 | 1.40e-01 | 0.1287 |
| 23214 | XPO6 | P26T-E | Human | Esophagus | ESCC | 4.90e-15 | 8.66e-02 | 0.1276 |
| 23214 | XPO6 | P27T-E | Human | Esophagus | ESCC | 9.50e-11 | 6.24e-02 | 0.1055 |
| Page: 1 2 3 4 5 |
| Tissue | Expression Dynamics | Abbreviation |
| Esophagus | 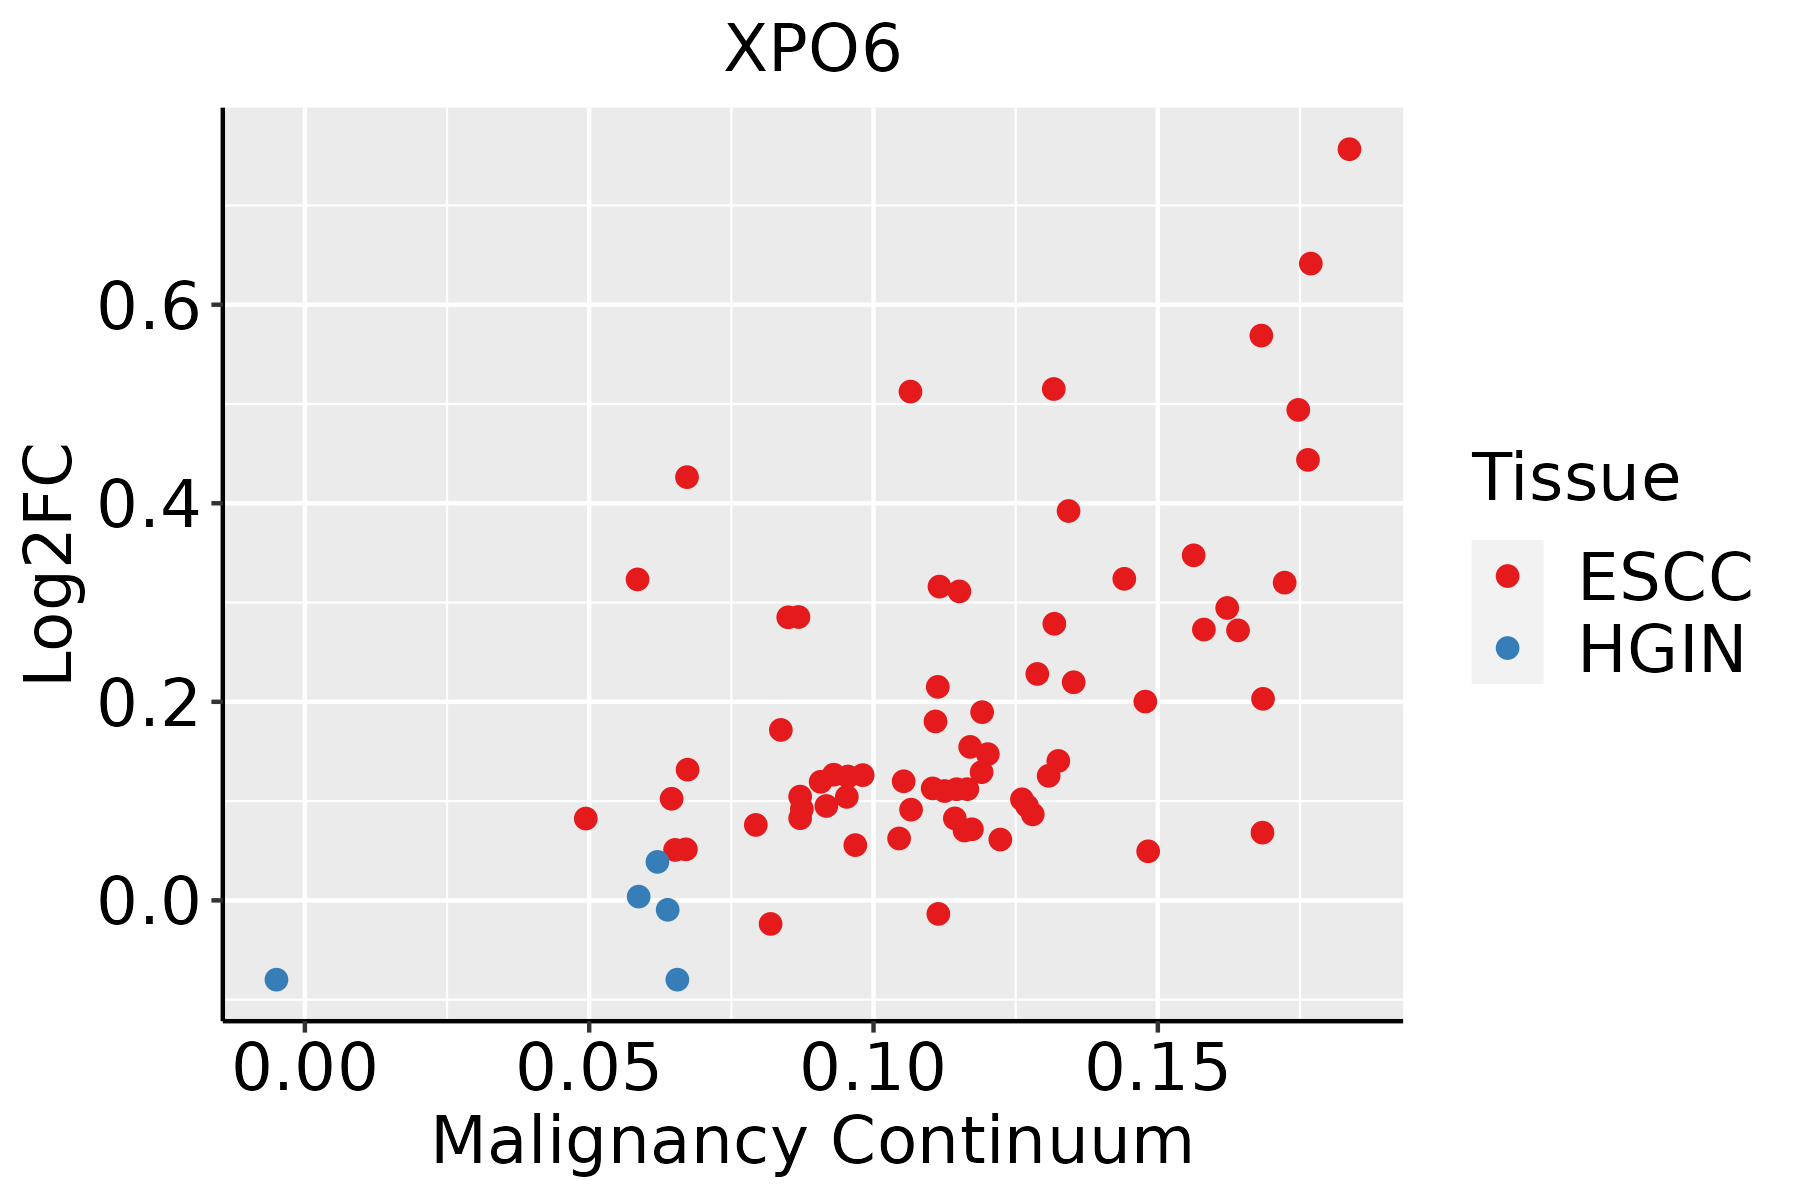 | ESCC: Esophageal squamous cell carcinoma |
| HGIN: High-grade intraepithelial neoplasias | ||
| LGIN: Low-grade intraepithelial neoplasias | ||
| Liver | 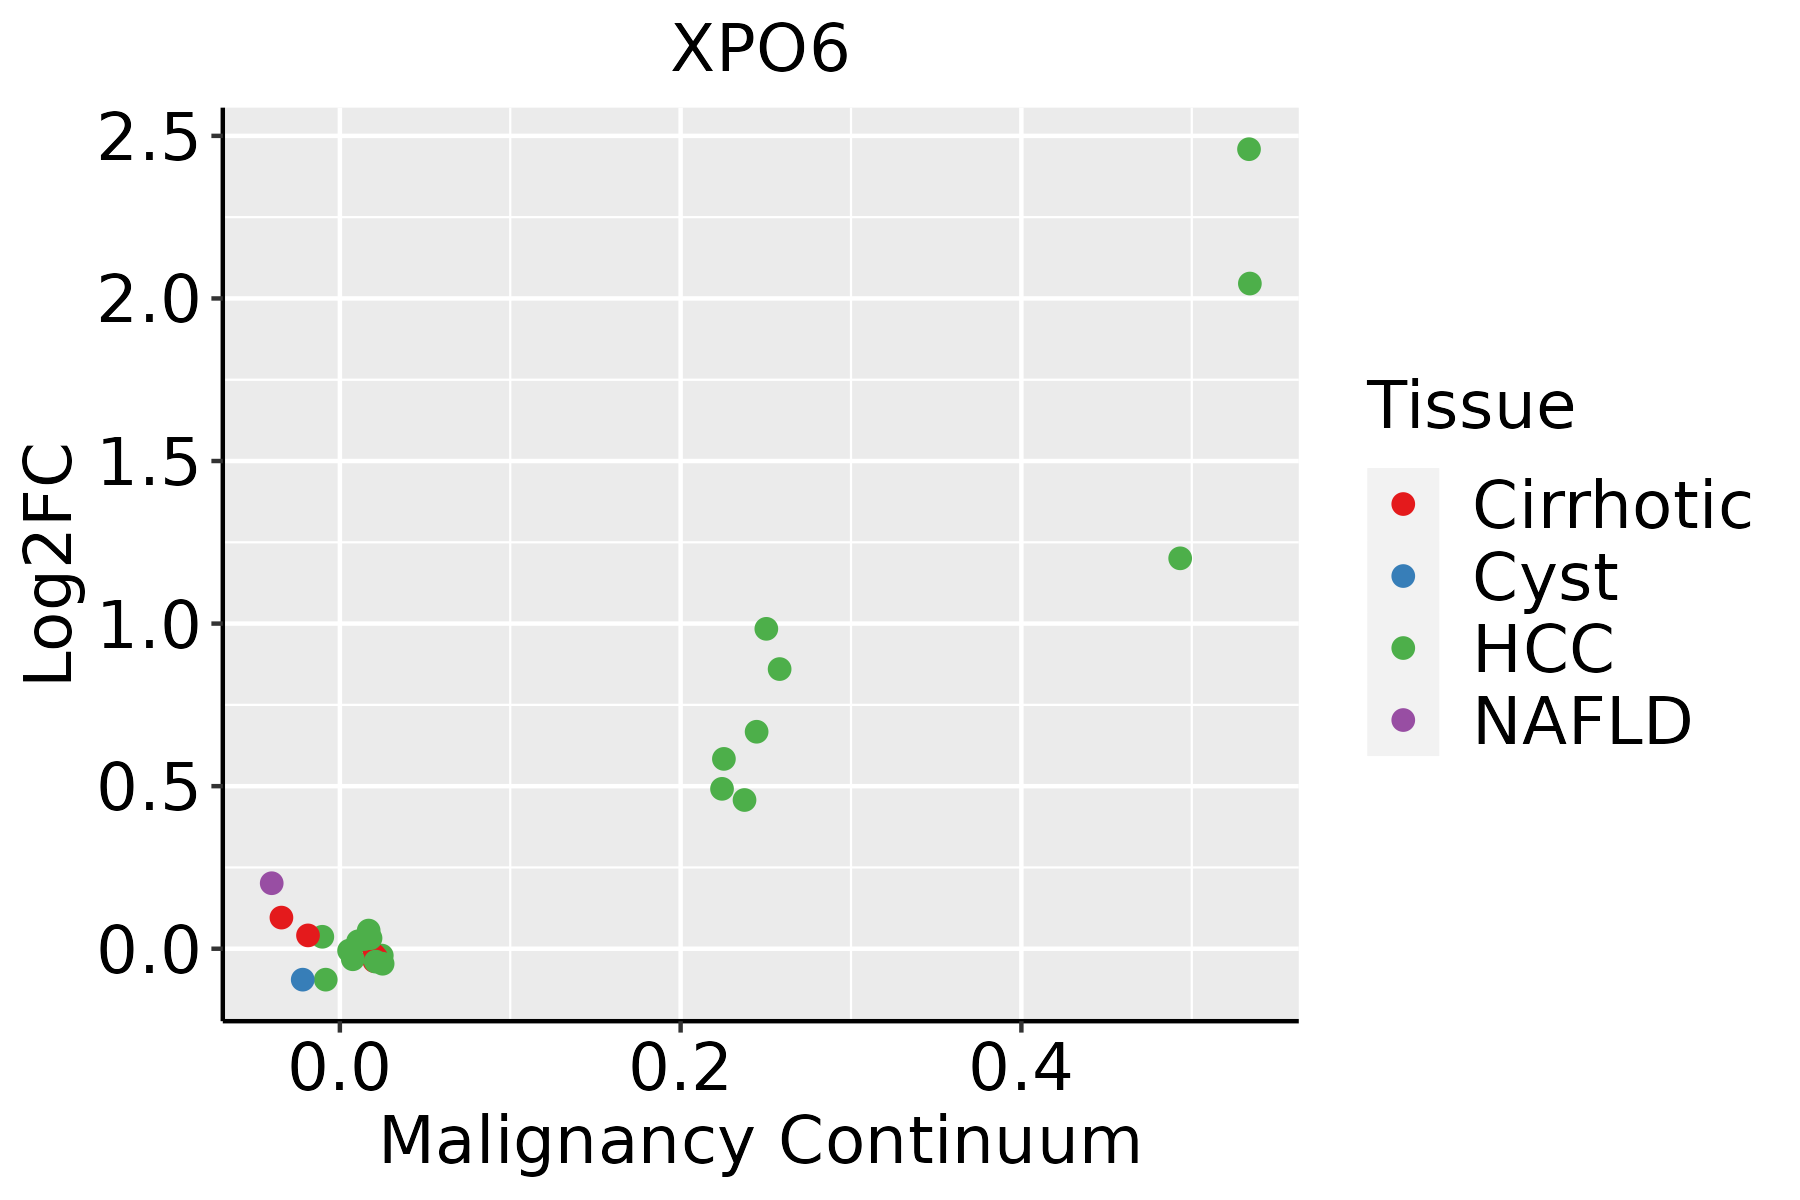 | HCC: Hepatocellular carcinoma |
| NAFLD: Non-alcoholic fatty liver disease | ||
| Oral Cavity | 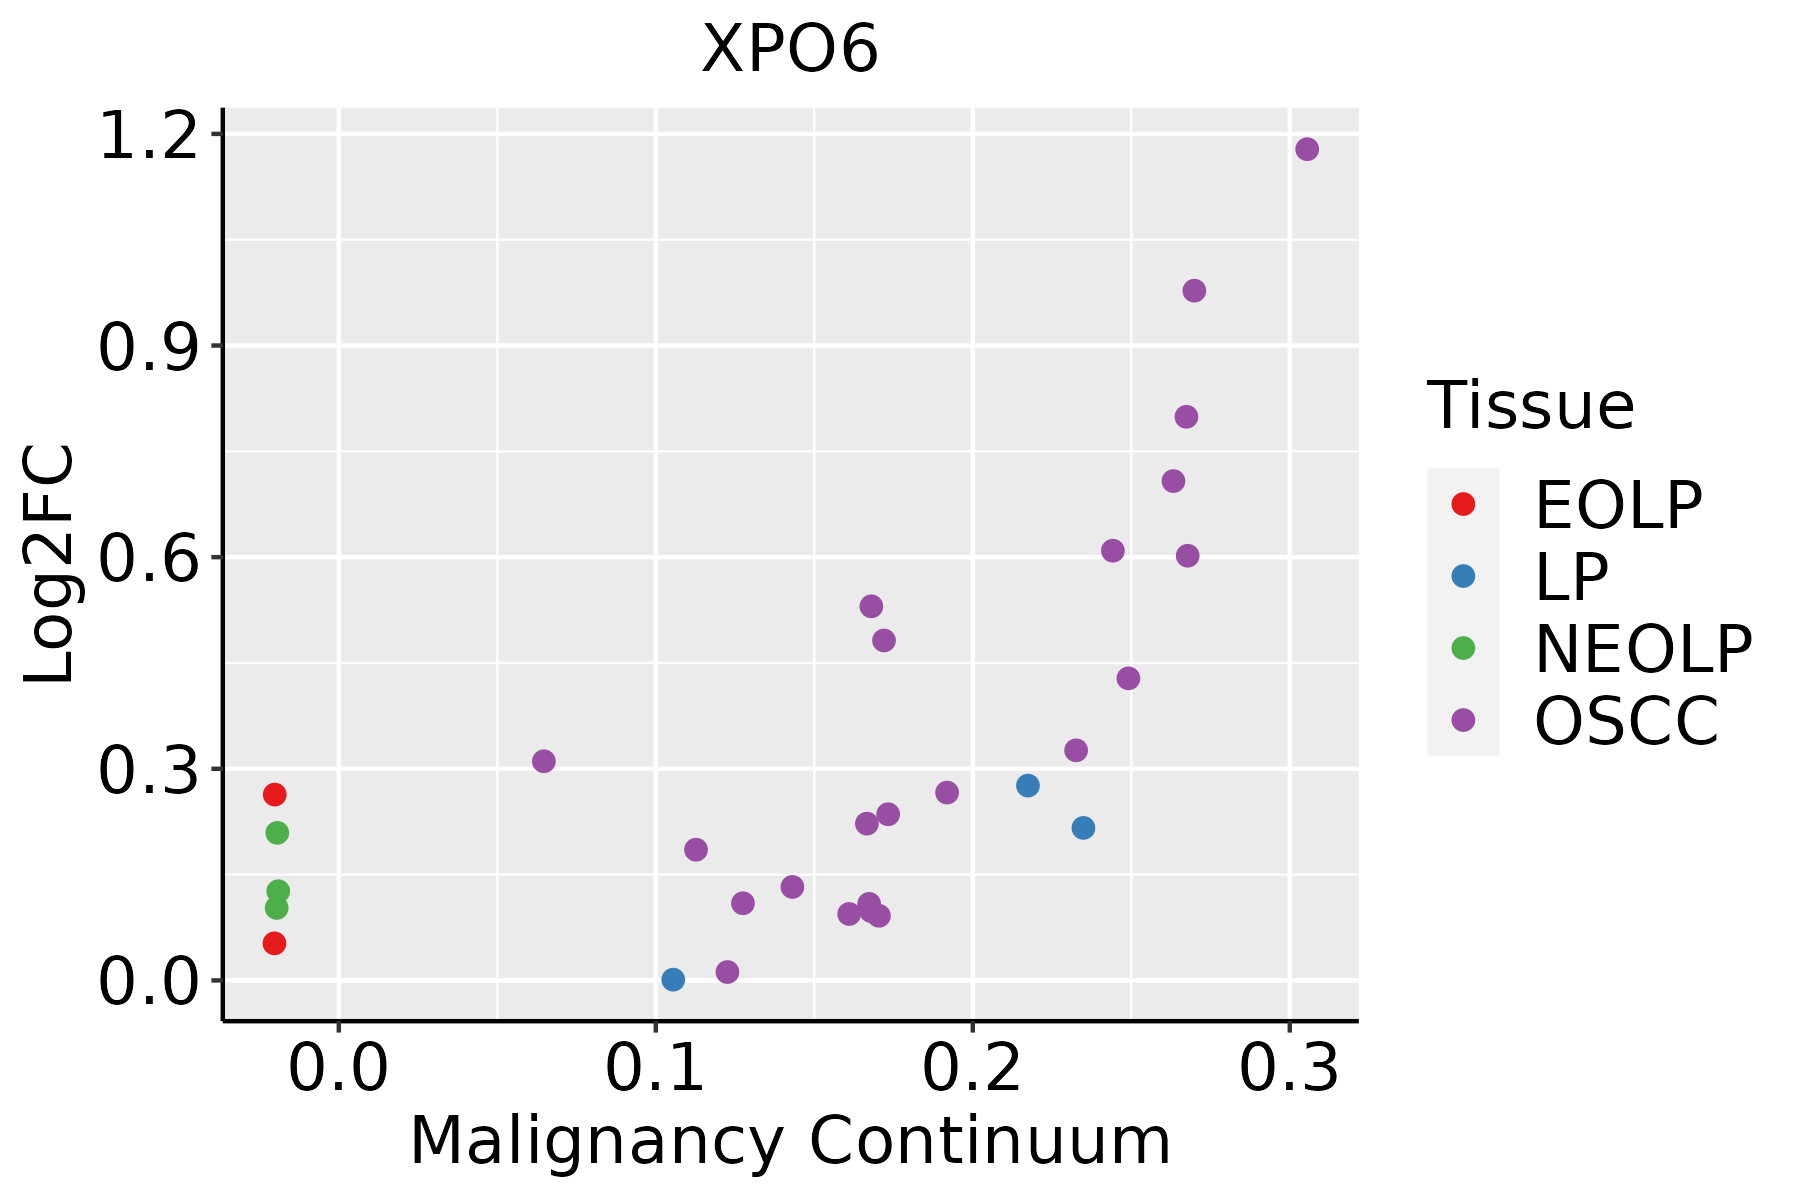 | EOLP: Erosive Oral lichen planus |
| LP: leukoplakia | ||
| NEOLP: Non-erosive oral lichen planus | ||
| OSCC: Oral squamous cell carcinoma | ||
| Skin | 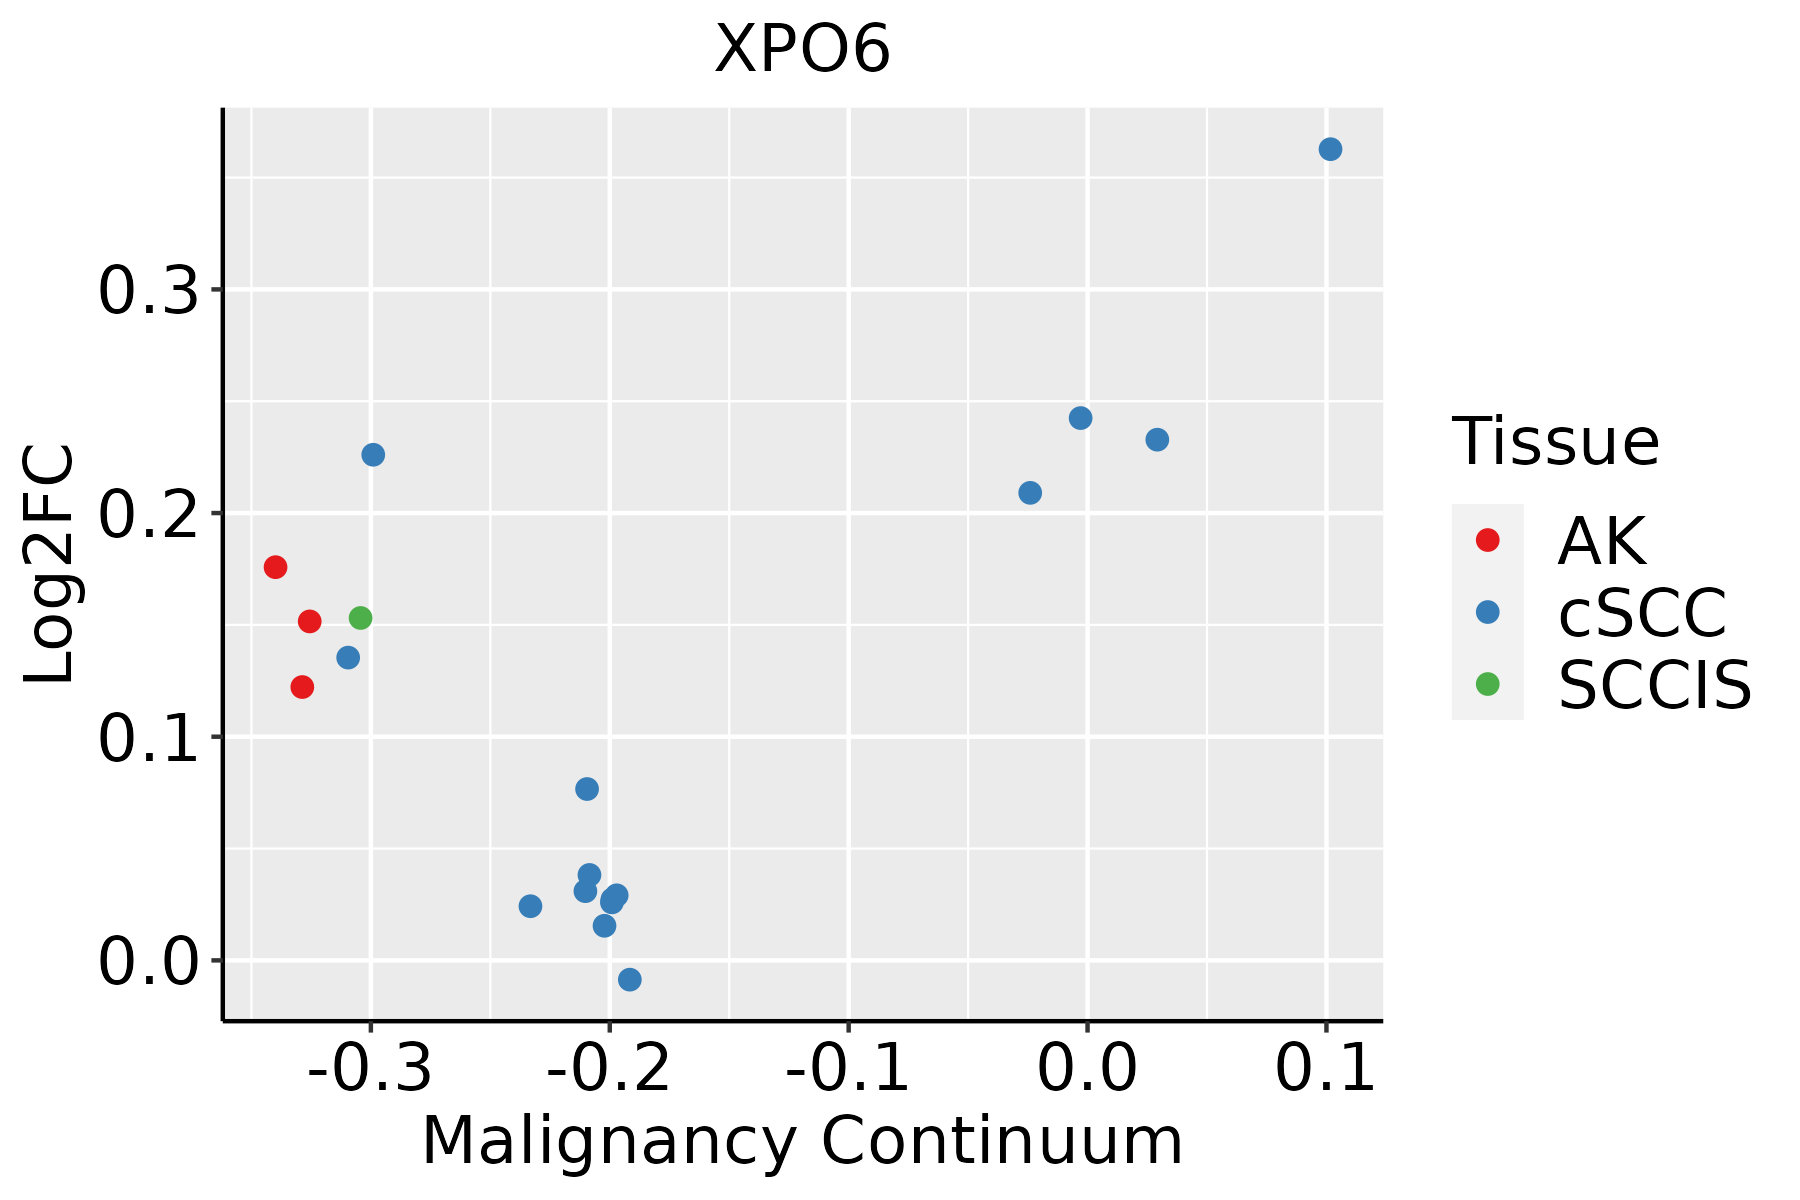 | AK: Actinic keratosis |
| cSCC: Cutaneous squamous cell carcinoma | ||
| SCCIS:squamous cell carcinoma in situ |
| ∗log2FC in expression of this searched gene in stem-like cells from each diseased tissue sample relative to stem-like cells in normal samples in each tissue plotted against the malignancy continuum. Samples are colored based on if they are from different disease stage. |
Top |
Malignant transformation related pathway analysis |
| Find out the enriched GO biological processes and KEGG pathways involved in transition from healthy to precancer to cancer |
| Tissue | Disease Stage | Enriched GO biological Processes |
| Colorectum | AD |  |
| Colorectum | SER |  |
| Colorectum | MSS |  |
| Colorectum | MSI-H |  |
| Colorectum | FAP |  |
| ∗Top 15 enriched GO BP terms are showed in the bar plot of each disease state in each tissue. Each row represents a significant GO biological process which is colored according to the -log10(p.adjust). |
| Page: 1 2 3 4 5 6 7 8 9 |
| GO ID | Tissue | Disease Stage | Description | Gene Ratio | Bg Ratio | pvalue | p.adjust | Count |
| GO:0006913110 | Esophagus | ESCC | nucleocytoplasmic transport | 230/8552 | 301/18723 | 6.04e-28 | 2.02e-25 | 230 |
| GO:0051169110 | Esophagus | ESCC | nuclear transport | 230/8552 | 301/18723 | 6.04e-28 | 2.02e-25 | 230 |
| GO:0051168110 | Esophagus | ESCC | nuclear export | 126/8552 | 154/18723 | 1.88e-20 | 2.65e-18 | 126 |
| GO:000661117 | Esophagus | ESCC | protein export from nucleus | 48/8552 | 57/18723 | 1.92e-09 | 4.39e-08 | 48 |
| GO:000691312 | Liver | Cirrhotic | nucleocytoplasmic transport | 118/4634 | 301/18723 | 1.71e-08 | 6.27e-07 | 118 |
| GO:005116912 | Liver | Cirrhotic | nuclear transport | 118/4634 | 301/18723 | 1.71e-08 | 6.27e-07 | 118 |
| GO:005116812 | Liver | Cirrhotic | nuclear export | 67/4634 | 154/18723 | 2.57e-07 | 6.41e-06 | 67 |
| GO:00066114 | Liver | Cirrhotic | protein export from nucleus | 27/4634 | 57/18723 | 1.74e-04 | 1.63e-03 | 27 |
| GO:000691322 | Liver | HCC | nucleocytoplasmic transport | 208/7958 | 301/18723 | 5.51e-21 | 8.12e-19 | 208 |
| GO:005116922 | Liver | HCC | nuclear transport | 208/7958 | 301/18723 | 5.51e-21 | 8.12e-19 | 208 |
| GO:005116822 | Liver | HCC | nuclear export | 113/7958 | 154/18723 | 6.30e-15 | 4.39e-13 | 113 |
| GO:000661112 | Liver | HCC | protein export from nucleus | 42/7958 | 57/18723 | 1.75e-06 | 2.45e-05 | 42 |
| GO:000691317 | Oral cavity | OSCC | nucleocytoplasmic transport | 204/7305 | 301/18723 | 2.65e-24 | 6.98e-22 | 204 |
| GO:005116917 | Oral cavity | OSCC | nuclear transport | 204/7305 | 301/18723 | 2.65e-24 | 6.98e-22 | 204 |
| GO:005116817 | Oral cavity | OSCC | nuclear export | 112/7305 | 154/18723 | 1.70e-17 | 1.56e-15 | 112 |
| GO:00066119 | Oral cavity | OSCC | protein export from nucleus | 42/7305 | 57/18723 | 1.10e-07 | 1.87e-06 | 42 |
| GO:000691323 | Oral cavity | EOLP | nucleocytoplasmic transport | 87/2218 | 301/18723 | 7.30e-16 | 4.37e-13 | 87 |
| GO:005116923 | Oral cavity | EOLP | nuclear transport | 87/2218 | 301/18723 | 7.30e-16 | 4.37e-13 | 87 |
| GO:005116824 | Oral cavity | EOLP | nuclear export | 47/2218 | 154/18723 | 4.45e-10 | 3.76e-08 | 47 |
| GO:000661123 | Oral cavity | EOLP | protein export from nucleus | 19/2218 | 57/18723 | 1.70e-05 | 2.79e-04 | 19 |
| Page: 1 2 |
| Pathway ID | Tissue | Disease Stage | Description | Gene Ratio | Bg Ratio | pvalue | p.adjust | qvalue | Count |
| hsa0301321 | Esophagus | ESCC | Nucleocytoplasmic transport | 89/4205 | 108/8465 | 1.20e-12 | 2.37e-11 | 1.21e-11 | 89 |
| hsa0301331 | Esophagus | ESCC | Nucleocytoplasmic transport | 89/4205 | 108/8465 | 1.20e-12 | 2.37e-11 | 1.21e-11 | 89 |
| hsa03013 | Liver | HCC | Nucleocytoplasmic transport | 81/4020 | 108/8465 | 4.28e-09 | 6.83e-08 | 3.80e-08 | 81 |
| hsa030131 | Liver | HCC | Nucleocytoplasmic transport | 81/4020 | 108/8465 | 4.28e-09 | 6.83e-08 | 3.80e-08 | 81 |
| hsa030136 | Oral cavity | OSCC | Nucleocytoplasmic transport | 82/3704 | 108/8465 | 7.93e-12 | 1.33e-10 | 6.77e-11 | 82 |
| hsa0301311 | Oral cavity | OSCC | Nucleocytoplasmic transport | 82/3704 | 108/8465 | 7.93e-12 | 1.33e-10 | 6.77e-11 | 82 |
| Page: 1 |
Top |
Cell-cell communication analysis |
| Identification of potential cell-cell interactions between two cell types and their ligand-receptor pairs for different disease states |
| Ligand | Receptor | LRpair | Pathway | Tissue | Disease Stage |
| Page: 1 |
Top |
Single-cell gene regulatory network inference analysis |
| Find out the significant the regulons (TFs) and the target genes of each regulon across cell types for different disease states |
| TF | Cell Type | Tissue | Disease Stage | Target Gene | RSS | Regulon Activity |
| ∗The dot plots of a searched regulon are shown for all cell subpopulations in each disease state of each tissue based on the regulon specific score inferred using pySCENIC and by calculating the average expression. |
| Page: 1 |
Top |
Somatic mutation of malignant transformation related genes |
| Annotation of somatic variants for genes involved in malignant transformation |
| Hugo Symbol | Variant Class | Variant Classification | dbSNP RS | HGVSc | HGVSp | HGVSp Short | SWISSPROT | BIOTYPE | SIFT | PolyPhen | Tumor Sample Barcode | Tissue | Histology | Sex | Age | Stage | Therapy Types | Drugs | Outcome |
| XPO6 | SNV | Missense_Mutation | c.836N>A | p.Arg279Gln | p.R279Q | Q96QU8 | protein_coding | tolerated(0.25) | benign(0.387) | TCGA-A8-A081-01 | Breast | breast invasive carcinoma | Female | >=65 | I/II | Unknown | Unknown | SD | |
| XPO6 | SNV | Missense_Mutation | novel | c.375N>G | p.Phe125Leu | p.F125L | Q96QU8 | protein_coding | deleterious(0.03) | possibly_damaging(0.715) | TCGA-AC-A5XS-01 | Breast | breast invasive carcinoma | Female | >=65 | I/II | Hormone Therapy | femara | SD |
| XPO6 | SNV | Missense_Mutation | c.1280N>G | p.Tyr427Cys | p.Y427C | Q96QU8 | protein_coding | deleterious(0) | possibly_damaging(0.781) | TCGA-B6-A0IH-01 | Breast | breast invasive carcinoma | Female | >=65 | III/IV | Unknown | Unknown | SD | |
| XPO6 | SNV | Missense_Mutation | c.854N>A | p.Arg285Gln | p.R285Q | Q96QU8 | protein_coding | tolerated(0.19) | benign(0.217) | TCGA-C8-A1HI-01 | Breast | breast invasive carcinoma | Female | <65 | III/IV | Unknown | Unknown | SD | |
| XPO6 | SNV | Missense_Mutation | novel | c.3310N>A | p.Leu1104Met | p.L1104M | Q96QU8 | protein_coding | deleterious(0.04) | possibly_damaging(0.483) | TCGA-C8-A26X-01 | Breast | breast invasive carcinoma | Female | <65 | I/II | Chemotherapy | 5-fluorouracil | CR |
| XPO6 | SNV | Missense_Mutation | c.2187N>G | p.Ile729Met | p.I729M | Q96QU8 | protein_coding | tolerated(0.43) | benign(0) | TCGA-C8-A26Y-01 | Breast | breast invasive carcinoma | Female | >=65 | I/II | Unknown | Unknown | SD | |
| XPO6 | SNV | Missense_Mutation | c.2285A>G | p.Tyr762Cys | p.Y762C | Q96QU8 | protein_coding | deleterious(0) | possibly_damaging(0.862) | TCGA-D8-A1XK-01 | Breast | breast invasive carcinoma | Female | <65 | I/II | Chemotherapy | doxorubicine+cyclophosphamide | SD | |
| XPO6 | insertion | Nonsense_Mutation | novel | c.2655_2656insAGGCAGGCTTTGGTGTCTGTCTGCCAGGATTGCTGAGGGA | p.Cys886ArgfsTer12 | p.C886Rfs*12 | Q96QU8 | protein_coding | TCGA-A8-A095-01 | Breast | breast invasive carcinoma | Female | <65 | I/II | Chemotherapy | 5-fluorouracil | CR | ||
| XPO6 | insertion | Frame_Shift_Ins | novel | c.2590_2591insGGGAGCATTCGCTTTCAGGG | p.Thr864ArgfsTer18 | p.T864Rfs*18 | Q96QU8 | protein_coding | TCGA-AR-A0TY-01 | Breast | breast invasive carcinoma | Female | <65 | I/II | Unspecific | Paclitaxel | PD | ||
| XPO6 | insertion | Frame_Shift_Ins | novel | c.988_989insCTTCCTATTGCCCTGTGAAAGCTGAGAGGTGCCTGGGAGC | p.Glu330AlafsTer35 | p.E330Afs*35 | Q96QU8 | protein_coding | TCGA-AR-A0TY-01 | Breast | breast invasive carcinoma | Female | <65 | I/II | Unspecific | Paclitaxel | PD |
| Page: 1 2 3 4 5 6 7 8 9 10 11 12 13 |
Top |
Related drugs of malignant transformation related genes |
| Identification of chemicals and drugs interact with genes involved in malignant transfromation |
| (DGIdb 4.0) |
| Entrez ID | Symbol | Category | Interaction Types | Drug Claim Name | Drug Name | PMIDs |
| Page: 1 |

Copyright 2023-Present -The University of Texas Health Science Center at Houston |